Covid Migration

Yep, Covid-19 remains a thing. About a month or so ago, an article in City Lab (now owned by Bloomburg), looked at the data to see if there was any truth in the notion that people are fleeing urban areas. Spoiler: they’re not, except in a few places. The entire article is well worth a read, as it looks at what is actually happening in migration and why some cities like New York and San Francisco are outliers.

But I want to look at some of the graphics going on inside the article, because those are what struck me more than the content itself. Let’s start with this map titled “Change in Moves”, which examines “the percentage drop in moves between March 11 and June 30 compared to last year”.

Conventionally, what would we expect from this kind of choropleth map. We have a sequential stepped gradient headed in one direction, from dark to light. Presumably we are looking at one metric, change in movement, in one direction, the drop or negative.

But look at that legend. Note the presence of the positive 4—there is an entire positive range within this stepped gradient. Conventionally we would expect to see some kind of red equals drop, blue equals gain split at the zero point. Others might create a grey bin to cover a negative one to positive one slight-to-no change set of states. Here, though, we don’t have that. Nor do we even get a natural split, instead the dark bin goes to a slightly less dark bin at positive four, so everything less than four through -16 is in the darker bin.

Look at the language, too, because that’s where it becomes potentially more confusing. If the choropleth largely focuses on the “percentage drop” and has negative numbers, a negative of a negative would be…a positive. A -25% drop in Texas could easily be mistaken with its use of double negatives. Compare Texas to Nebraska, which had a 2% drop. Does that mean Nebraska actually declined by 2%, or does it mean it rose by 2%?

A clean up in the data definition to, say, “Percentage change in moves from…” could clear up a lot of this ambiguity. Changing the colour scheme from a single gradient to a divergent one, with a split around zero (perhaps with a bin for little-to-no change), would make it clearer which states were in the positive and which were in the negative.

The article continues with another peculiar choice in its bar charts when it explores the data on specific cities.
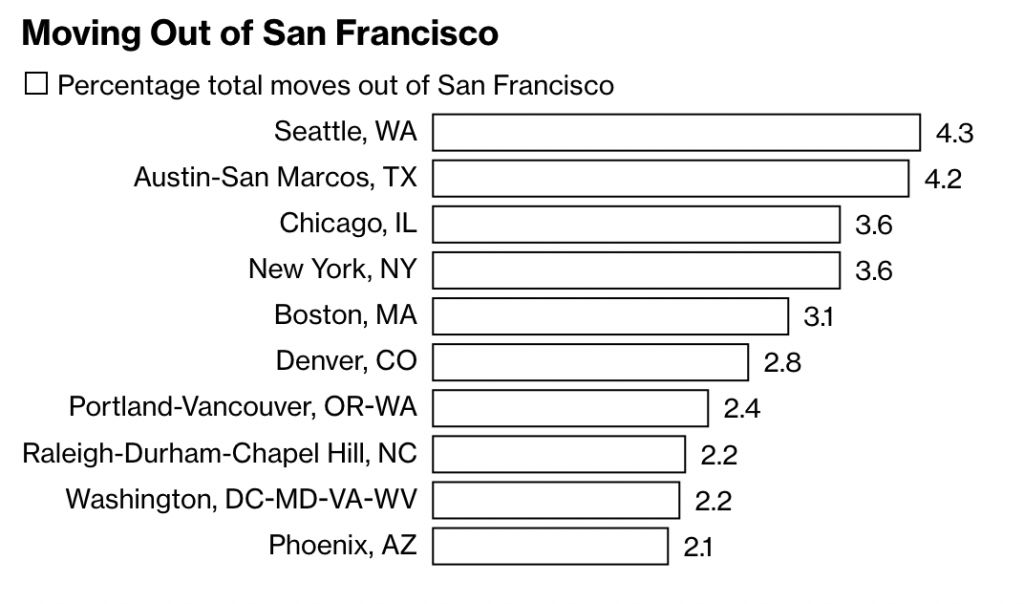
Here we see the destinations of people moving out of San Francisco, using, as a note explains, requests for quotes as a proxy for the numbers of actual moves. What interests me here is the minimalist take on the bar charts. Note the absence of an axis, which leaves the bars almost groundless for comparison, except that the designer attached data labels to the ends of the bars.

Normally data labels are redundant. The point of a visualisation is to visualise the comparison of data sets. If hyper precise differences to the decimal point are required, tables often are a better choice. But here, there are no axis labels to inform the user as to what the length of a bar means.

It’s a peculiar design decision. If we think of labelling as data ink, is this a more efficient use with data labels than just axis labels? I would venture to say no. You would probably have five axis labels (0–4) and then a line to connect them. That’s probably less ink/pixels than the data labels here. I prefer axis lines to help guide the user from labels up (in this case) through the bars. Maybe the axis lines make for more data ink than the labels? It’s hard to say.

Regardless, this is a peculiar decision. Though, I should note it’s eminently more defensible than the choropleth map, which needs a rethink in both design and language.

Credit for the piece goes to Marie Patino.

The Shifting Suburbs

Last we looked at the revenge of the flyover states, the idea that smaller cities in swing states are trending Republican and defeating the growing Democratic majority in big cities. This week I want to take a look at something a few weeks back, a piece from CityLab about the elections in Virginia, Kentucky, and Mississippi.

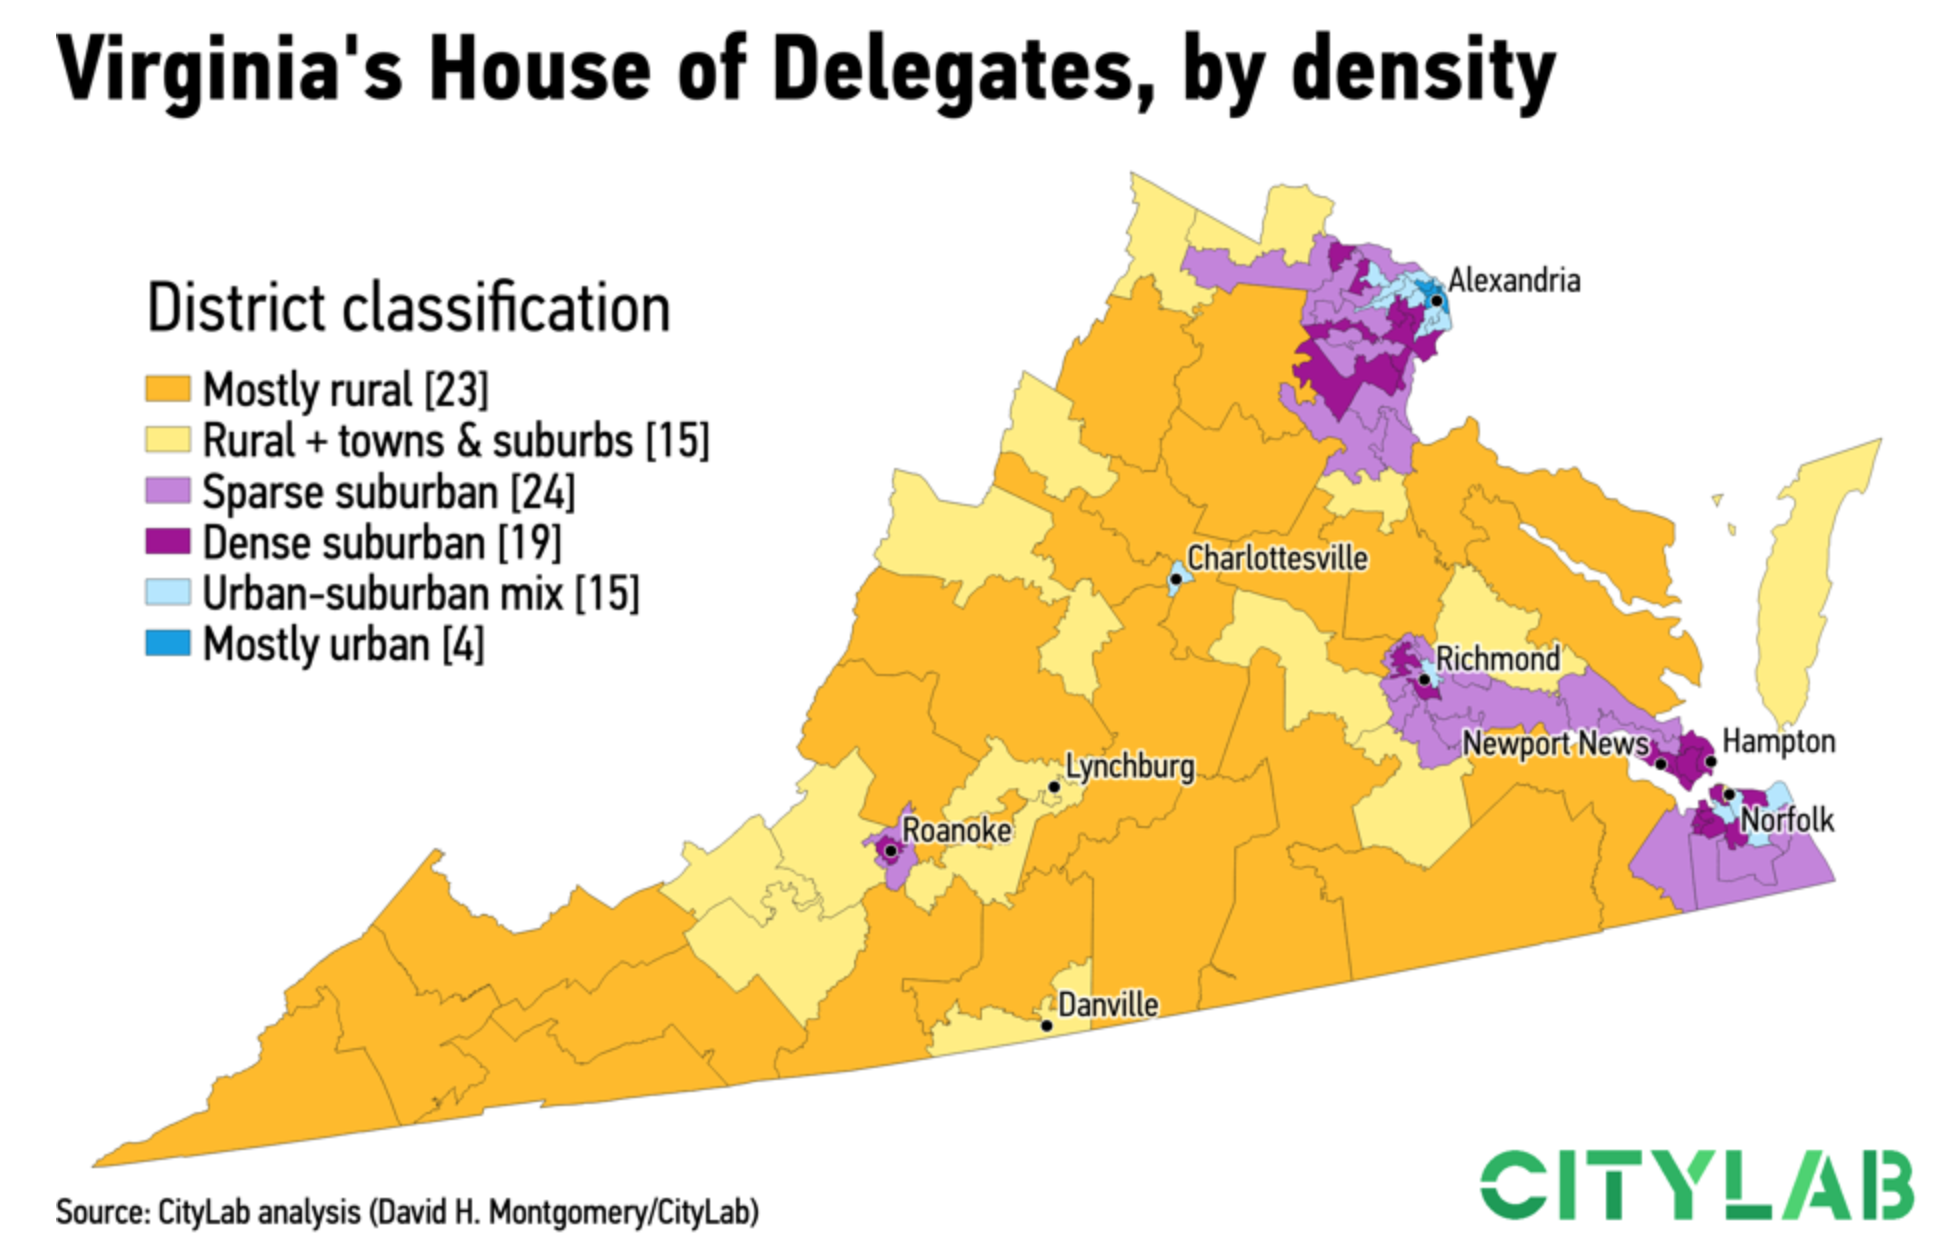
There’s nothing radical in this piece. Instead, it’s some solid uses of line charts and bar charts (though I still don’t generally love them stacked). The big flashy graphic was this, a map of Virginia’s state legislative districts, but mapped not by party but by population density.

Democrats now control a majority of these seats.

It classified districts by how how urban, suburban, or rural (or parts thereof) each district was. Of course the premise of the article is that the suburbs are becoming increasingly Democratic and rural areas increasingly Republican.

But it all goes to show that 2020 is going to be a very polarised year.

Credit for the piece goes to David Montgomery.

Mapping the Growth of Cities

This is an older piece from back in August, but I was waiting for a time when I would have some related articles to post alongside it. To start off the series of posts, we start with this piece from CityLab. As my titles implies, it looks at the growth of cities, but not in terms of people or technology but in terms of area/land.

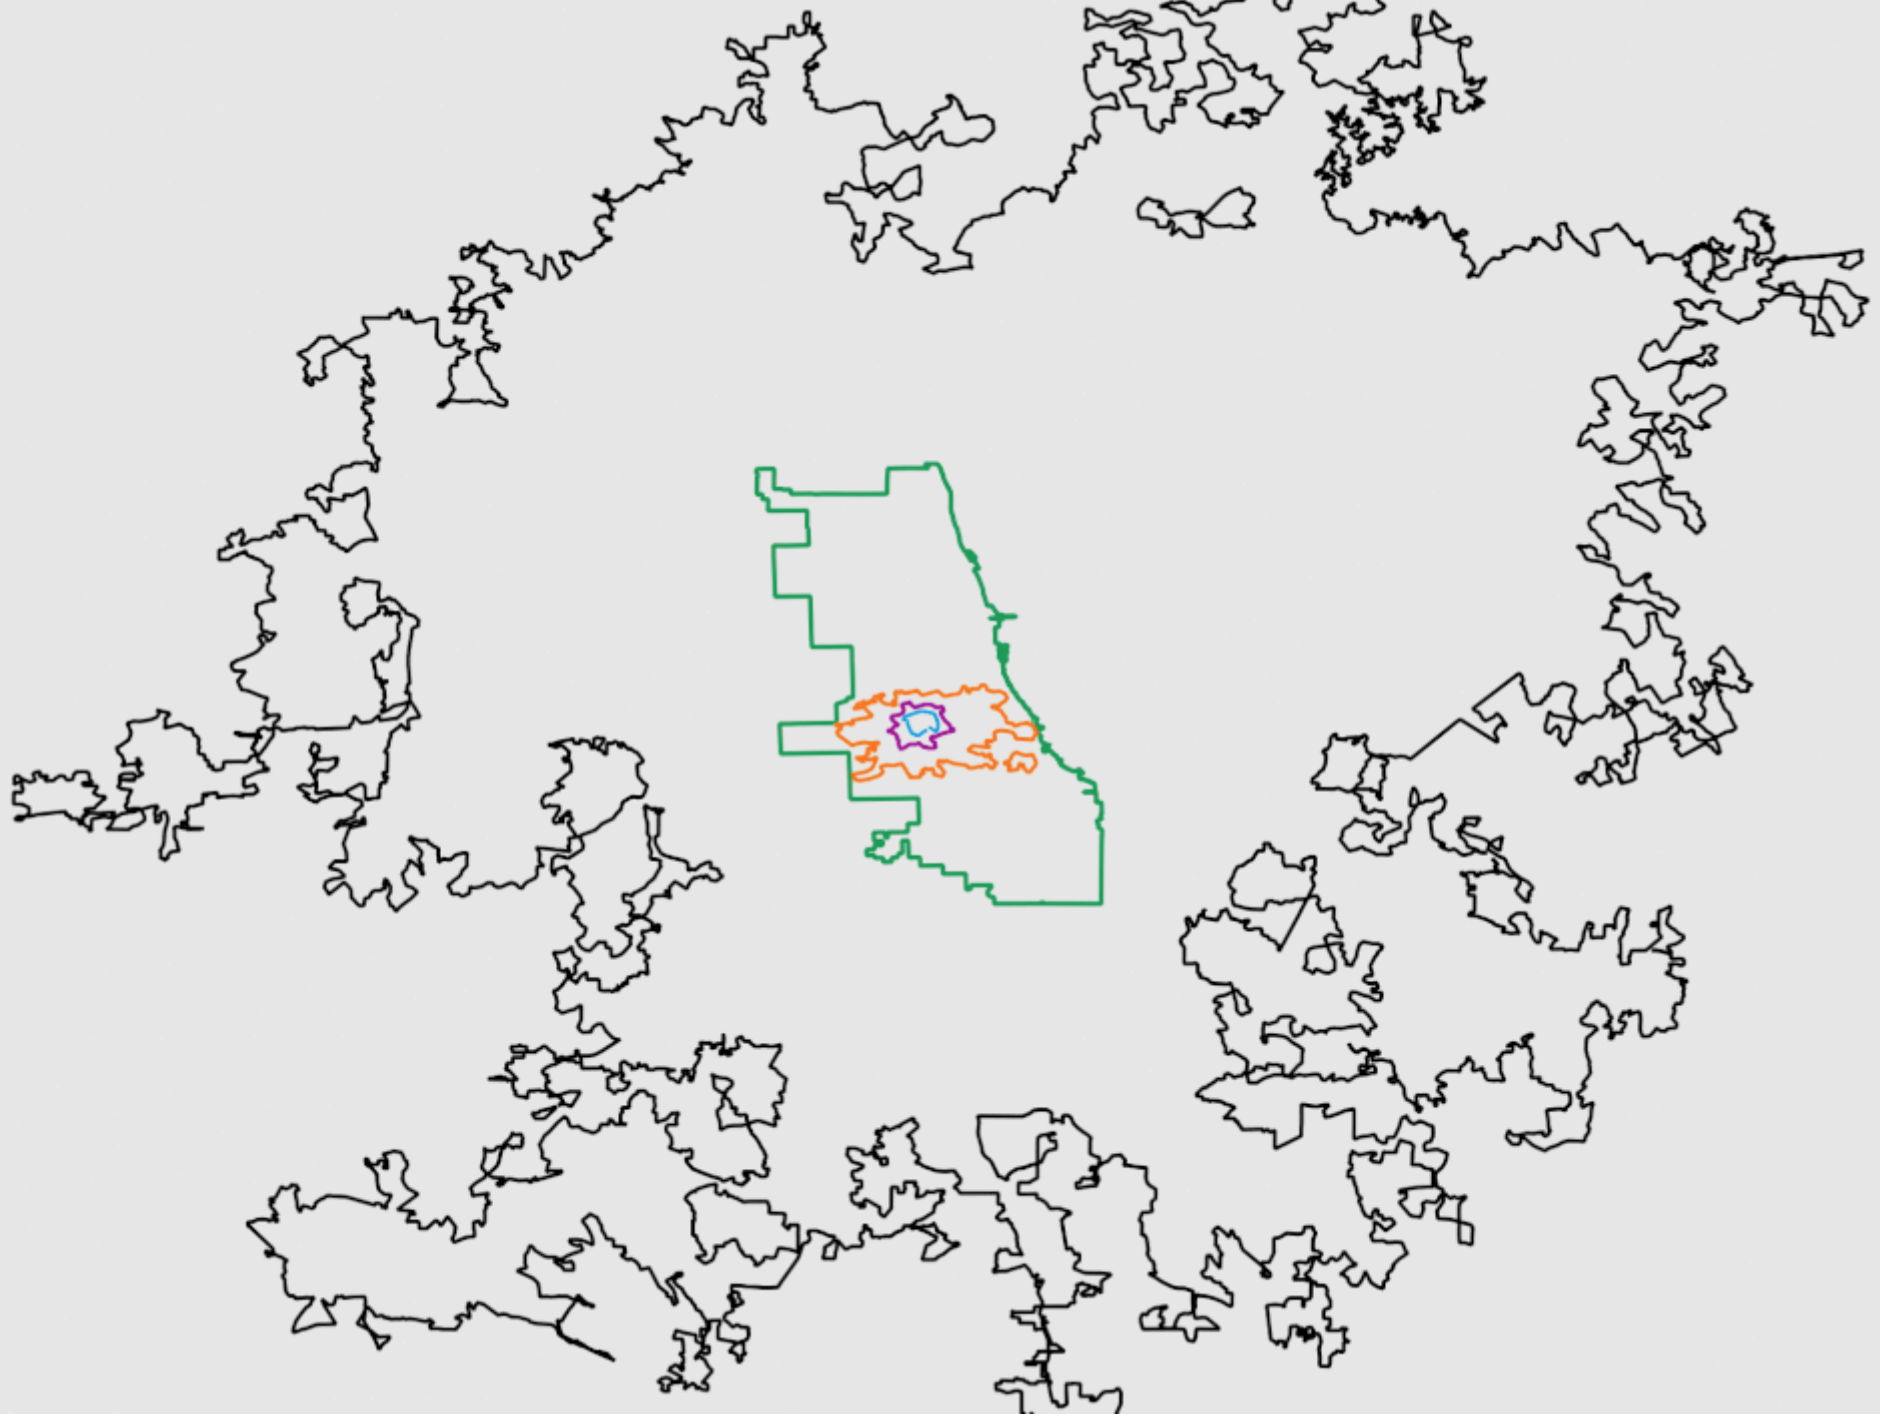
The basic premise is that people look for a 30-minute commute and have done so throughout history. To make that point, the authors look at how transport technology evolved to enable people to live and work at further distances from each other, expanding the urban core.

The designer then chose to overlay the city limits of several cities largely defined by these technologies atop each other.

From small, compact, and dense to large, sprawling, and fluffy.

Conceptually the graphic works really well. The screenshot is of an animated. gif leading into the article that step-by-step reveals each city. However, throughout the article, each de facto section is introduced by a city outline graphic.

The graphic does a really nice job of showing how as technology allowed us to move faster, people chose to be further removed from the city core. Of course there are often multiple factors in why people may move out of the core, but transport certainly facilitates it.

Credit for the piece goes to David Montgomery.

How Worldly Is the World Series?

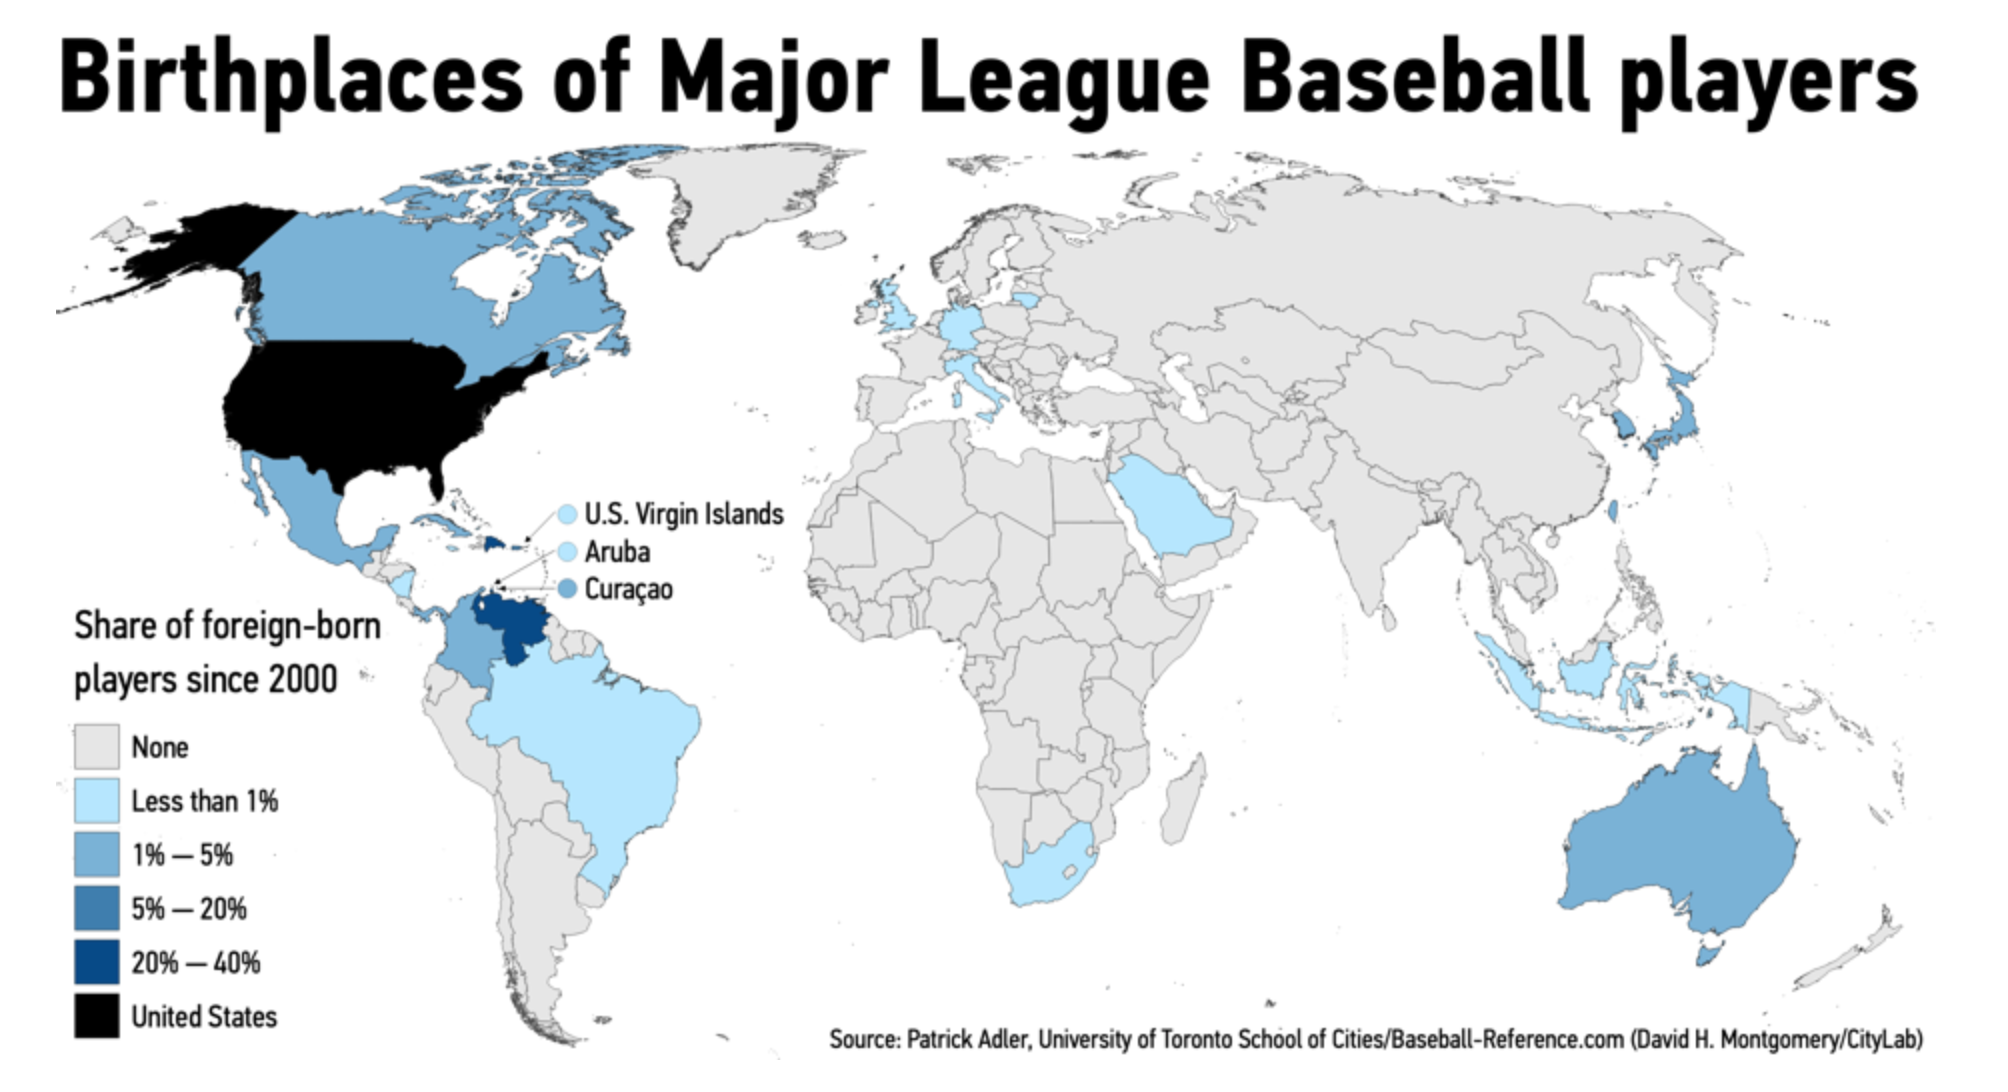
The World Series began Tuesday night. But, as many people reading this blog will know, baseball is not exactly a global sport. But is it really? CityLab looked at the origin of Major League Baseball players and it turns out that almost 30% of the players today are from outside the United States. They have a number of charts and graphics that explore the places of birth of ball players. But one of the things I learned is just how many players hail from the Dominican Republic—since 2000, 12% of all players.

There are quite a few players from countries around the Caribbean.

The choropleth here is an interesting choice. It’s a default choice, so I understand it. But when so many countries that are being highlighted are small islands in the Caribbean, a geographically accurate map might not be the ideal choice. Really, this map highlights from just how few countries MLB ball players originate.

Fortunately the other graphics work really well. We get bar charts about which cities provide MLB rosters. But the one I really enjoy is where they account for the overall size of cities and see which cities, for every 100,000 people, provide the most ballplayers.

One of the other things I want to pick on, however, is the inclusion of Puerto Rico. In the dataset, the designers included it as a foreign country. When, you know, it’s part of the United States.

Credit for the piece goes to David H. Montgomery.

Baby You Can Drive My Non-automobile Personal Mode of Transportation

Last week was the climate summit in New York, and the science continues to get worse. Any real substantive progress in fighting climate change will require sacrifices and changes to the way our societies function and are organised, including spatially. Because one area that needs to be addressed is the use of personal automobiles that consume oil and emit, among other things, carbon dioxide. But living without cars is not easy in a society largely designed where they are a necessity.

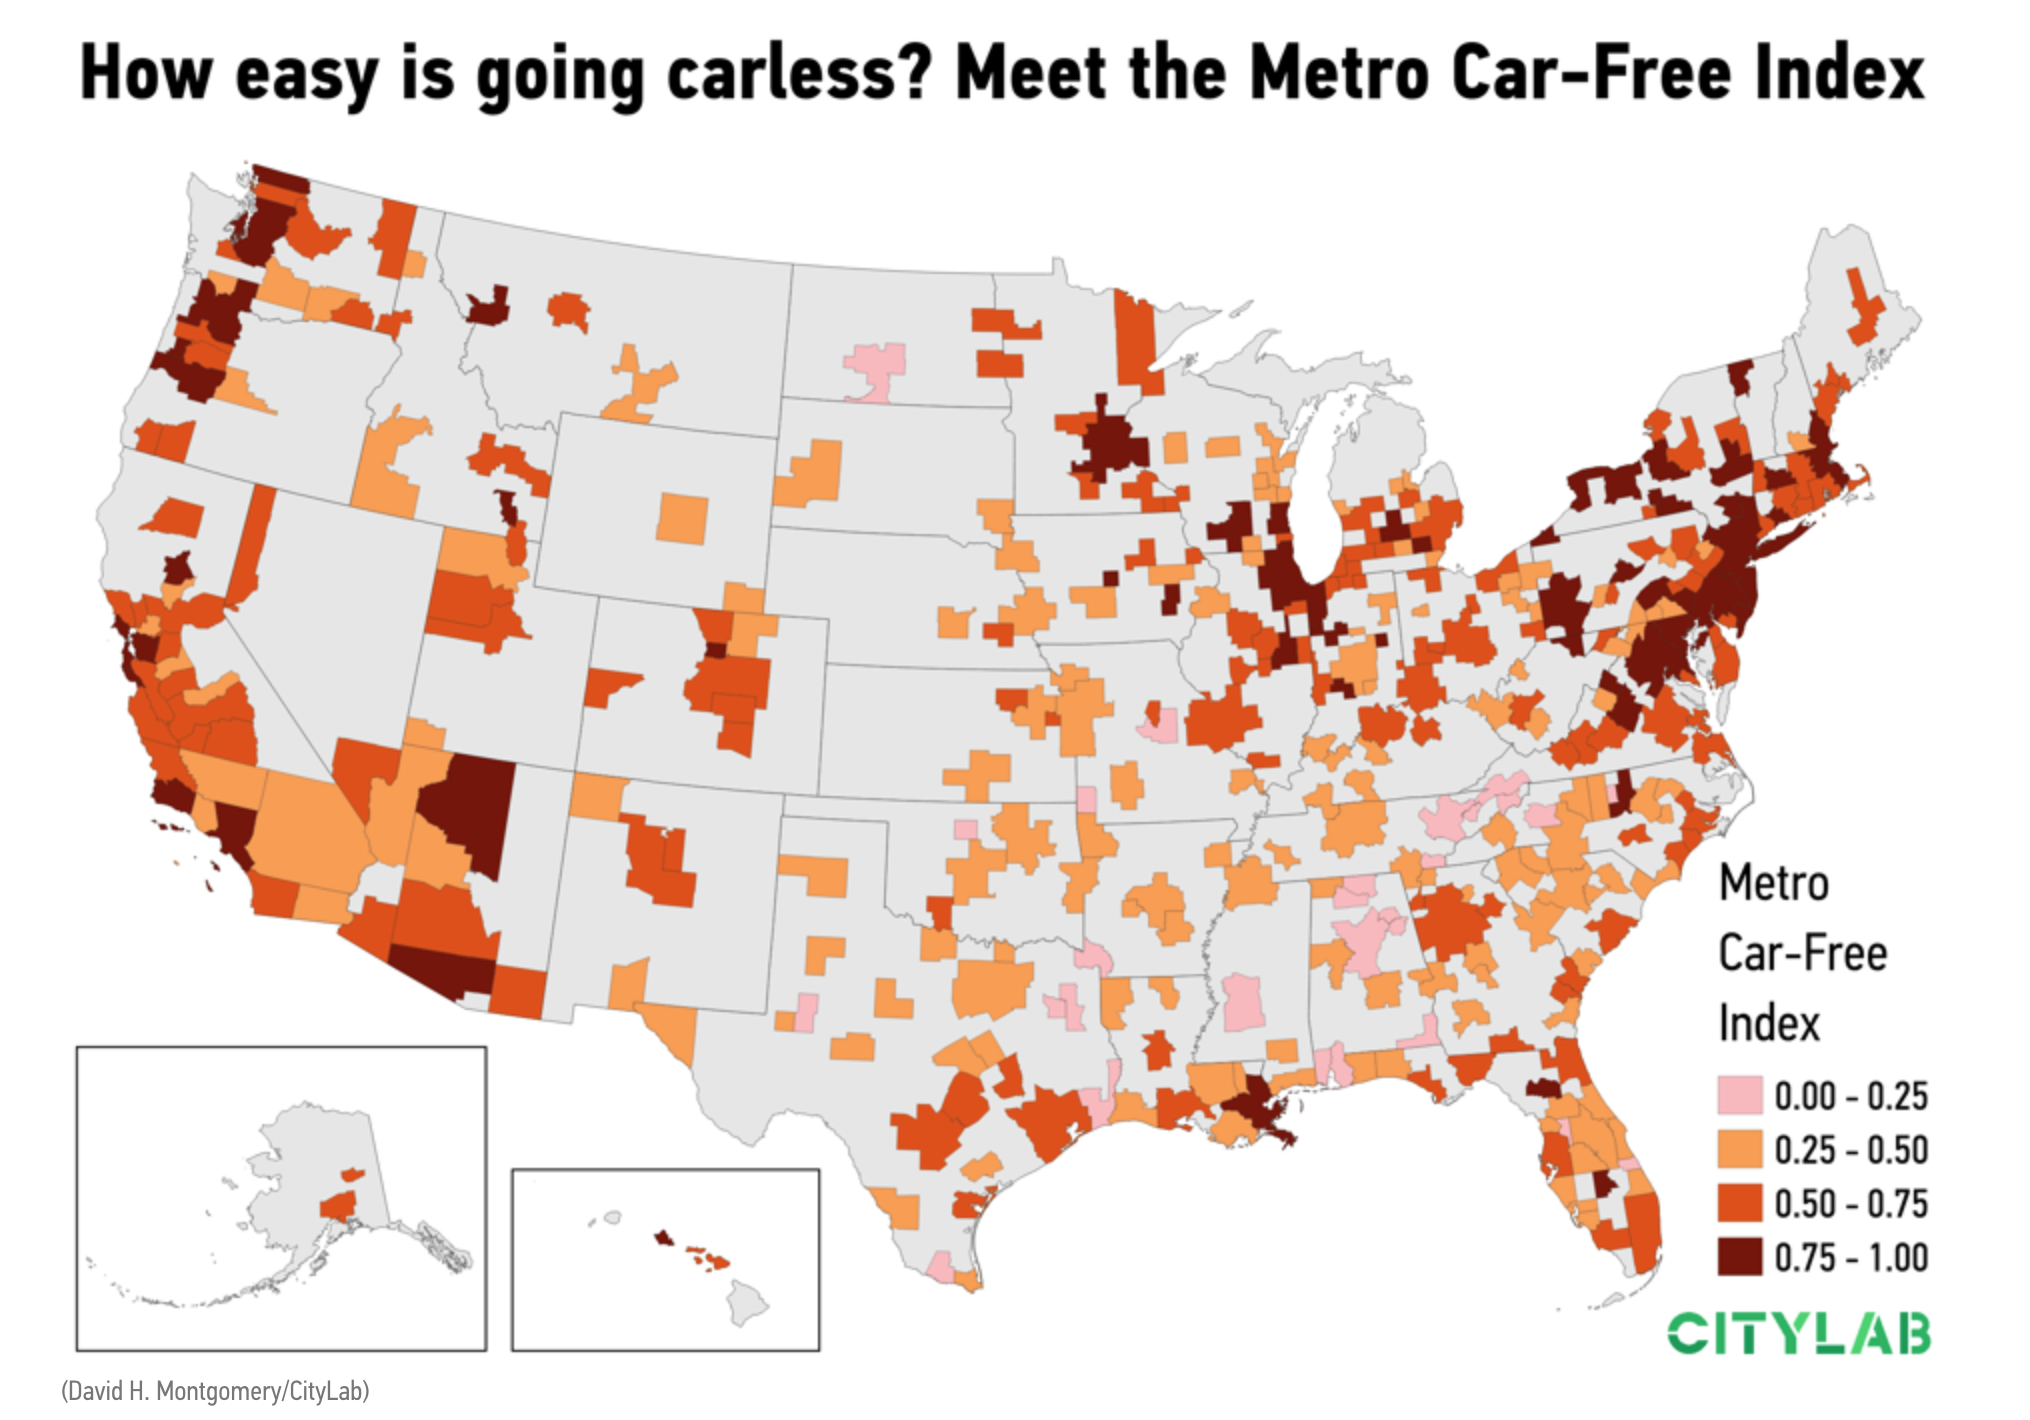
But over at CityLab, Richard Florida and Charlotta Mellander created an index trying to capture the ability to live without a car. The overall piece is worth a read, but as usual I want to focus on the graphic.

The Northeast is where it's at with its dense cities designed for a pre-automobile era
The Northeast is where it’s at with its dense cities designed for a pre-automobile era

It’s nothing crazy, but it really does shine as a good example of when to use a map. First, I enjoy seeing metro maps of the United States used as choropleths, which is why I’ve made them as part of job at the Philly Fed. CityLab’s map does a good job showing there is a geographic pattern to the location of cities best situated for those trying to live a car-free life. Perhaps not surprisingly, one of the big clusters is the Northeast Corridor, including Philadelphia, which ranks as the 17th best (out of 398) and the 7th best of large metro areas (defined as more than one million people), beating out Chicago, ranked 23rd and 8th, respectively.

Design wise I have two small issues. First, I might quibble with the colour scheme. I’m not sure there is enough differentiation between the pink and light orange. A very light orange could have perhaps been a better choice. Though I am sympathetic to the need to keep that lowest bin separate from the grey.

Secondly, with the legend, because the index is a construct, I might have included some secondary labelling to help the reader understand what the numbers mean. Perhaps an arrow and some text saying something like “Easier car-free living”. Once you have read the text, it makes sense. However, viewing the graphic in isolation might not be as clear as it could be with that labelling.

Credit for the piece goes to David Montgomery.