Failing to Whack the Mole

The story and data behind today’s graphic are worth telling. But, the execution leaves me feeling a bit empty. The piece kicks off a new series called Data Points from National Geographic. But, here in this piece we are looking for clear communication of data. So what do we get? Circles. Circles within circles within circles. My problem?

The overview view
The overview view

Well you can see from the first screenshot that we are missing the gap space, i.e. the space between the container circle and the data circle. The gap makes the container look larger than it really is. Granted, area is not a great way of comparing data points, but that aside, something like a tree map would probably be more accurate and still allow for the nesting that occurs, see below.
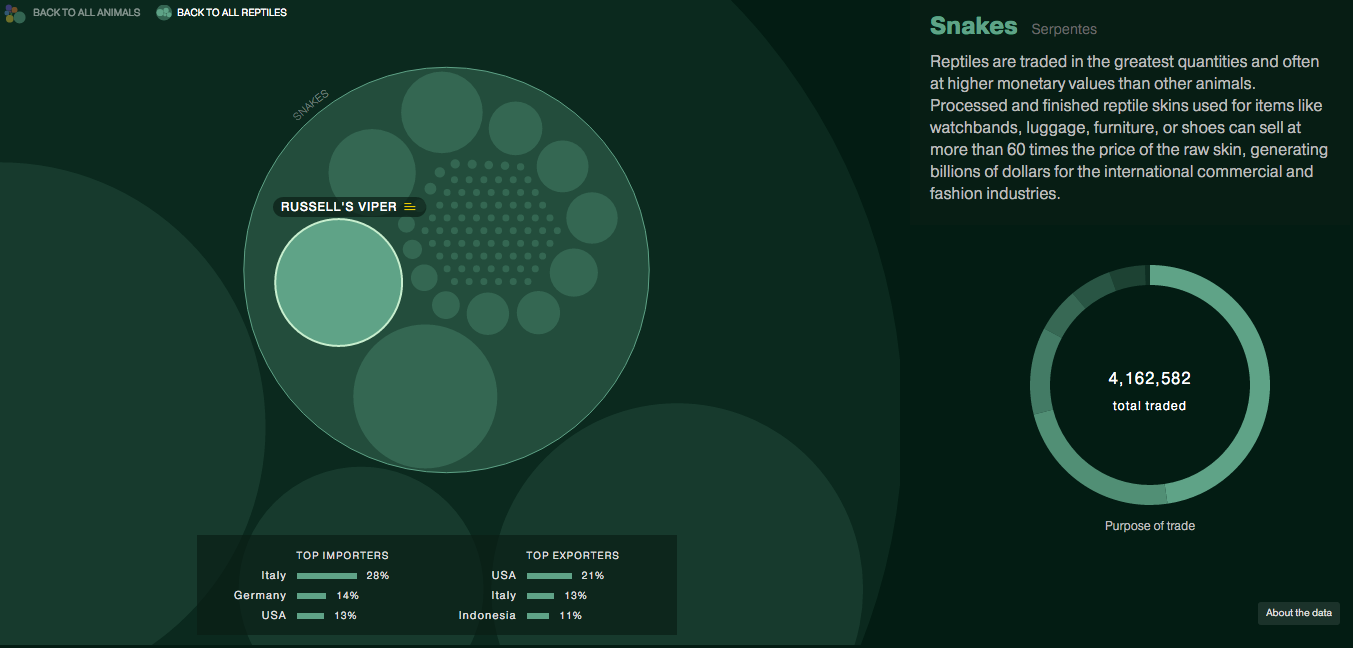
A nested view looking at snakes

The overall display includes nice ancillary data about top importers and exporters along with how the animals in question are used. Some animals even have trade notes that offer more context on how particular animals are used.

On the plus side, the piece’s title is great: Space Monkeys and Tiger Wine. I mean, how can you not read that? While they missed lots of the moles popping out of circles on this one, they did nail the title.

Credit for the piece goes to Katilin Yarnall and Fathom Information Design.

Habitable Exoplanets

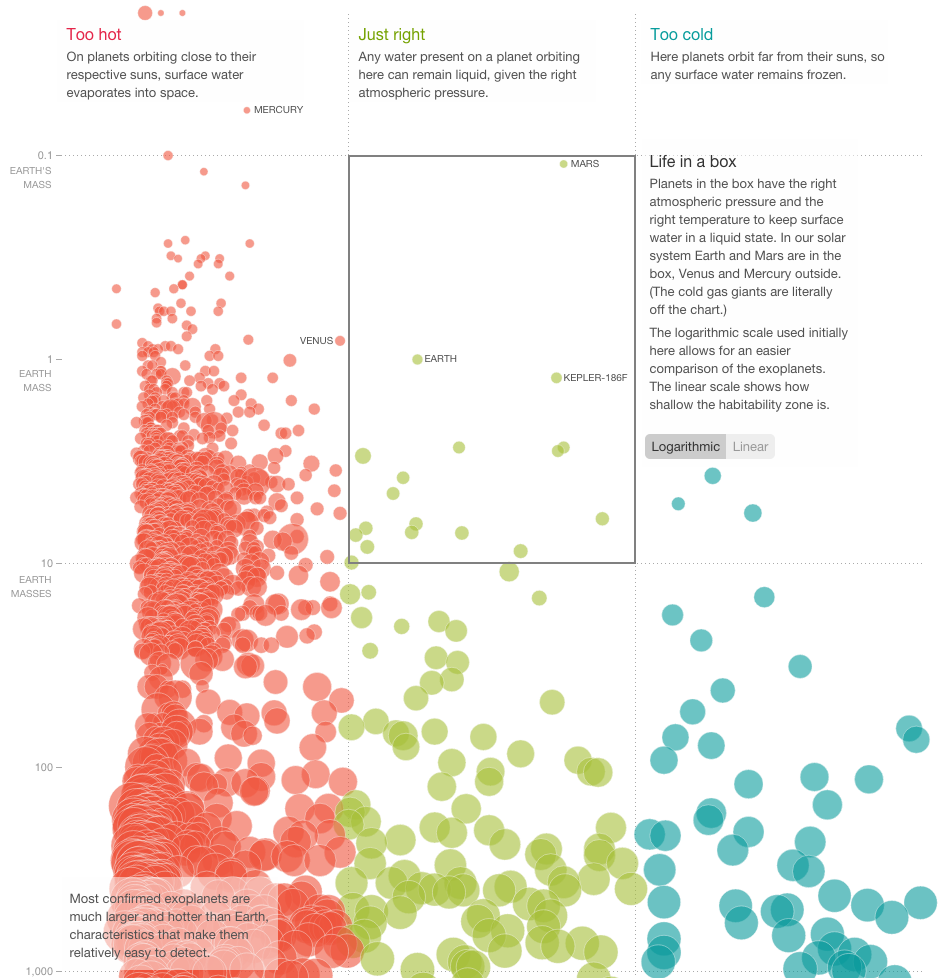
What is out there beyond our solar system? Are there little green men in flying saucers? Or Klingons waging war? The first step in figuring that out is knowing how many planets can be inhabited by life as we know it. This interactive graphic from National Geographic explores just that. And as it turns out, most of the exoplanets we have discovered are not habitable. But a few offer promise. If only we could warp on over and properly explore them.

Exoplanet habitability

Credit for the piece goes to John Tomanio and Xaquín G.V.

Calories and Consumption

National Geographic recently published a piece designed and built for them by Fathom Information Group. Content-wise, they looked at the historic consumption of food by several different countries. What do individual food groups contribute to the overall nutritional breakdown? For the piece this basically amounted to morphing donut charts. I get the reference, but do not care for the result.

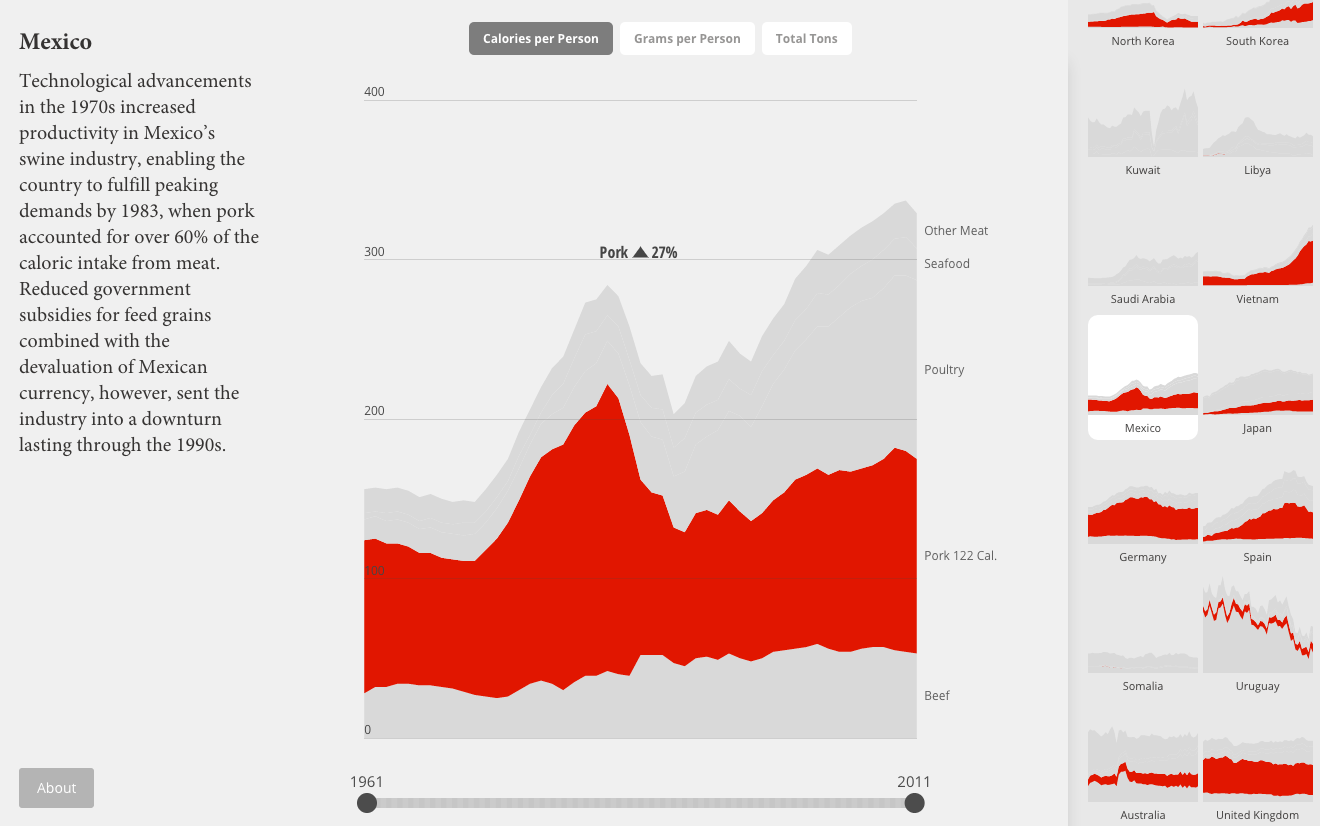
Instead more interesting is the second main view of the piece: meat consumption. Using stacked line charts, National Geographic explores changes in consumption patterns over the last 50 years. Some countries change a bit, others not so much. But as always the best examples are called out with an explanation as to why the changes. Mexico, for example, has the story about slashes in government subsidies and economic problems as to a decline in pork consumption.

Mexican pork consumption

Clearly I still have issues with the data visualisation. I would much rather see the selected view isolate the selection off the common baseline. But a nice touch is the small multiples from the country selection mechanism appearing to the right.

Credit for the piece goes to Fathom Information Design.

The Life Expectancy Gap Between Men and Women

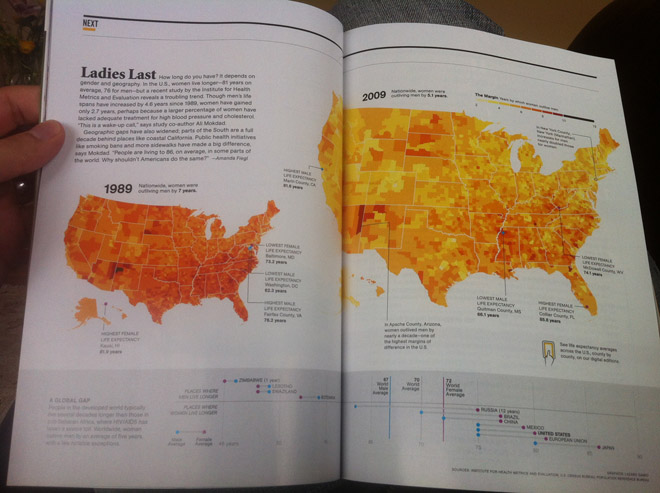
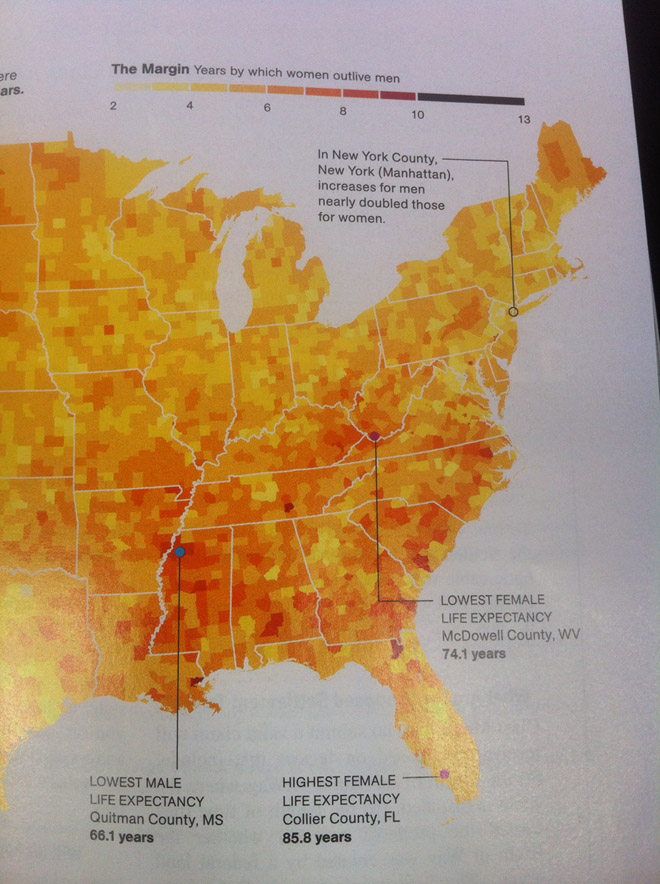
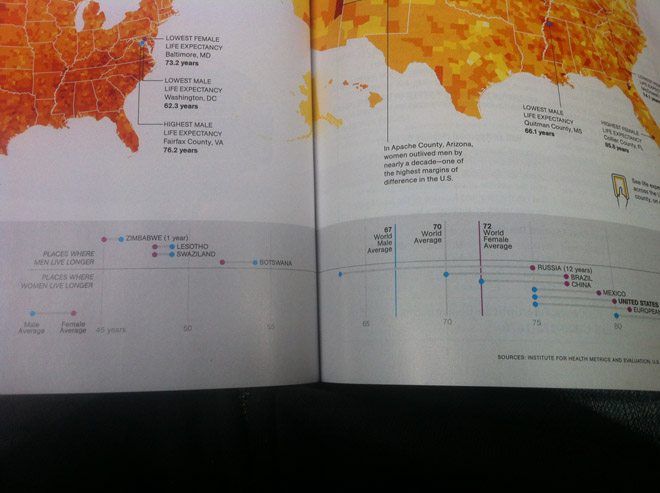
Today’s post comes via my coworker Jonathan and his subscription to National Geographic. The spread below looks at the gap in life expectancy between men and women in the United States. Outliers are highlighted by drawing lines to the counties in question while the same colour scale is used on a smaller map to look at historic data. And of course for those concerned about how the US places amongst its piers on the international stage, a small selection of countries are presented beneath in a dot plot that looks at the differences and averages.

The National Geographic spread
A detail of the choropleth map
A closer look at the dot plot

Credit for the piece goes to Lazaro Gamio.