Beating Ted Williams

Last week the Red Sox’s season came to an end after being swept by the Cleveland Indians and with the sweep so too ended David Ortiz’s career. He is one of the best Red Sox hitters of all time, but Ted Williams was the best. And so last week FiveThirtyEight ran a piece on how one manager from the Cleveland Indians—hence the relevance, right?—beat Ted Williams by “inventing” what we all know in baseball as the shift.

The below photo comes from the game and shows what we baseball fans now think of as routine was at the time almost brand new. (Although to be fair, the shift in this case left only one fielder on the left side of the field—the left fielder. Typically today both the shortstop and left fielder both remain.) Anyway, for those baseball fans, the article is worth a quick read.

Who's on first? Not Ted Williams after his at bat.
Who’s on first? Not Ted Williams after his at bat.

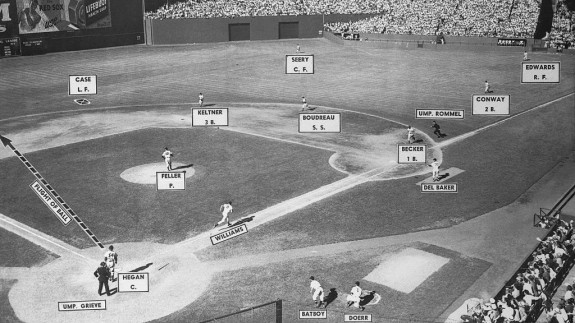
Credit for the piece goes to an unknown photographer ca. 1946.

Pill Popping Power

But not likely. As this FiveThirtyEight piece explains, steroids are not likely the cause of the increased power exhibited this year by Major League Baseball. The article goes into a bit of detail, but this set of small multiples does a nice job comparing several other factors that could be at play.

How different factors increased power or not

What I like about the piece is how each line chart is centred on the year where the factor came into play. And then to the right and left are ten years before and after. Maybe a little bit more could have been done to highlight the differing years—I admit that I missed that at first—but the concept itself is solid.

Credit for the piece goes to the FiveThirtyEight graphics department.

Miniature Ball Fields

Last week Jackie Bradley Jr., the starting centerfielder for the Boston Red Sox, saw his hit-streak end at 29 games. For those of you who do not follow baseball, that means he hit the ball and reached first base safely without causing an out for 29 games in a row. Quite a feat. Anyway, because it is a feat, the story gets covered and in this case, by the Boston Globe.

They wrote several articles on Bradley and the hit streak, but this one included a small, interactive graphic that mapped out his hits. Because a streak exists over time, the component includes a slider to show how the hits have progressed.

Bradley hit to all parts of the field

Worth keeping in mind that this was merely a sidebar graphic, not a large and fully immersive piece. The piece itself features only a few tables detailing baseball data comparisons, but it exists in a new design layout from the Globe featuring bigger, glossier photographs. Not all graphics need to be the biggest element on the page. From a pacing perspective, it sometimes helps to have a small graphic placed next to the important text to provide immediate context. Speaking of context…

The graphic in the context of the page

Overall, a very nice piece.

Credit for the piece goes to the Boston Globe graphics department.

Don’t Go, Big Papi

Today’s graphic is not terribly complicated, but it is near and dear to Boston Red Sox fans. This is David Ortiz’s final year as he announced his retirement at the year’s outset. And of so course FiveThirtyEight examined Big Papi’s chances of getting into the Hall of Fame.

Please don't go…
Please don’t go…

Credit for the piece goes to Rob Arthur.

Pedro Martinez Was A Great Pitcher

Last week FiveThirtyEight posted a nice article about the best pitchers in baseball. Turns out Pedro Martinez rates pretty highly among them. The late 90s and early 00s were great for Red Sox pitching.

Pedro was great
Pedro was great

Credit for the piece goes to Neil Paine and Jay Boice.

A Royal Nation

You may recall a year and a half ago a post I wrote up about a New York Times piece looking at the fandoms of baseball in the United States. Well fresh off their hometown Royals’ World Series victory, the folks at the Kansas City Star revisited the graphic—driven by Facebook likes—to see if there had been any change. Sure enough, Royals Nation—or whatever they call it—has made inroads into what was before St. Louis Cardinals territory.

Missouri is a little more blue these days

The only sad part about the article is that they talk of changes in adjacent states, e.g. Kansas, but have no maps for those.

Credit for the piece goes to Jay Pilgreen.

Rich Hill’s Curveball

Today marks the final start of the year for Rich Hill of the Boston Red Sox. It’s also only his fourth start of the year. He was signed as depth as attrition left an empty spot in the rotation. In his three starts, however, he has given up only three runs in 23 innings while striking out 30 and walking only two. How does he do it? Over at Baseball Prospectus they took a look at Hill’s curveball and the deception he generates from his arm slot and the location of his fastball. They show this by a comparison graphic. I’ve added the names of the two players, but otherwise the graphic is unaltered.

Hill is on the left
Hill is on the left

If I am lucky, I can catch this last Hill start at the pub tonight.

Credit for the piece goes to Baseball Savant.

David Ortiz Still Has 500 Home Runs

So what I was saying yesterday about there not being a new Boston Globe piece about David Ortiz’s 500 home runs. I was wrong. I missed it. But, here you go, in its semi-splendour (not digging the illustration of the baseballs /quibble). There are some merits to the piece in terms of the filtering—you can by season, opponent, or the teams for which Ortiz played (only 58 for the Twins)—but let us not lose fact of the fact that this is all about No. 500.

I have seen a few in my years, including that one.

Credit for the piece goes to Patrick Garvin.

David Ortiz Has 500 Home Runs

This past weekend, David Ortiz hit his 500th home run, a significant milestone in Major League Baseball attained only by a handful of players. This piece from the Boston Herald commemorates the feat—with too many photographs and embellishment for my liking—by putting his season totals on a timeline while putting Ortiz at the bottom of the 500+ home run club.

The timeline of the home runs

The following piece dates from April 2015 and was about the impact of defensive shifting on Ortiz, but it has a nice graphic on his home run output. It’s just outdated by most of this season. But, from a data viusalisation standpoint, I find it a far more useful and telling graphic.

A look at Ortiz's home runs
A look at Ortiz’s home runs

Credit for the Boston Herald piece goes to Jon Couture.

Credit for the Boston Globe piece goes to the Boston Globe graphics department.

Red Sox Hire Dave Dombrowski

The Boston Red Sox made big baseball news last night by announcing the hiring of former Tigers GM Dave Dombrowski to head Boston’s baseball operations. The second big piece of baseball news, Boston’s GM, Ben Cherington, has resigned as he does not want to work under Dombrowski.

As you might figure, I enjoy data’s role in baseball. That Dombrowski is not the biggest analytics-embracing GM worries me a bit. But after re-reading FiveThirtyEight’s piece on the value he brings—naturally through some data and analysis—I think I will at least give him a season or two before calling for his head.

Where Dombrowski fits

Credit for the piece to Ron Arthur.