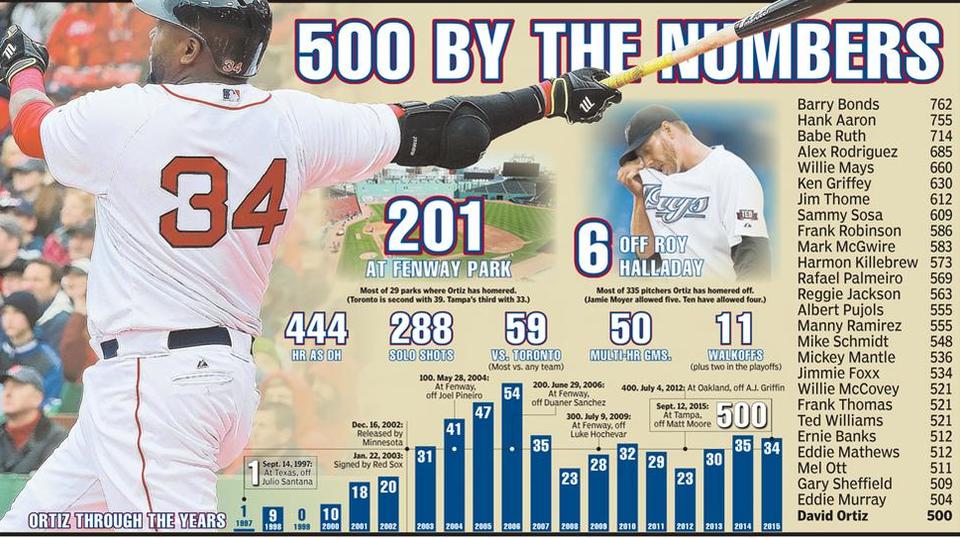
This past weekend, David Ortiz hit his 500th home run, a significant milestone in Major League Baseball attained only by a handful of players. This piece from the Boston Herald commemorates the feat—with too many photographs and embellishment for my liking—by putting his season totals on a timeline while putting Ortiz at the bottom of the 500+ home run club.
The following piece dates from April 2015 and was about the impact of defensive shifting on Ortiz, but it has a nice graphic on his home run output. It’s just outdated by most of this season. But, from a data viusalisation standpoint, I find it a far more useful and telling graphic.

Credit for the Boston Herald piece goes to Jon Couture.
Credit for the Boston Globe piece goes to the Boston Globe graphics department.
Leave a Reply
You must be logged in to post a comment.