Counterbalancing Presidential Support

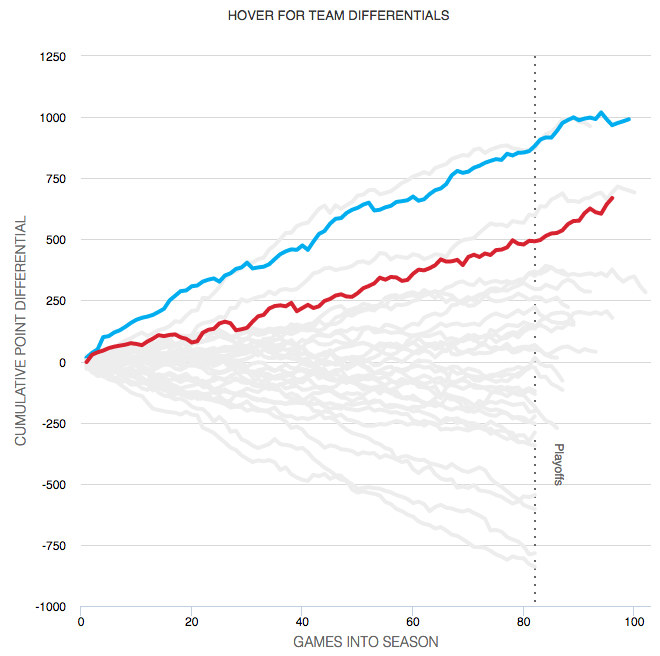
The night after the California primary—or as an East Coaster should say, the night of the New Jersey primary—we take a look at how US presidents often experience a counterbalancing political force in state, gubernatorial, House, and Senate races. The content comes from the Washington Post and it makes use of nicely annotated graphics, including the screenshot below.

How Senate control changed

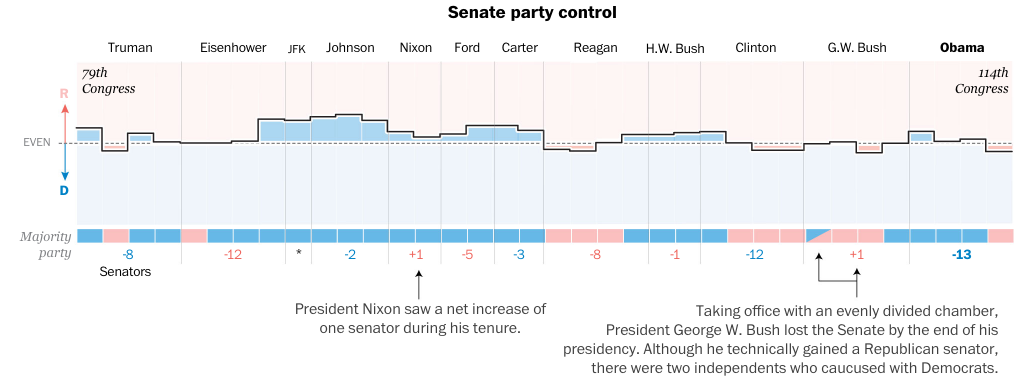
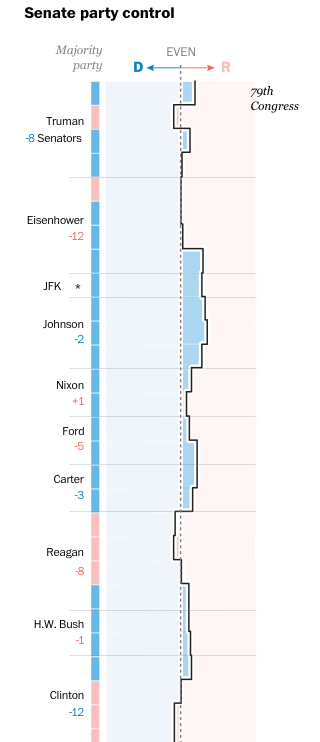
What I enjoy about the piece, however, is how it responds to a narrower browser, like one might see on a mobile phone. The screenshot to the right shows how the data visualisation changes. You can see how some of the annotations disappear, like the note about Nixon’s support growing.

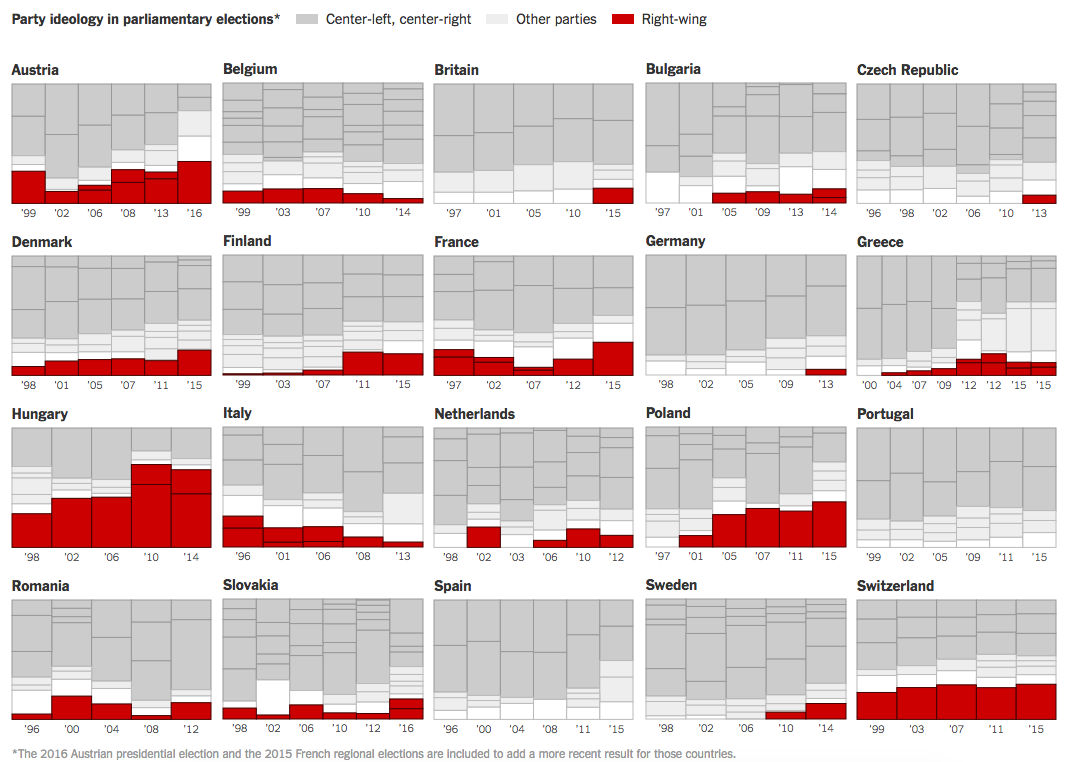
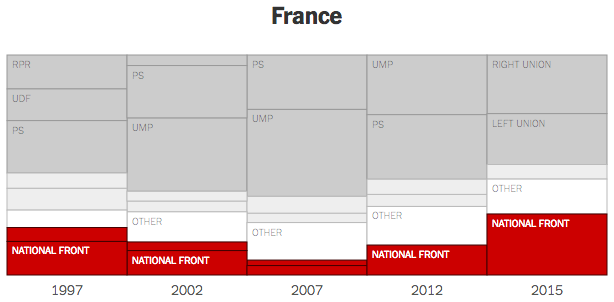
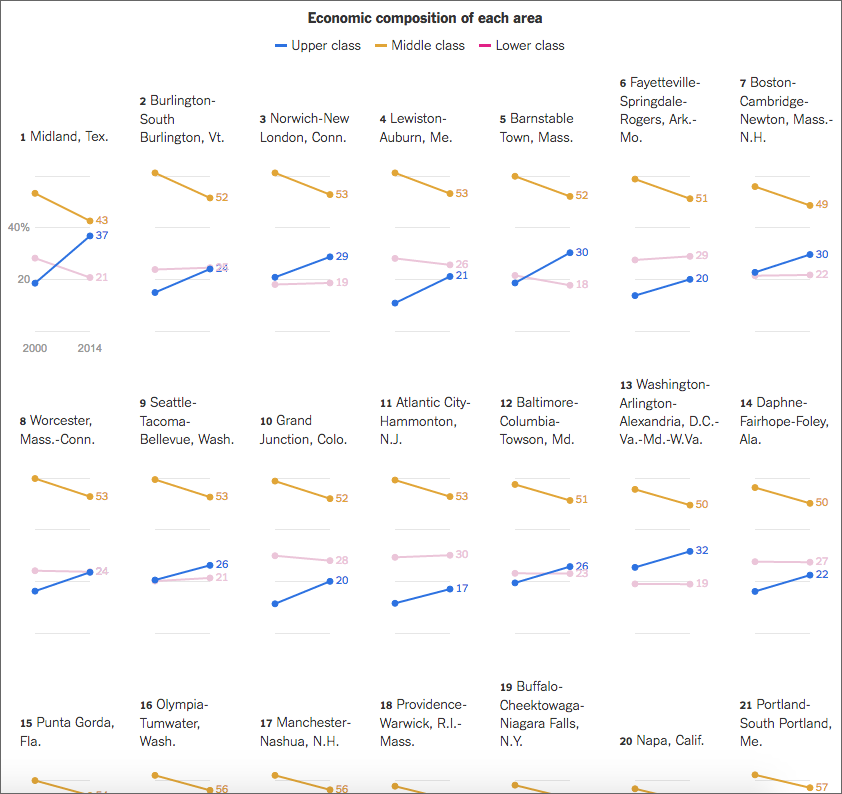
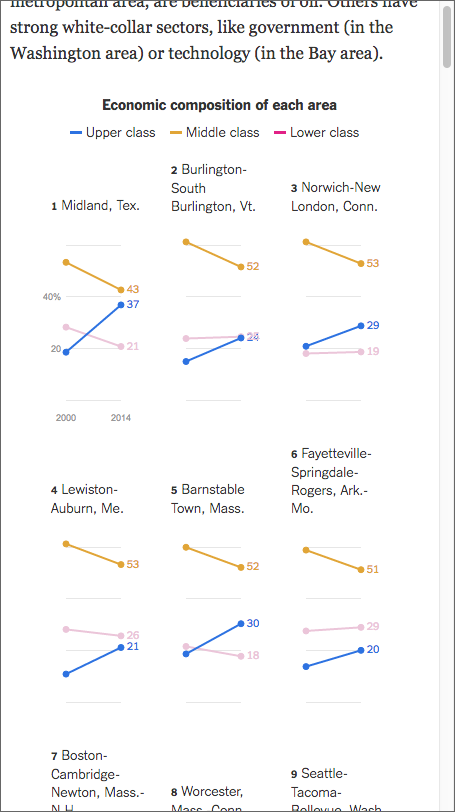
The same adaptation to the display occurs for the other graphics throughout the piece, with axes and orientations changing to take advantage of the more vertical orientation.

I also think it is worth pointing out that the more illustrative ornamentation of the piece, i.e. the presidential illustrations, drop off completely. I could have lived without them as they do not contribute directly to the data story. I also think the white lines on the charts above could be removed to make the narrower margins more visible on the charts.

Credit for the piece goes to Stephanie Stamm.

Fact Checking Trump’s Small Multiples

Today marks the end of primary season for the US presidential election. By all accounts, at night’s end Hillary Clinton will be the Democratic nominee, but Bernie Sanders, while unlikely to win, could make California interesting tonight. And then there is Donald Trump. He is the Republican Party’s presumptive nominee and man, can that guy tweet.

Thursday he retweeted a set of small multiple charts arguing that President Obama’s legacy is an absolute disaster.

Trump's retweeted charts
Trump’s retweeted charts

Friday the Washington Post went through all nine points and fact-checked the charts, this being the refutation of the Food Stamps chart.

Food stamps are actually going back down

The whole thing is worth a quick read.

Credit for the piece goes to Philip Bump.

Basketball Finals

So the basketball finals begin tonight with the Cleveland Cavaliers taking on the Golden State Warriors. This is also the part of the post where I fully admit I know almost nothing about basketball. I did, however, catch this so-labelled infographic from ESPN contrasting the two teams.

Point differential
Point differential

What I appreciate at this piece is that ESPN labelled it an infographics. And while the data might be at times light, this is more a data-rich experience than most infographics these days. Additionally the design degrades fairly nicely as your browser reduces in size.

The chart formats themselves are not too over-the-top (that seemed like a decent basketball pun when I typed it out) with bars, line, and scatter plots. Player illustrations accent the piece, but do not convey information as data-encoded variables. I quibble with the rounded bar charts for the section on each team’s construction, but the section itself is fascinating.

I might not know most of the metrics’ definitions, but I did not mind reading through the piece.

Go Red Sox.

Credit for the piece goes to Luke Knox and Cun Shi.

World Income

Over the weekend I found myself curious about the notion of a growing global middle class. So I dug up some data from the Pew Research Center and did some analysis. The linked piece here details that analysis.

The growth in middle income populations

I go into more detail than just a map. Hopefully you enjoy the piece and find the analysis informative if not useful.

Credit goes to myself on this one.

Europe’s Far-right Parties

On Sunday, Austria narrowly elected a former Green Party leader as president over the leader of the Freedom Party, a far-right party that surged in part because of the impact of Europe’s migrant and refugee crisis. The New York Times took a look at just how often and by how much far-right parties have succeeded in European countries in recent years.

There's more red than there used to be
There’s more red than there used to be

What I really like about this piece is that while they could have stopped at the above graphic, they opted to not. Some of the graphics above then introduce a section specific to the politics of the particular country, e.g. France and the rise of the National Front and Marine Le Pen.

France in detail
France in detail

Credit for the piece goes to Gregor Aisch, Adam Pearce, and Bryant Rousseau.

The Decline of the Middle Class in America

Last week the New York Times published a great piece on the shrinking middle class and they used a series of small multiples to tell the story. They broke the story up into several sections, based on the trends in the data, e.g. in the screenshot below the designer sorted by areas where the middle class fell but upper class rose.

A wide view of the graphic

From the responsive design side of things, the piece works well on narrower screens too, because the design choice of small multiple tiles permits the piece to stack and rearrange tiles.

A narrow view of the graphic

Credit for the piece goes to Quoctrung Bui.

2016 Holyrood Elections

Last week Scotland voted for its parliament, Holyrood. The Scottish National Party did well enough, the Conservatives picked up quite a few seats, and Labour lost quite a few. The Guardian put together this piece looking at the results and the stories contained therein. But I want to focus on the graphics, the big piece of which was a map of Scotland with each constituency represented by a small Sankey diagram.

Scotland's results
Scotland’s results

You see that generally, Scotland is a sea of yellow, surging blue, and diminishing red. But what about the numbers for each constituency? The interactive nature of the chart lets you see the 2016 results mousing over the constituency.

Aberdeenshire West results

Normally I would say that a piece like this is missing an easy way for someone to find their own constituency, however, this is not a results page, but an article on the results, so something like a search bar is not necessary.

What I really enjoy, however, is that when the story breaks down the results by regions, the map becomes an abstracted series of squares used to highlight the constituencies in focus. It is a really nice reuse of the concept and the overall graphic.

Talking about Glasgow

Credit for the piece goes to the Guardian’s graphics department.

The Franco–Belgian Terror Network

The terror attacks in Paris and Brussels were bad. But even worse? The two attacks exposed a network of IS terrorists living within the Schengen Area. Are there cells or even other networks? One way of uncovering them would be to examine the links between the known terrorists and see if additional nodes appear at the network’s fringes. Given Friday’s piece from the New York times examining the links between the known terrorists, investigators in Europe are likely doing just that.

Looking at the terrorists' network
Looking at the terrorists’ network

Credit for the piece goes to Larry Buchanan, Haeyoun Park, Sarah Almukhtar, Josh Keller, Sergio Peçanha, and Tim Wallace.

The Middle Class is Getting Poorer

At least relatively speaking. Today’s post is a Bloomberg article comprised primarily of charts with pithy titles summarising the data story. If listicle is a word for articles consisting of the Top-10 things about [whatever], do we start embracing charticle as the word for chart-driven stories? Even if we do, we should take note that this piece was not the work of one person, but four.

The Middle Class' share of wealth
The Middle Class’ share of wealth

The story captures my attention to and dovetails nicely into yesterday’s piece about a possible electoral path for Donald Trump to take the White House later this autumn.

Bonus points for the responsive nature of the post.

Credit for the piece goes to Andre Tartar, Mira Rojanasakul, Jeremy Diamond, and John Fraher.

GOP Media Time

Well, Super Tuesday is over. And if you spent last night under a rock, Donald Trump and Hillary Clinton cleaned almost enough house to brush away their competition. Almost. The political analysis begins…now. But we will leave that for another day. I liked this one particular chart from FiveThirtyEight’s coverage.

Media coverage
Media coverage

We have a nice set of small multiples—please kill the cute illustrations of the candidates’ heads—comparing the number of items in Google News and Google Searches. The graphic goes a long way in showing just how much coverage Trump has received over the past few months against very little for others.

Credit for the piece goes to FiveThirtyEight’s graphics department.