A Week of Unrest Across the Middle East

Over the last week a video clip on YouTube that mocked the Muslim prophet Mohammad sparked unrest across the Muslim world, from Morocco to Bangladesh and from Turkey to Kenya. While most of the protests were peaceful, a few were not. In Libya, the US consulate in Benghazi was attacked—in circumstances still not entirely clear—and four Americans were killed, including the US ambassador, Christopher Stevens. In Khartoum, Sudan, the embassies of the US, the United Kingdom, and Germany were all attacked. While in Afghanistan, the Taliban successfully attacked the UK’s heavily fortified base of Camp Bastion, nearest to Kandahar, killing two US Marines and destroying six Harrier jets.

Combing through several news sites, including the BBC, AP, and Reuters among others, I mapped where protests occurred and sought to show how much of that country’s population identifies as Muslim. Most nations were, not surprisingly, heavily Muslim. But several countries with rather small Muslim populations such as Kenya, Sri Lanka, and India also hosted protests, some violent. Not included, because of the difficulty in changing the map, is Australia. Sydney experienced protests nearing rioting as protestors marched.

Click the map for the full-sized view.
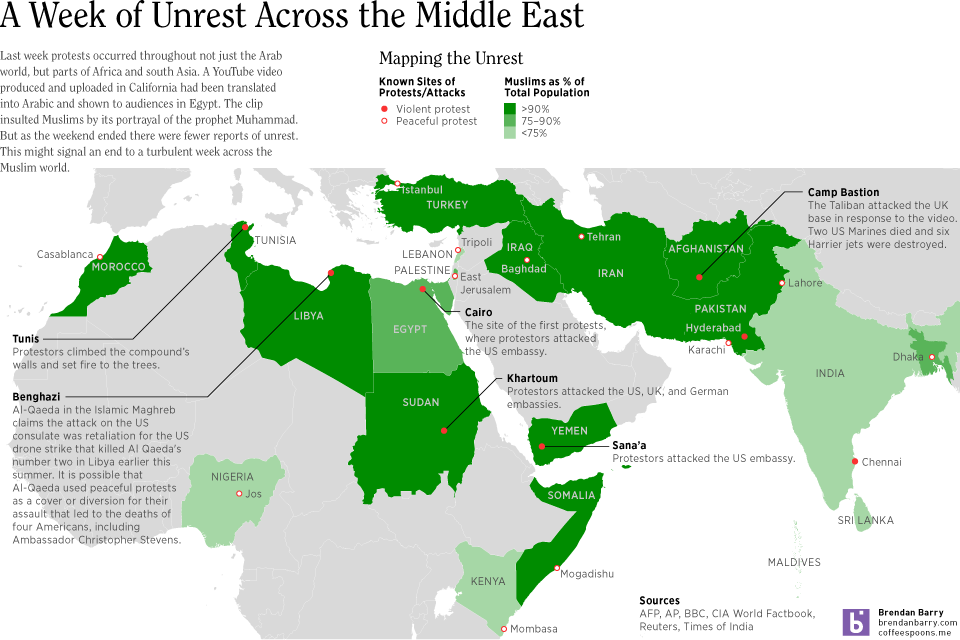
Map of Muslim Unrest; click for the full-size view

Ethnic Comparison of Romney and Obama Voters

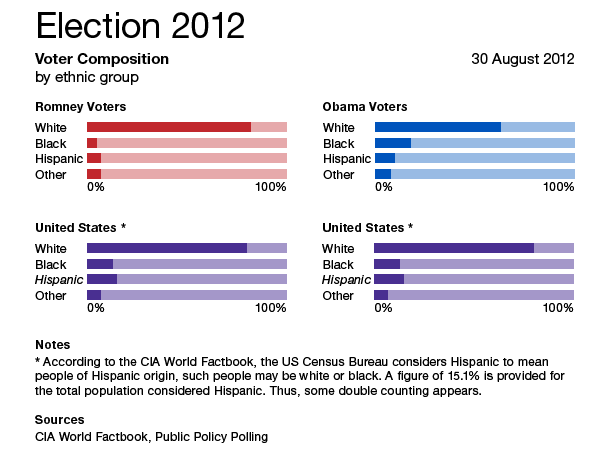
A rare mid-day posting. Some interesting figures published on Twitter by Public Policy Polling look at the ethnic breakdown of the—I presume self-identified—voters for both Governor Romney and President Obama. Perhaps we all already knew this, but one voter group is more diverse than the other.

To see whether these align with the national population, I included some quick stats published by the CIA World Factbook on the ethnic breakdown of the United States. The tricky part, however, is that the US Census Bureau does not regard Hispanic as a discrete ethnic group. Instead, it is considered an origin. Thus, you can be a black Hispanic of Caribbean descent or a white Hispanic from Spain. So, in full transparency, my United States figures for Hispanic are a bit suspect.

Red Sox–Dodgers Trade

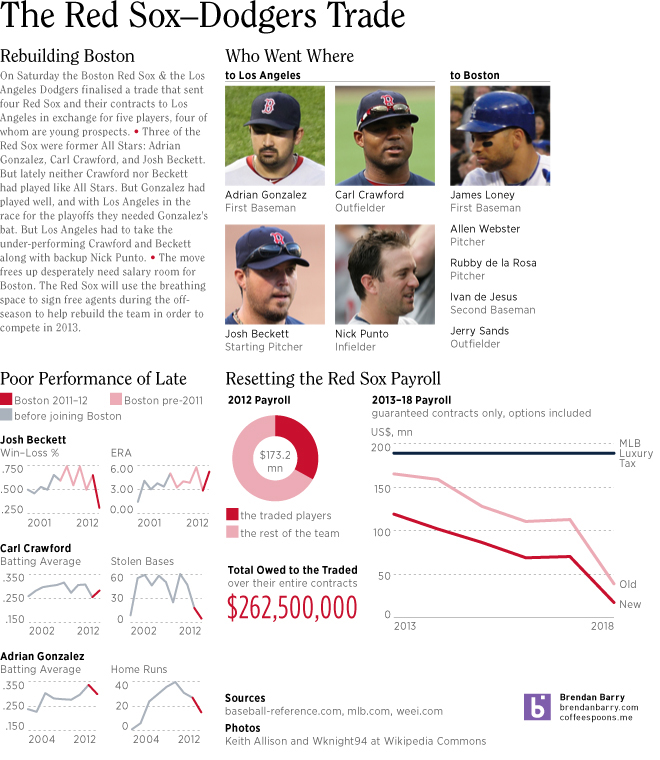
There was a lot of news this past weekend. So we’ll start with the important stuff first. An infographic about the big baseball trade between my Boston Red Sox and the Los Angeles Dodgers. The advantage of a story breaking over the weekend is time to get something together for Monday.

The Red Sox–Dodgers Trade

Olympic Forecast Comparison

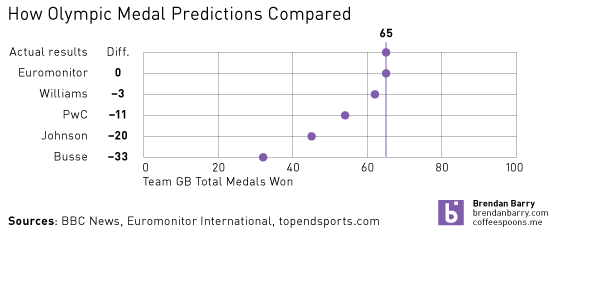
During my research for the Olympic medal projections, I came across a few sites that presented a few other projections because, quite frankly, 65 seemed rather high given that the UK won only 47 the year before. The chart below just compares how the other forecasts turned out in the end.

Forecasts Compared
Forecasts Compared

Emily Williams from the Tusk School of Business, Price Waterhouse Coopers, Dan Johnson of Colorado College, and Meghan Busse from Northwestern University.

How the UK Got to the 65 Medals We Correctly Predicted

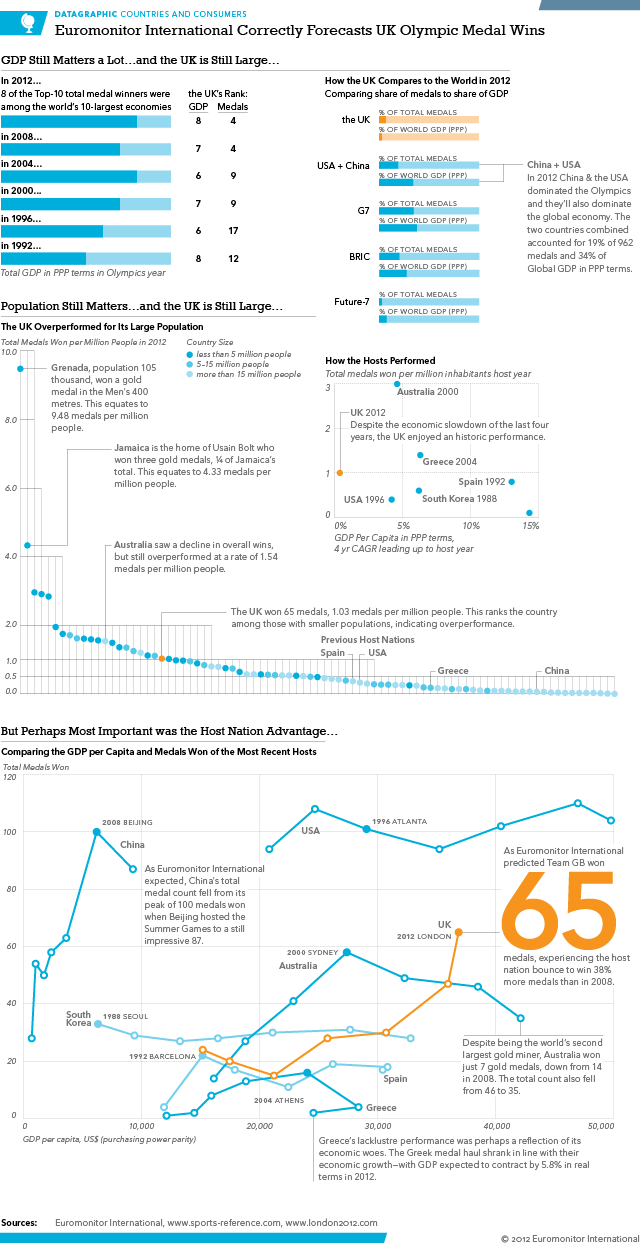
So the Olympics are over. But before they began, I and some co-workers made a prediction about how the United Kingdom and their Team GB would perform. We predicted 65 medals. How did the United Kingdom fare? They won 65 medals. This is a follow-up infographic about what made the United Kingdom a winner at the 2012 Summer Games. It’s a bit larger than the first version, but this one also includes new data and revisits some of the earlier themes.

Another important (and correct) prediction was that China would slip and not reach 100 medals. This should happen after experiencing the host nation bump. While we did not create a number for China, they scored only 87 medals. Another correct prediction.

We Nailed the Prediction of 65 Team GB Medals

All in all a very successful series. (Created for my employer Euromonitor International, as the usual disclaimer goes.)

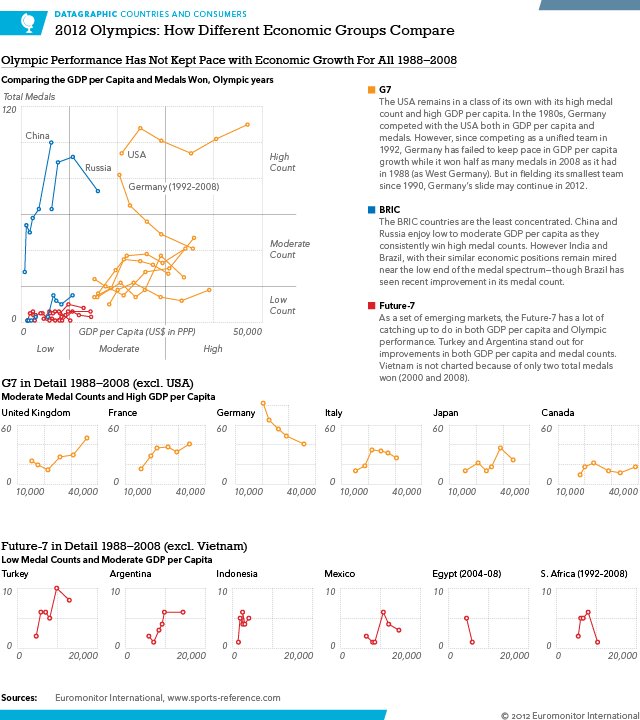
Olympic Performance vs Economic Performance

The Olympics are now fully underway and we can begin to see some patterns about who is doing well and who is, well, not. This infographic has a lot more to say about who had been doing well up through 2008. That is important because that was the last year before the fiscal/financial crisis brought about the first global recession since World War II. Stay tuned for the post-Olympic piece where I look at medal performance in 2012 compared to GDP per capita. Some interesting stories appear to be happening.

One can clearly see that GDP per capita is (generally speaking) a good variable for estimating Olympic success. So the countries in this graphic are three major economic regions. The G7, BRIC, and the Future-7. The G7 are the world’s richest/most productive countries. BRIC are supposed to become the next G7. And the Future-7 is a Euromonitor International grouping that looks at a group of countries that are expected to become the next BRIC-like group of countries.

Economic Groups Compared

It is probably worth noting that despite this being an infographic for work, where I generally am not allowed to write analysis, the written analysis is mostly mine with some key ideas brought to my attention by co-workers.

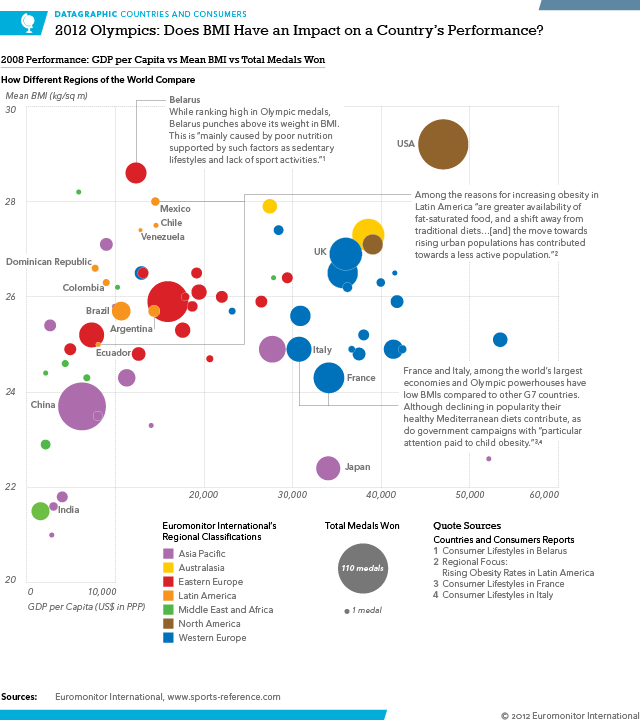
Does a High Average BMI Impact a Country’s Chance at the Olympics?

It turns out not so much. A comparison of the 2008 data for average BMI (coarsely how fat a person is) for countries across their economic productivity (GDP per capita) and total medals won shows that a country’s health culture does not greatly impact said country’s Olympic chances.

Does BMI Impact Olympic Performance?

This is another from my work series on infographics for the Olympics.

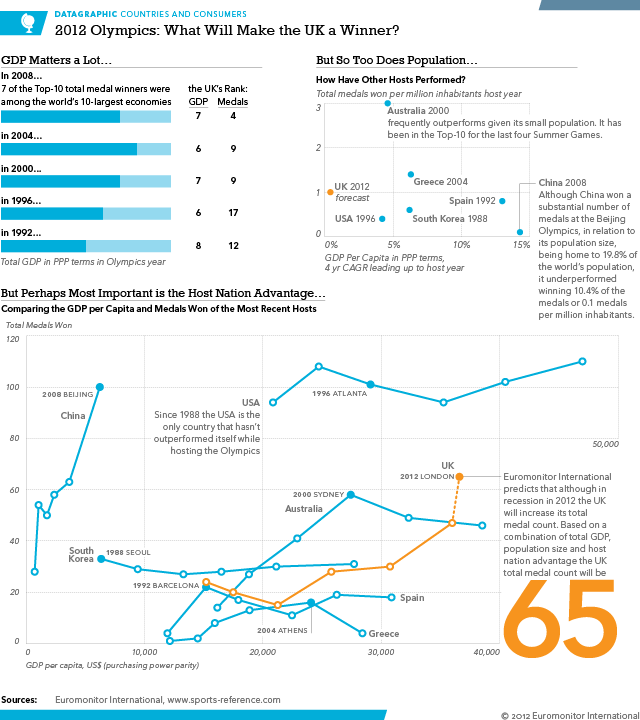
2012 Olympics: What Makes a Winner (and Will the UK Be One)?

The Olympics are coming, the Olympics are coming. (As if you didn’t know.) In a rare moment of seeing my work outside of my company’s paywall, I can post a few infographics I have created for the 2012 Summer Games in London. The series looks at a few different non-Olympic variables like GDP per capita and mean BMI and sees whether they impact total medal counts in the Olympics.

This first datagraphic (to use my company’s internal language) looks at what makes a winner and will the UK be one this summer. The main chart in the piece compares GDP per capita performance to total medal count in each Olympic year from 1988 to 2008. And yes, we are predicting the UK to win a total of 65 medals this summer.

What Makes an Olympics Winner

In the interest of full disclosure, I work as the senior graphic designer for Euromonitor International. This series was not intended to be used as part of marketing/promotional piece (I probably need to include the link to download that document here), but instead I designed them all as client-only content. But since others decided to use my work as marketing material, I am fortunately allowed to share it with all of you via my blog. So yeah, that’s pretty cool. Enjoy.

Rusyns of Slovakia

The Slovakian government has published the results from its 2011 census. The census looked at many things, including nationality and language. This should allow the government in Bratislava to better fund and support the ethnic minorities in Slovakia.

Of course, some of my ancestors were one of the small ethnic minorities in Slovakia. Ergo, I have a personal interest in the data. The result is a quick infographic about the Carpatho-Rusyns of Slovakia. Click on the cropping below to learn more, meaning, see a bigger and fuller version.

Cropping of the Rusyns of Slovakia

Credit for the work goes to me. For the data, the statistics office of Slovakia.

Venn Diagrams. Let’s Go Back to Grade School.

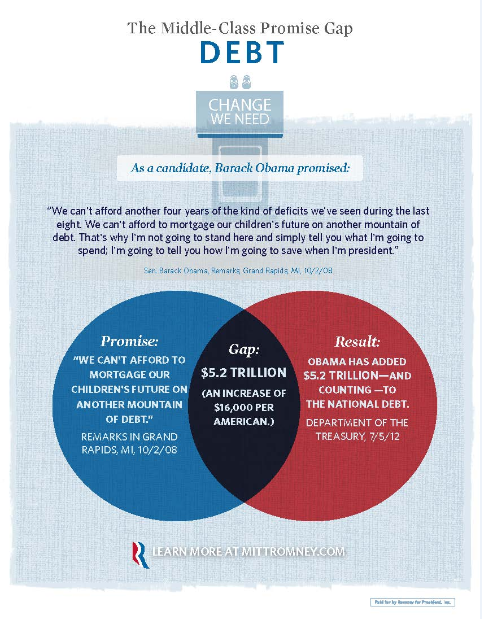
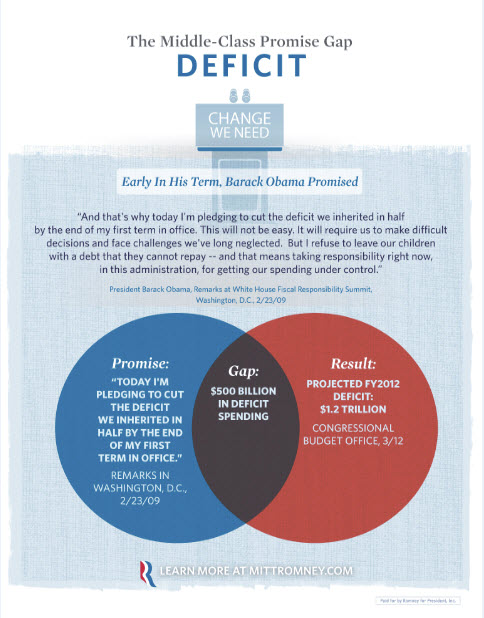
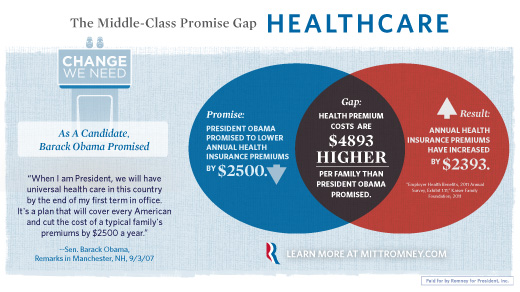
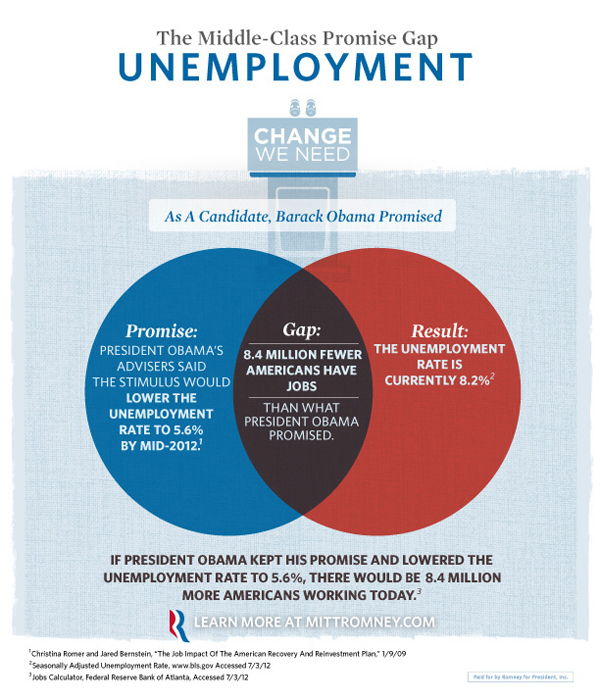
Last week Mitt Romney’s campaign released a series of infographic adverts. They were Venn Diagrams with messages attacking President Obama by highlighting what the Romney campaign called gaps between what the president has said he would do and what he has in fact done.

Debt Gap
Debt Gap
Deficit Gap
Deficit Gap
Healthcare Gap
Healthcare Gap
Unemployment Gap
Unemployment Gap

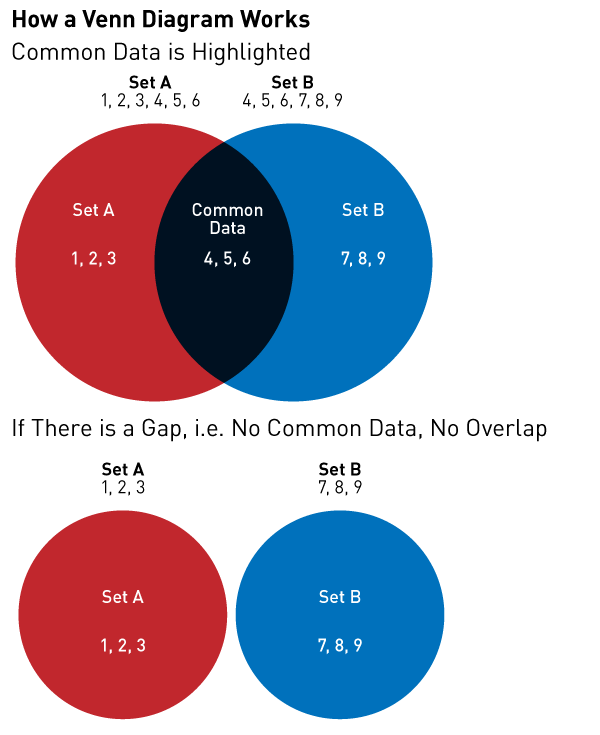
The problem with these is that they are all wrong. Do not misunderstand me, the Romney campaign certainly has valid points in these statements. And to use an infographic to communicate their points is a valid approach. But whoever designed these adverts clearly did not know how a Venn Diagram works.

Here is a brief refresher course for those interested.

How Venn Diagrams Work

Unfortunately, the Romney campaign’s message is being lost in a failed medium. It’s like watching a clown give a doctoral thesis in rocket science. He sure might be making a good point. But it’s a clown. People laugh at clowns. People won’t take the clown seriously. The Romney campaign is making good points, but that message is being lost because the campaign cannot master one of the simplest types of charts.

Credit for the originals go to the Romney campaign. The bit on How Venn Diagrams Work is mine.