Trump Knocks out Cruz

Donald Trump will be the Republican Party candidate for President of the United States.

Last summer I never imagined I would type those words in all seriousness, but after Trump won a majority of the votes in Indiana and likely swept all the delegates there, Ted Cruz suspended his campaign.

Two graphics strike my mind to best capture the story. The first is from last summer when FiveThirtyEight added Donald Trump to an existing graphic that loosely mapped out which candidates belonged to which factions of the Republican Party.

Trump was the exception in so many ways…

You can clearly see Donald Trump falls as an outlier at the extreme end of the Tea Party circle. This would be the argument that Trump is not a true conservative. But how did that argument play out over the following months?

Well this New York Times results map breaks down results to the county level. And you can see a lot of Trump red.
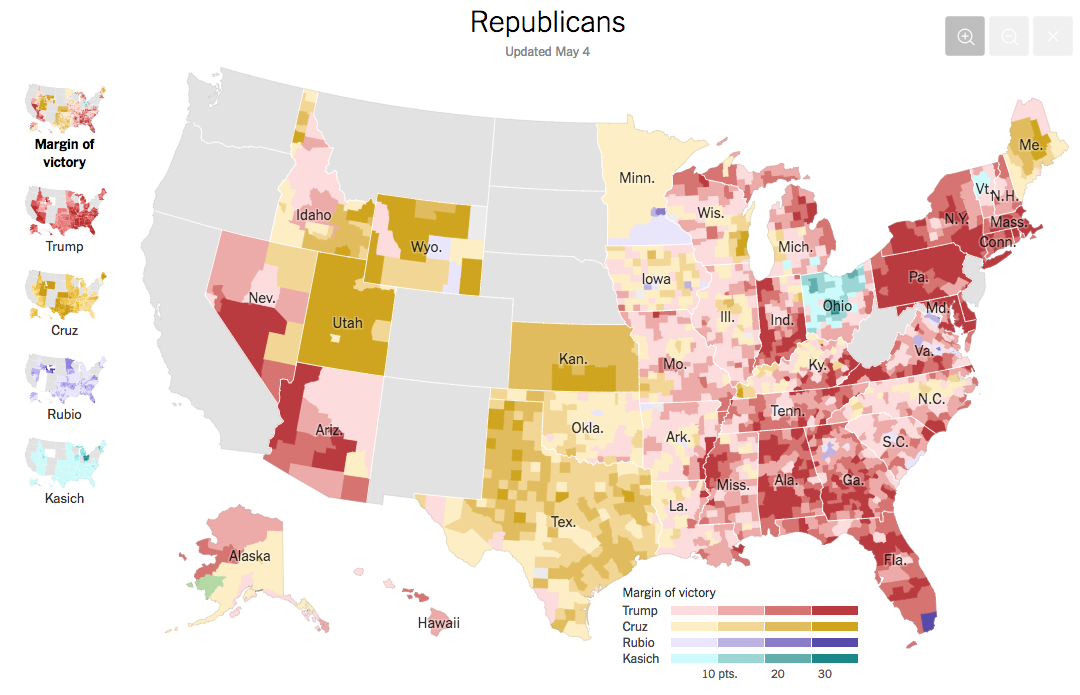
Results as of 4 May
Results as of 4 May

It started with wins in New Hampshire and, more importantly South Carolina. Candidates try to win Iowa and New Hampshire and whatever other states there are prior to Super Tuesday, because Super Tuesday requires a ground game that is expensive to maintain. And early victories lead to donations. But Trump’s crushing victory in South Carolina led to a series of wins in the deep Republican red South.

Importantly for this last phase of the contest, the Cruz campaign had bet on winning those very same southern states, the Bible Belt. While Cruz won Texas, it was his home state, he lost almost every other state. The map above shows just how wide and diverse Trump’s victories were. From liberal Massachusetts to Alabama and as far west as Arizona. The final one-two blow, however, came in the above map’s deepest reds: a swath from Rhode Island through Connecticut and New York into Pennsylvania then south into Delaware and Maryland. Trump was favoured in the Northeast and Mid-Atlantic, but most had not expected those margins. The second blow, look at the deep red in Indiana. Cruz needed to win Indiana. He lost it big. And now he has stepped aside.

Donald Trump will be the Republican Party candidate for President of the United States.

Who Led Ganister’s Orthodox Church

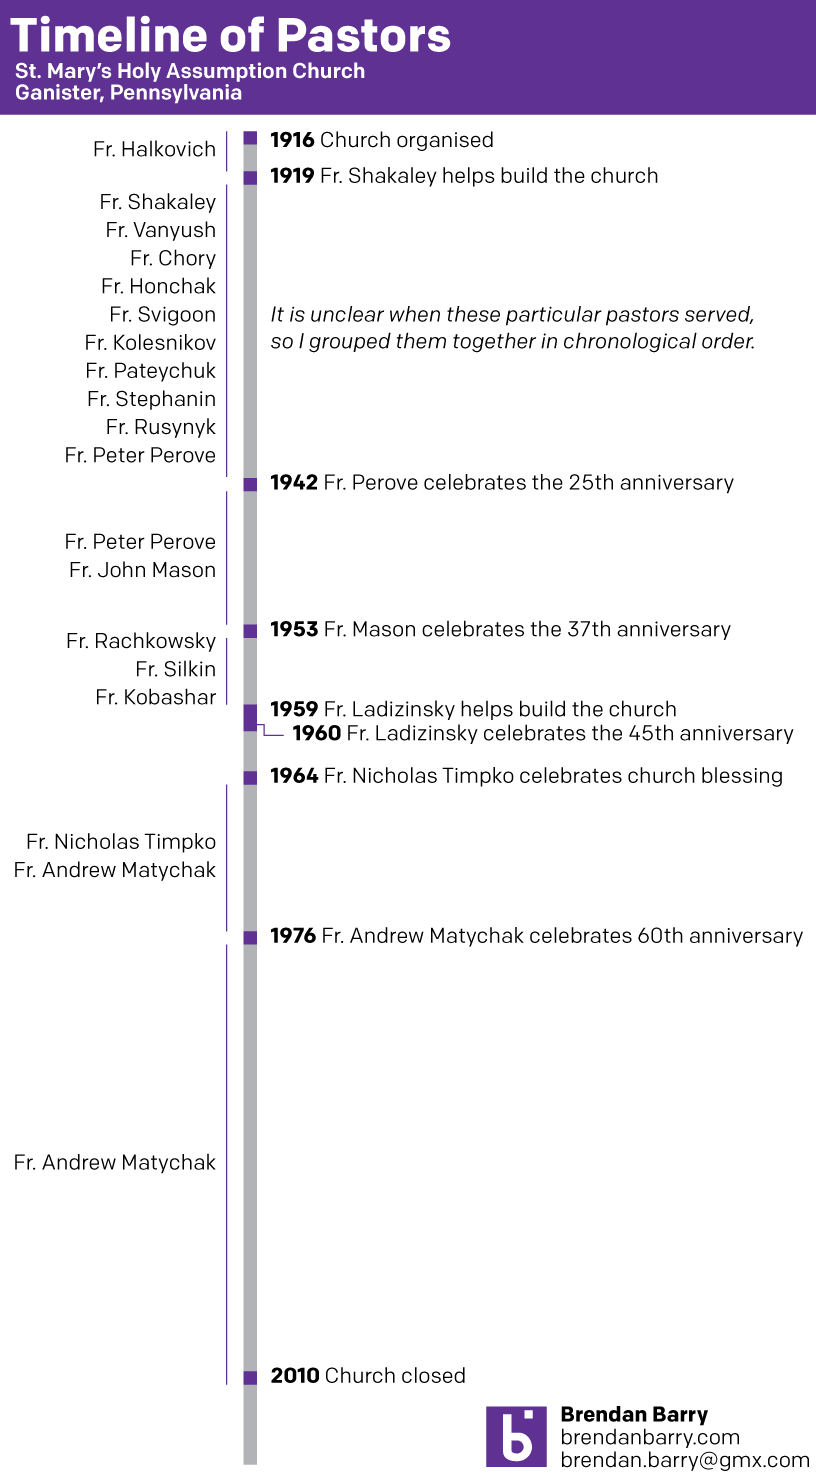
I spent the weekend in Ganister, Pennsylvania (shameless plug, you can learn more about the town on the website I built for it) where my immediate family gathers for Easter. The Orthodox version was obviously far later than the Catholic version this year. When here I try to do research on the town and the families who lived there. One of my long-standing projects includes researching the history of the church of my ancestors, St. Mary’s Holy Assumption Church. I wanted to understand who were the pastors over the almost 100 years the church was open. In a local library I found copies of a few anniversary service souvenirs and I used that to create this first draft of that timeline.

A timeline of Ganister priests

The Quadrants of Trump

My apologies to you for the blog being down the last week and a half. This is what happens when I get 33,000 spam comments in the span of 24 hours: the blog crashes. Rest assured, I have lots of things to post.

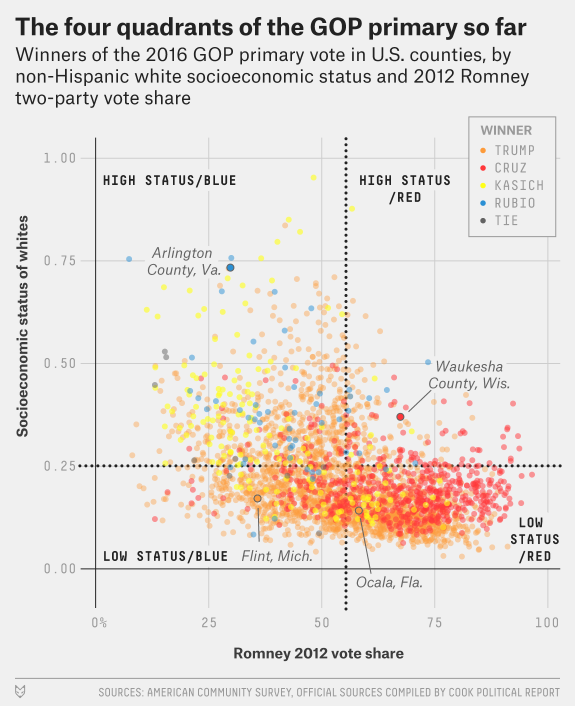
But for today, we are picking up after a yuuugge night for Donald Trump so let’s get on with the data visualisations. Trump decisively won Connecticut, Delaware, Maryland, Pennsylvania, and Rhode Island with a majority of votes in every state. As he made sure to point out, winning 50–60% in a three-way race is quite difficult to do. Simply put, Cruz and Kasich got destroyed.

Why is that? Well a few days ago—can you tell I meant to post this then?—David Wasserman over at FiveThirtyEight posted an insightful article about the various counties thus far contested and how, when divided into quadrants based on socioeconomics and conservativeness, Trump has won three out of four quadrants. The whole article is worth the read.

The Quadrants of Trump

Credit for the piece goes to David Wasserman.

Mapping a New America

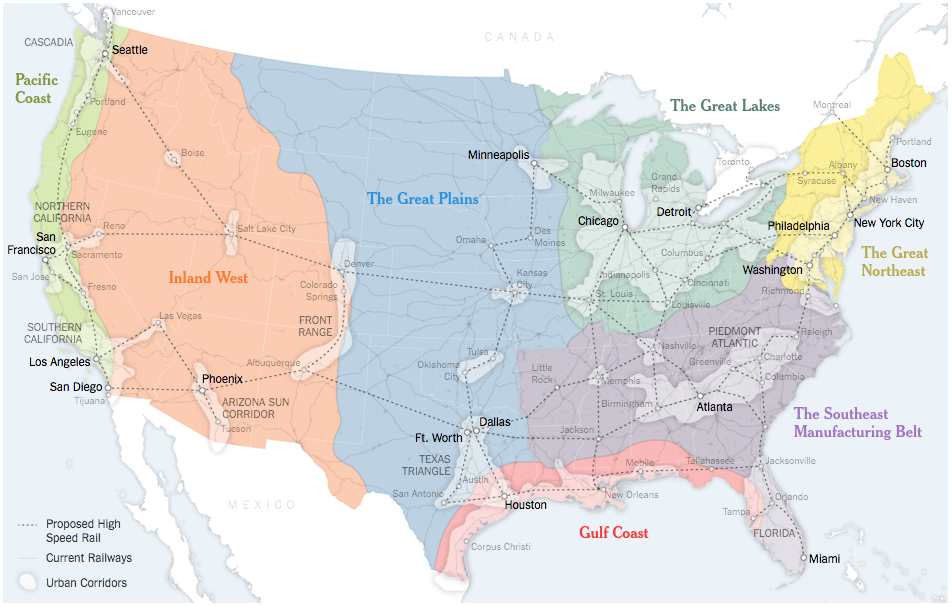
The United States of America consists of 50 states and hundreds of cities. In Sunday’s edition of the New York Times Parag Khanna argued for the switch of priority away from the state-level and to effectively the city-level. We have clusters of cities that dominate and drive the national economy.

The classic case-in-point is Bowash, the megapolis of interconnected cities from Boston to Washington, where there is a plan to extend Baltimore’s MARC public transit train to Wilmington, Delaware. If that were to happen, one could take public transit from the northern suburbs of New York City to Washington through Trenton, Philadelphia, Wilmington, and Baltimore. But today, those decisions must be taken as many as six different states. What if it were handled by a single, regional body?

The Great Northeast
The Great Northeast

The above map looks at what a New America could look like, as grouped into seven different regions and their urban clusters.

Credit for the piece goes to the New York Times graphics department.

Where’s the Cold Weather?

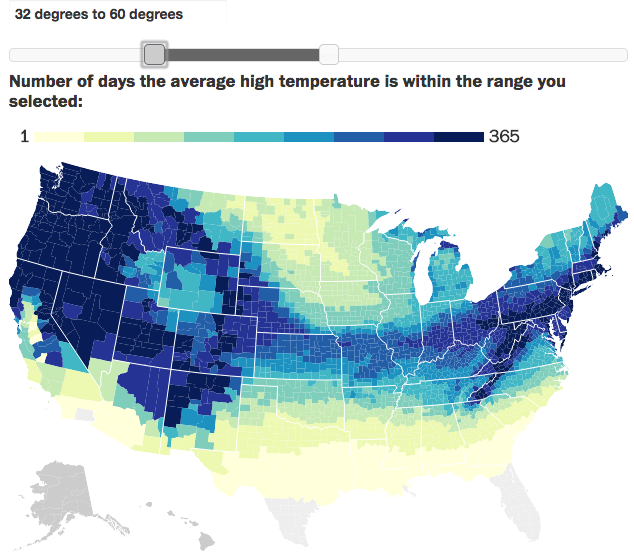
I prefer colder weather to warmer weather. I like to feel a bit of chill on my skin rather than a bit of warmth. This makes me that asshole who says “it’s great out today”, when the temperature is 5ºC (41ºF). (I also enjoy grey, cloudy days, but that’s a different matter entirely.) Anyway, thanks to a friend of mine I could take a look at some temperature maps of the contiguous United States.

High temperatures between 32º and 60ºF

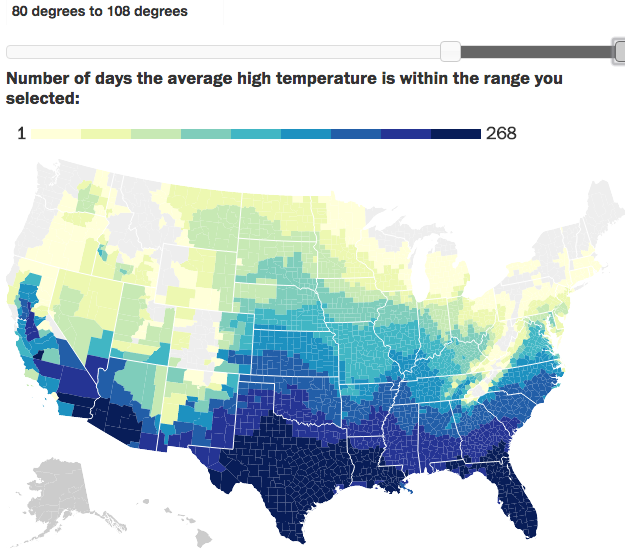
The Pacific Northwest or the coast of the Mid-Atlantic and New England would be great along with the desert and the mountains. But, don’t deserts get hot? Because the whole point would be to not live somewhere too warm. So here’s a map of the number of days where I prefer to sit inside and crank the air conditioning.

Way too hot
Way too hot

Basically I should avoid the South, the deserts and the plains states of the Midwest. Chicago looks borderline uncomfortable. (And from experience, summers typically are.)

Credit for the piece goes to Christopher Ingraham.

Impeaching Rousseff

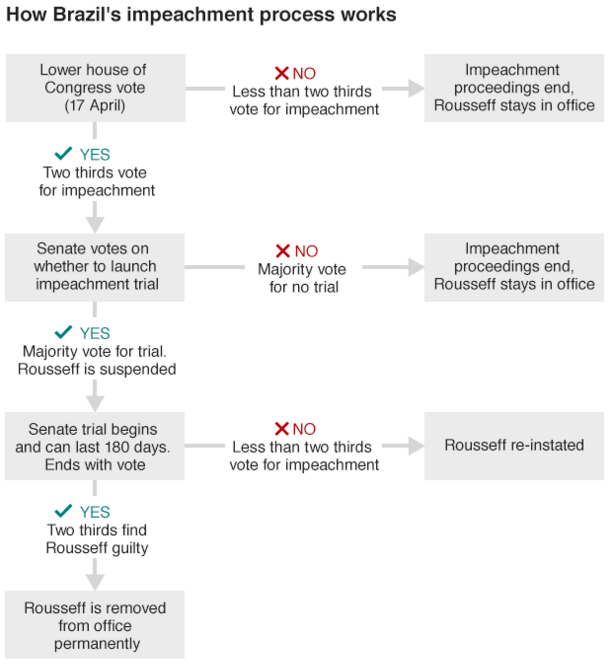
Who is Rousseff? She is the president of Brazil and both she and her government are currently mired in a corruption scandal. Yesterday a parliamentary committee voted in favour of proceeding with impeachment, the first step in a lengthy process. What is that process? Thankfully, we have a BBC graphic to explain it all.

Brazil's impeachment process
Brazil’s impeachment process

Credit for the piece goes to the BBC graphics department.

Design and Data Visualisation

Today’s piece features a critique of the data visualisation world from Christopher Ingraham at the Washington Post. It centres on the difference between these two maps. The one on the left is Ingraham’s and the one on the right from the Pew Charitable Trusts.

Spot the difference
Spot the difference

I do not want to spoil or ruin the article for you—it’s a short read after all. But the crux of the argument, which I believe extends beyond maps, is that despite the proliferation of tools to visualise data, one still needs to understand the principles behind it to create meaningful work. Anybody can put words to paper—look at this blog after all—but the truly great writers have the education and the experience to move and motivate people. And the same holds true for designers of data visualisation. And designers even more broadly.

If I have to add one design critique to Ingraham’s work, I would also add that design decisions like colours and map type also play a role in creating legible pieces. The grey lines in the Pew map versus the white lines in the Post’s make it difficult to read the colours in the smaller, eastern counties of the United States.

Credit for the Washington Post piece goes to Christopher Ingraham.

Credit for the Pew Charitable Trusts piece goes to Pew’s graphics department.