The Crane Crash in Mecca

Sometimes when you are reading something, what you really need is context. Personally, I prefer visual context over textual, but not everybody is so thankfully we can do both. Last week a crane collapsed during inclement weather in Mecca and fell upon the Grand Mosque. I knoew that it was a large crane, but it was not until I saw this piece from the Washington Post that I truly understood just how large. People can write so many feet or this many feet all day long, but the visual juxtaposition of the crane against the Washington Monument is far more impactful.

How big was the crane?

Credit for the piece goes to Richard Johnson.

The EU’s Migrant Problem

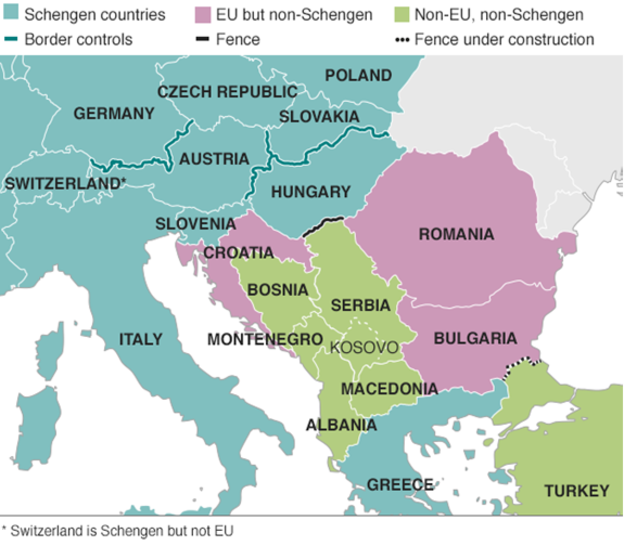
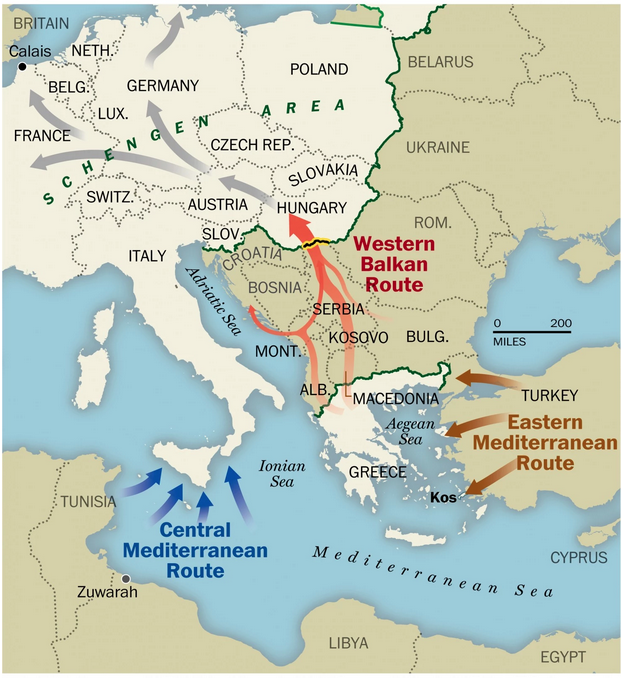
Last week we looked at a map produced by the Washington Post, which detailed the routes chosen by migrants and refugees desiring to reach the European Union. This week, I want to compare that to one from the BBC—there are others, even from the BBC, but we will examine them later—that details the differences in countries along the route.

EU border map
EU border map

The previous map simply highlighted countries in the Schengen Area, which allows for Passport-free travel between participating EU members. This map uses colour to denote which countries participate and whether they belong in the EU. But it also uses white lines to indicate border, so that Schengen Area countries seem more contiguous. This allows them to use colour to add the layer of recent news: recently imposed border controls and newly constructed fences. My concern in this particular piece is that those pink and green countries should probably have some sort of line indicating that they do have border controls.

Credit for the piece goes to the BBC graphics department.

David Ortiz Still Has 500 Home Runs

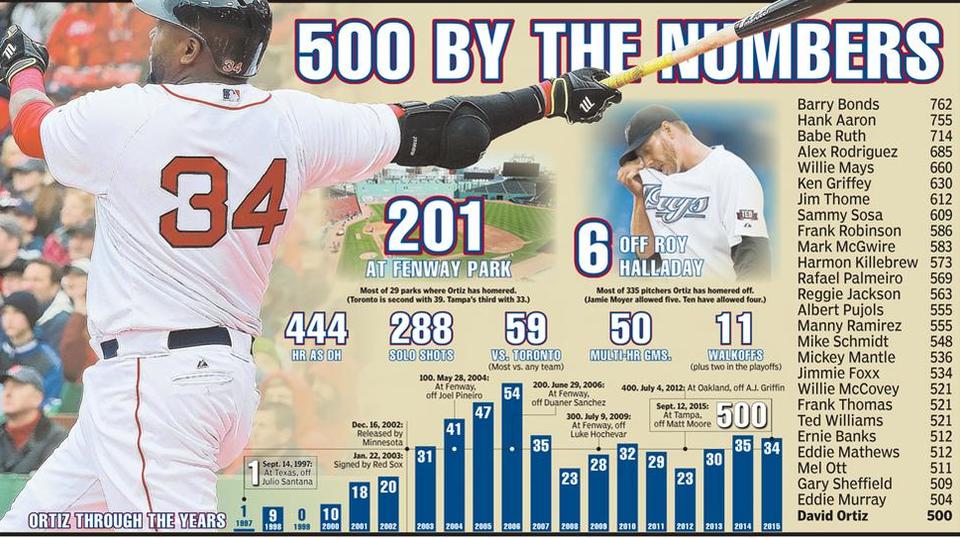
So what I was saying yesterday about there not being a new Boston Globe piece about David Ortiz’s 500 home runs. I was wrong. I missed it. But, here you go, in its semi-splendour (not digging the illustration of the baseballs /quibble). There are some merits to the piece in terms of the filtering—you can by season, opponent, or the teams for which Ortiz played (only 58 for the Twins)—but let us not lose fact of the fact that this is all about No. 500.

I have seen a few in my years, including that one.

Credit for the piece goes to Patrick Garvin.

David Ortiz Has 500 Home Runs

This past weekend, David Ortiz hit his 500th home run, a significant milestone in Major League Baseball attained only by a handful of players. This piece from the Boston Herald commemorates the feat—with too many photographs and embellishment for my liking—by putting his season totals on a timeline while putting Ortiz at the bottom of the 500+ home run club.

The timeline of the home runs

The following piece dates from April 2015 and was about the impact of defensive shifting on Ortiz, but it has a nice graphic on his home run output. It’s just outdated by most of this season. But, from a data viusalisation standpoint, I find it a far more useful and telling graphic.

A look at Ortiz's home runs
A look at Ortiz’s home runs

Credit for the Boston Herald piece goes to Jon Couture.

Credit for the Boston Globe piece goes to the Boston Globe graphics department.

Jesus and the Footprints

I’m Irish—my ancestors were from the southern part—and so I grew up Catholic and I went to Catholic schools. So I know some of my Jesus stories. There’s that one story about how at the end of some guy’s life he looks back at a beach—I have no idea what life means being on a beach—where he walked. He sees two sets of footprints and asks Jesus, “Bro, why are there two sets?”

“Dude bro, that’s me.”

“Whoa, then why are there sometimes only one set?”

“That’s when I carried you.”

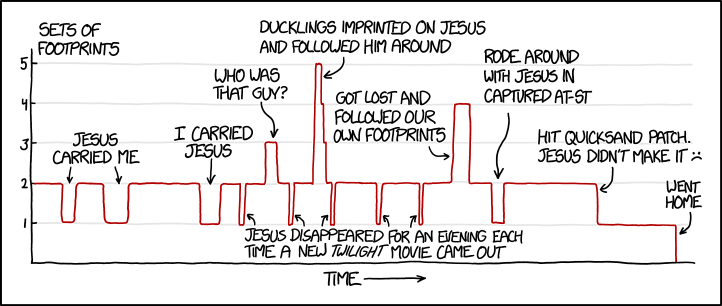
My interpretation of Jesus speech notwithstanding, it’s one of those stories that is supposed to teach you that you are not alone. Probably because the thought of being a random event in the entire series of random events in the universe(s?) frightens people. Anyway, Randall Munroe over at xkcd took a look at the footprints story. Happy Friday, all. (And you too, bro. That’s right, I’m looking at you, Jesus.)

Footprints
Footprints

Comparing Elizabeth to Victoria

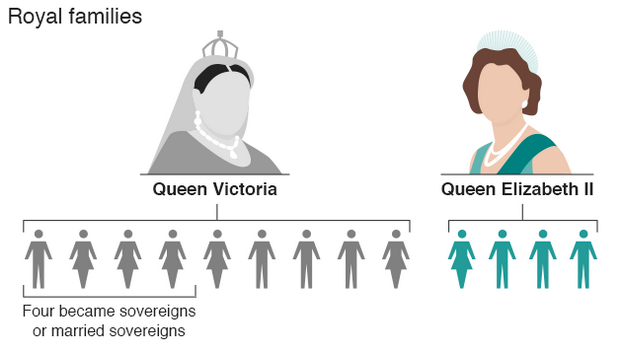
Following on from yesterday’s post about Queen Elizabeth’s timeline as she passed Queen Victoria, today we have another selection from the BBC that compares the reigns of the two queens. Unfortunately, while the screenshot below is okay, the overall graphics and illustrations strike me as a bit too simple and not terribly useful in making comparisons.

The royal families
The royal families

Credit for the piece goes to the BBC graphics department.

Queen Elizabeth II—Britain’s Longest Reigning Monarch

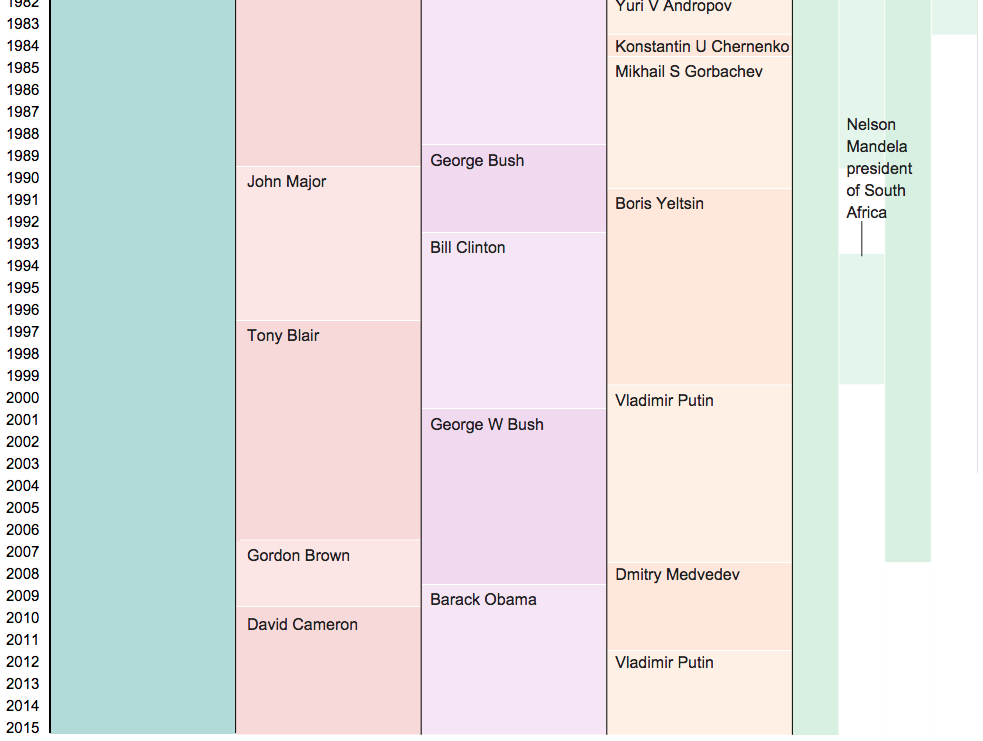
As of today, Queen Elizabeth is the longest reigning British monarch. She has surpassed the record of the famous Queen Victoria, Elizabeth’s great-great-grandmother at 63 years and seven months. Obviously a lot of things have changed over those 63 years, and in this article the BBC uses a graphic to look at how the world stage has changed.

Queen Elizabeth II's reign
Queen Elizabeth II’s reign

Credit for the piece goes to the BBC graphics department.

Europe’s New Migration

I was on holiday for a little bit, so apologies for the lack of content. But, now I am back for a little while. So here’s hoping life gets a bit more settled and content can be published more regularly.

Whilst I was on holiday, I only checked the news a few times and most of it seemed to be consumed by the migration/refugee crisis facing the European Union. While I could type away ad nauseam on the issue, the best way to engage you on the topic would be through a Washington Post map that details the different paths migrants/refugees use.

Migration map routes

I am hoping that in the future I will find sufficient other charts and graphics others have made to comment on a very important issue.

Credit for the piece goes to the Washington Post graphics department.

Living on the Grid

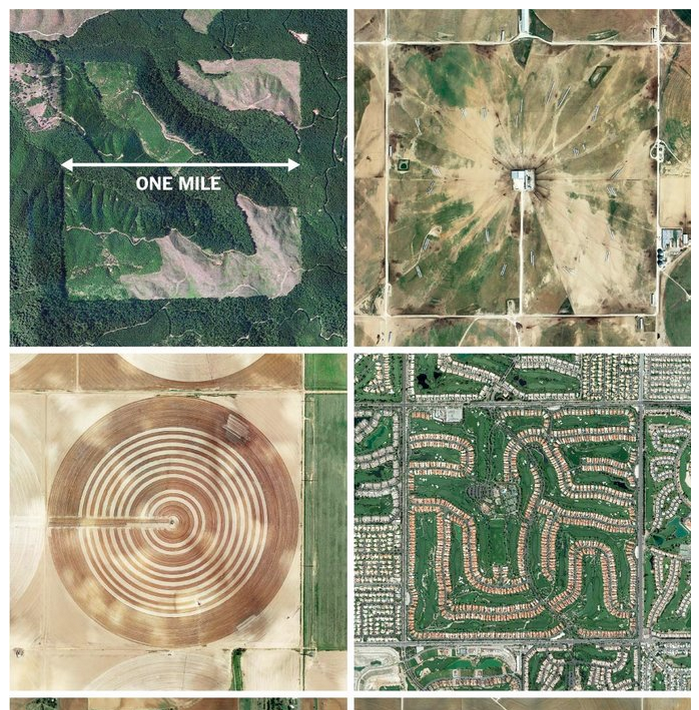
Today’s post relates very much to yesterday’s post. But this one is from the New York Times and uses aerial photography to showcase how the Jefferson grid system works in reality after it was implemented as shown yesterday.

The Jefferson grid
The Jefferson grid

Credit for the piece goes to the person behind the Instagram account @the.jefferson.grid

Organising Western Lands

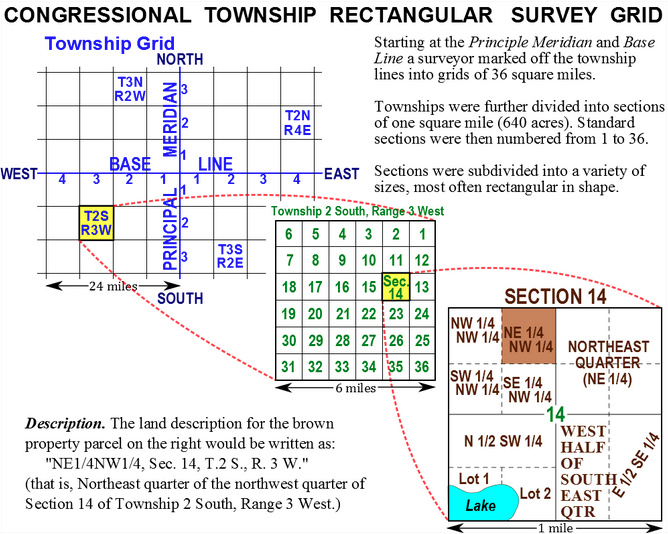
A few weeks back I looked at my ancestral family’s land grant in Wisconsin. Unlike land on the East Coast that was surveyed and organised by pioneers in different colonies using different sets of rules, after the formation of the United States, surveyed land was organised into townships that had subdivisions. In this blog post I found about the subject, there are several diagrams and maps that explain just how this system worked.

How western lands were organised

If you’re curious about how western land was organised, its worth a quick read.

Credit for the piece goes to Living History Farms.