xkcd reminds us that not all infographics need to be complex to tell a tale.

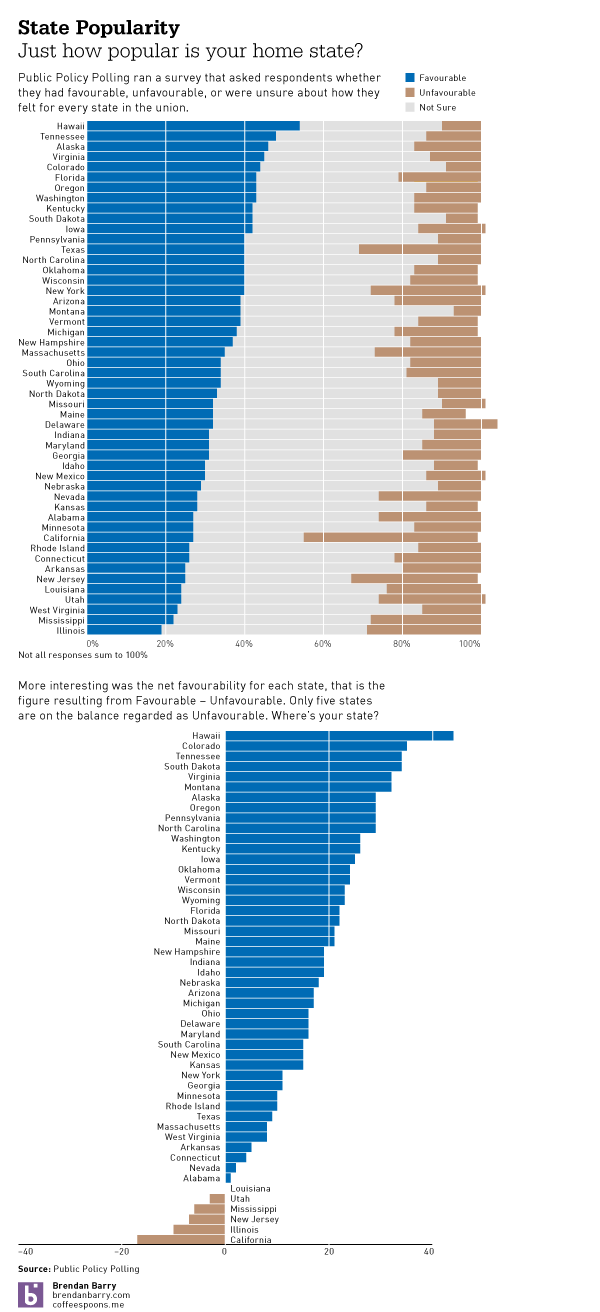
Public Policy Polling had a survey in February where they polled respondents on whether they had favourable or unfavourable attitudes towards states, or if they were not sure. As a Pennsylvania transplant to Illinois, I can say that Pennsylvania came out a bit better than Illinois. But how about your state?
This piece in the Globe and Mail of Toronto looks at smartphone usage by operating system through a comparison of Canada to both the United States and Japan.

While I understand the need for aesthetic distinction from having an entire page of bar charts, these ring or donut charts are a touch misleading. Because of the space between rings, the radius of each circle from the central Android icon is significantly increased. This of course proportionally scales up the length of each segment within the rings. In short, it becomes difficult to compare segments of each ring to the corresponding segments on the other rings without looking at the datapoint. And if you need to look at the datapoint, one could argue that the infographic has failed from the standpoint of communication of the data.
Beneath is the original (with the legend edited to fit into my cropping) with two very simple (and hasty) reproductions of the data as straight pie charts placed next to each other and then as clusters of bar charts grouped beneath each other. I leave it to you the audience to decide which is easiest to decode.


Credit for the Globe and Mail piece goes to Carrie Cockburn.
Sunday in the New York Times, an article on bicycle delivery had an accompanying infographic. It detailed the dinner route of the article’s main individual. The piece is an interesting use of small multiples to provide a timeline of a route, while each new delivery maintains the old paths for reference. And from a data perspective, I found it good to acknowledge the one instant where the follower lost contact with the delivery man.

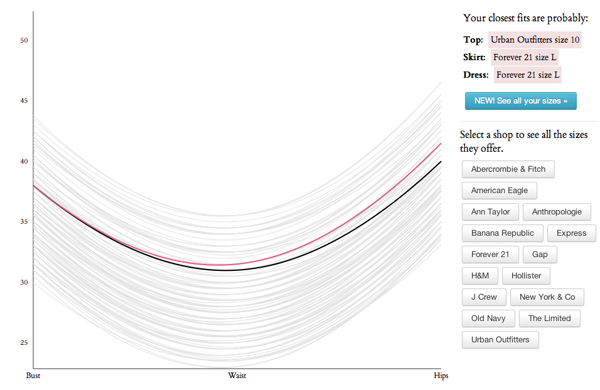
The subject matter of this piece is out of my area of expertise, but should you be in the UK and looking at women’s fashion, apparently not all listed sizes are the same. This piece by Anna Powell-Smith takes as an input a woman’s size measurements and then best fits them to the known sizes by several major brands by type of outfit: shirt, skirt, and dress.
In case you were wondering, yes, Virginia, politics in the United States are becoming more polarised. Olympia Snowe, the moderate Republican senator from Maine, is not running for re-election. And so the Senate is left without one more centrist counterweight to an extreme. To try and show how extreme, this graphic from the New York Times plots how often senators voted with their party.
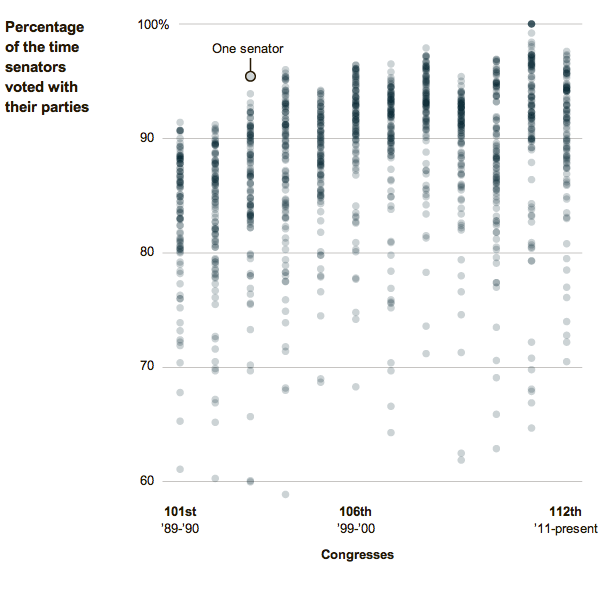
While the chart does not have a marker for the average of each Congress, everyone can see the general trend line. Up. And up means less compromise. And less compromise means getting less done.
Sunday afternoon in Burlington, Canada, a VIA passenger train—think Canada’s version of Amtrak—derailed shortly after switching tracks. The two engineers in the locomotive and their trainee died in the accident, which is still under investigation.
The National Post covered the story and included a few graphics to explain just what happened. Maps pointed out exactly where the train derailed. The graphic below details how a switch works for those unfamiliar with rail transport.

And lastly, a larger graphic attempts to explain what may have happened in lieu of the final accident report from the Canadian Transportation Safety Board.

Credit for the switches graphic goes to Andrew Barr and for the accident diagram credits go to Richard Johnson.
Somalia is beset by a bevy of problems; from an Islamist insurgency that holds great swathes of the south, to the de facto independent regions of Somaliland and Puntland in the north, to the pirates operating off the coast, to the barely functional government in Mogadishu that controls only sections of the capital through the backing of an African Union peacekeeping force, to the recent famine that devastated the south of the country.
The famine, which ended formally ended only earlier this month, is the focus of an interactive piece by the Guardian. It examines how the tragedy unfolded, especially when early indicators pointed to the likelihood of a famine. Through a timeline, the piece marks out what happened when—probably important as not all readers may be familiar with the details of the disaster—atop a chart that visualises the aid given to Somalia. Other line charts describe who donated and when.
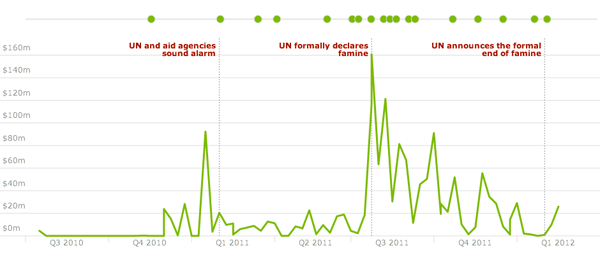
The most interesting, however, is an investigation into what (perhaps) spurred the donations. Using the same timeline as a common base, it charts when donations were made against mentions in six US and UK media outlets against Twitter mentions and Google Search Insights.
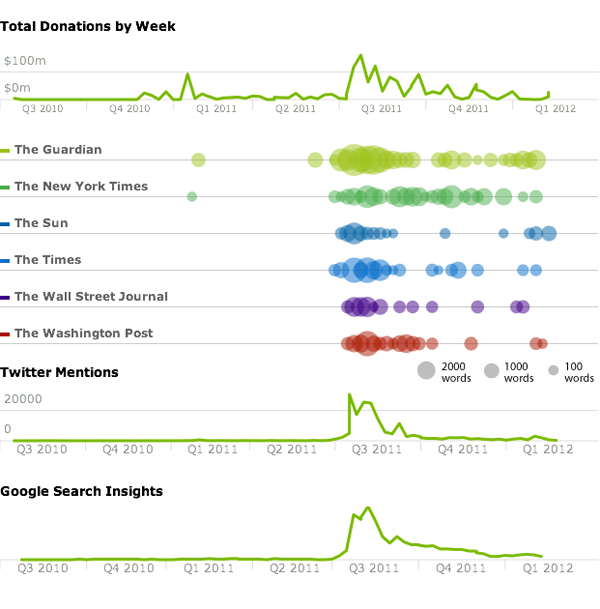
With this last bit in particular, the Guardian has attempted to use data visualisation to support an argument made in accompanying text. Often times data visualisation and infographics will simply document an event or provide facts and figures. Here, however, an attempt was made to link the aid effort to media coverage (90% of aid came to Somalia after the story broke in the media), perhaps to show causation. But, the writer admits that ultimately the visualisation can only show the overlap or correlation, which the writer further notes is itself consistent with academic debate over the existence of the “CNN effect”.
Credit for the piece goes to Claire Provost, Irene Ros, Nicola Hughes, and the Guardian Interactive Team.
So apparently last night actors, directors, and others associated with the production of films won little statues. (And then probably celebrated with fancy foods and wines.) Yes, last night was the Academy Awards. But who is this Academy that decides upon the best films and performances?
As it turns out, the demographics of the Academy do not quite mirror those of the broader country. Just over a week ago, the Los Angeles Times looked at the Academy and visualised its membership, discovering the details of which was itself a journalistic feat.
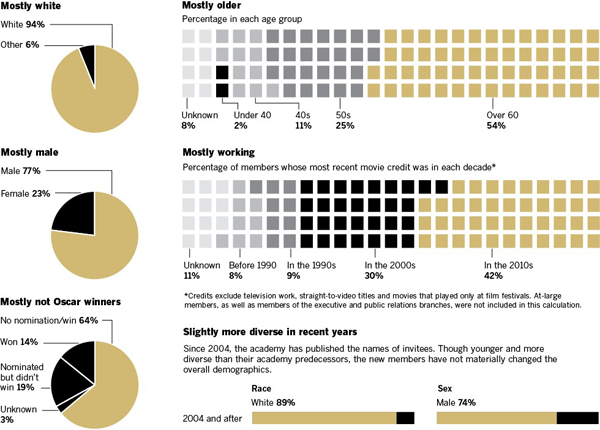
After a broad overview with pie charts and such, each branch was mapped as a choropleth to the Los Angeles area. Those members from outside the LA metropolitan area were given small squares to represent their cities.
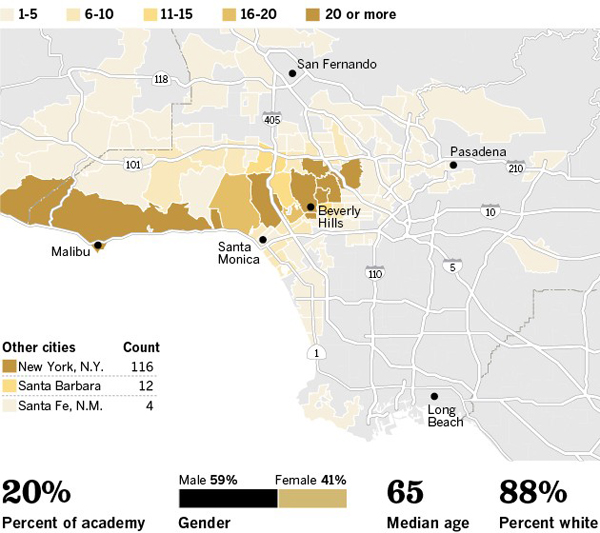
As someone not at all familiar with Los Angeles and its neighbourhoods, perhaps where the members of the various branches of the Academy live is actually somewhat interesting. However, I fail to understand the value in that. More useful is the idea of breaking out a socio-economic demographic and mapping that data. And if that had been the case here we almost have a set of small multiples. These are just a bit big.
Overall, a solid body of work.
Credit for the visualisation piece goes to Doug Smith, Robert Burns, Khang Nguyen, and Anthony Pesce.
From DHL and fashion designer Fyodor Golan comes an infographic-y video explaining how a high-fashion dress is sourced.

via the Guardian