Brexit Trilemma Update

This week is the Conservative Party Conference in Manchester where the Tories unveil their government programmes and platforms. Naturally it has been overshadowed by allegations that Boris Johnson groped one (maybe two) reporters at a dinner in 1999. Just prior to that scandal, however, there was another. In this, Johnson was allegedly having an affair with an American businesswoman for whom he then arranged lucrative business deals whilst in office as the Mayor of London. Johnson has been referred to a police unit for further investigation in that matter. Sounds like some, you might say, golden parallels to…someone or something.

But today’s big news about the government’s plans is that they might have one regarding Brexit. And that plan is to essentially create a hard border between Northern Ireland and Ireland, violating certainly the spirit if not the letter of the Good Friday Agreement that brought the end to the Troubles.

Why is this a big deal? Well, one, remember all the debates during the Brexit Referendum campaign about the Irish border, how the different groups had different solutions to this fundamental problem?

Oh wait, yeah, nobody ever brought this up. Sorry.

So back to my trilemma graphic. I’ve updated it to show which two sides of the triangle Boris Johnson seems to be choosing. To be fair, as I’ve said many times, the UK cannot have all three points of the triangle. They need to pick two. And so, unlike Theresa May, Johnson is at least picking two. My problem is that this was never discussed during the Brexit debates and it seems a rather drastic decision to not have it be confirmed by the people since they never explicitly voted on it.

You may not like it, but at least Johnson is picking sides…

Credit for the graphic is mine.

A Very Loud Tube

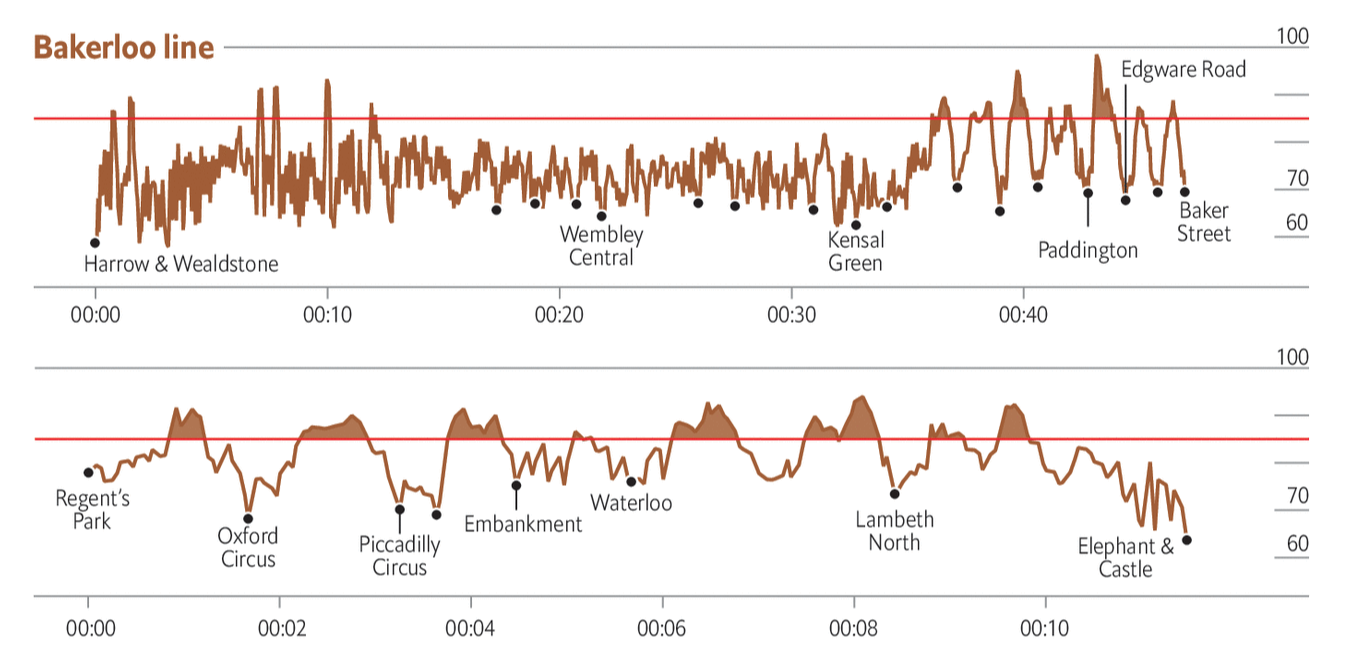
As all my readers probably know, I love London. And in loving London, I love the Tube and the Oyster Card and all that goes along with Transport for London. But, I have noticed that sometimes when I take the Underground, there are segments where it gets a bit loud, especially with the windows open. The Economist covered this in a recent article where they looked at some data from a London-based design firm that makes noise protective gear. (For purposes of bias, that seems important to mention here.)

The data looks at decibels in a few Underground lines and when the levels reach potentially harmful levels. I took a screenshot of the Bakerloo line, with which I am familiar. (At least from Paddington to Lambeth.) Not surprisingly, there are a few segments that are quite loud.

I definitely recall it being loud

I like this graphic—but like I said about bias, I’m biased. The graphic does a good job of using the above the 85-decibel line area fill to show the regions where it gets loud. And in general it works. However, if you look at the beginning of the Bakerloo line noise levels the jumps up in down in noise levels, because they happen so quickly in succession, begin to appear as a solid fill. It masks the importance of those periods where the noise levels are, in fact, potentially dangerous.

I have had to deal with this problem often in my work at the Fed, where some data over decades is available on a weekly basis. One trick that works, besides averaging the data, is thinning out the stroke of the line so the overlaps do not appear so thick. It could make it difficult to read, but it avoids the density issues at the beginning of that chart.

All in all, though, I would love a London-like transport system here in Philly. I’d rather some loud noises than polluting cars on the road.

Credit for the piece goes to the Economist Data Team.

The Trilemma Remains for Boris

This is a repost of sorts, but it is important. Now prime minister, Boris Johnson had an opportunity to seek a more reasonable approach to Brexit. Unfortunately, he is drawing even harder red lines than his predecessor, Theresa May. And that brings us back to my Brexit trilemma graphic from back in March.

Essentially, Johnson wants three things that are mutually—or whatever the word is for three, maybe tri-mutually—semi-exclusive. In other words, of the three red lines, the United Kingdom can only have two, because those two then make the third impossible.

Doing the same thing but expecting results…pick two already, Boris.

I made the first version of this back in March. Sad it still applies.

Credit for the piece goes to me.

Notre Dame Almost Did Collapse

Back in April the famed Notre Dame cathedral in Paris caught fire and its roof and spire spectacularly collapsed. At the time I looked at a few different pieces, including two from the New York Times, that explored the spread of the fire. Several months later the Times has just published a look into how the firefighters saved the cathedral from collapse.

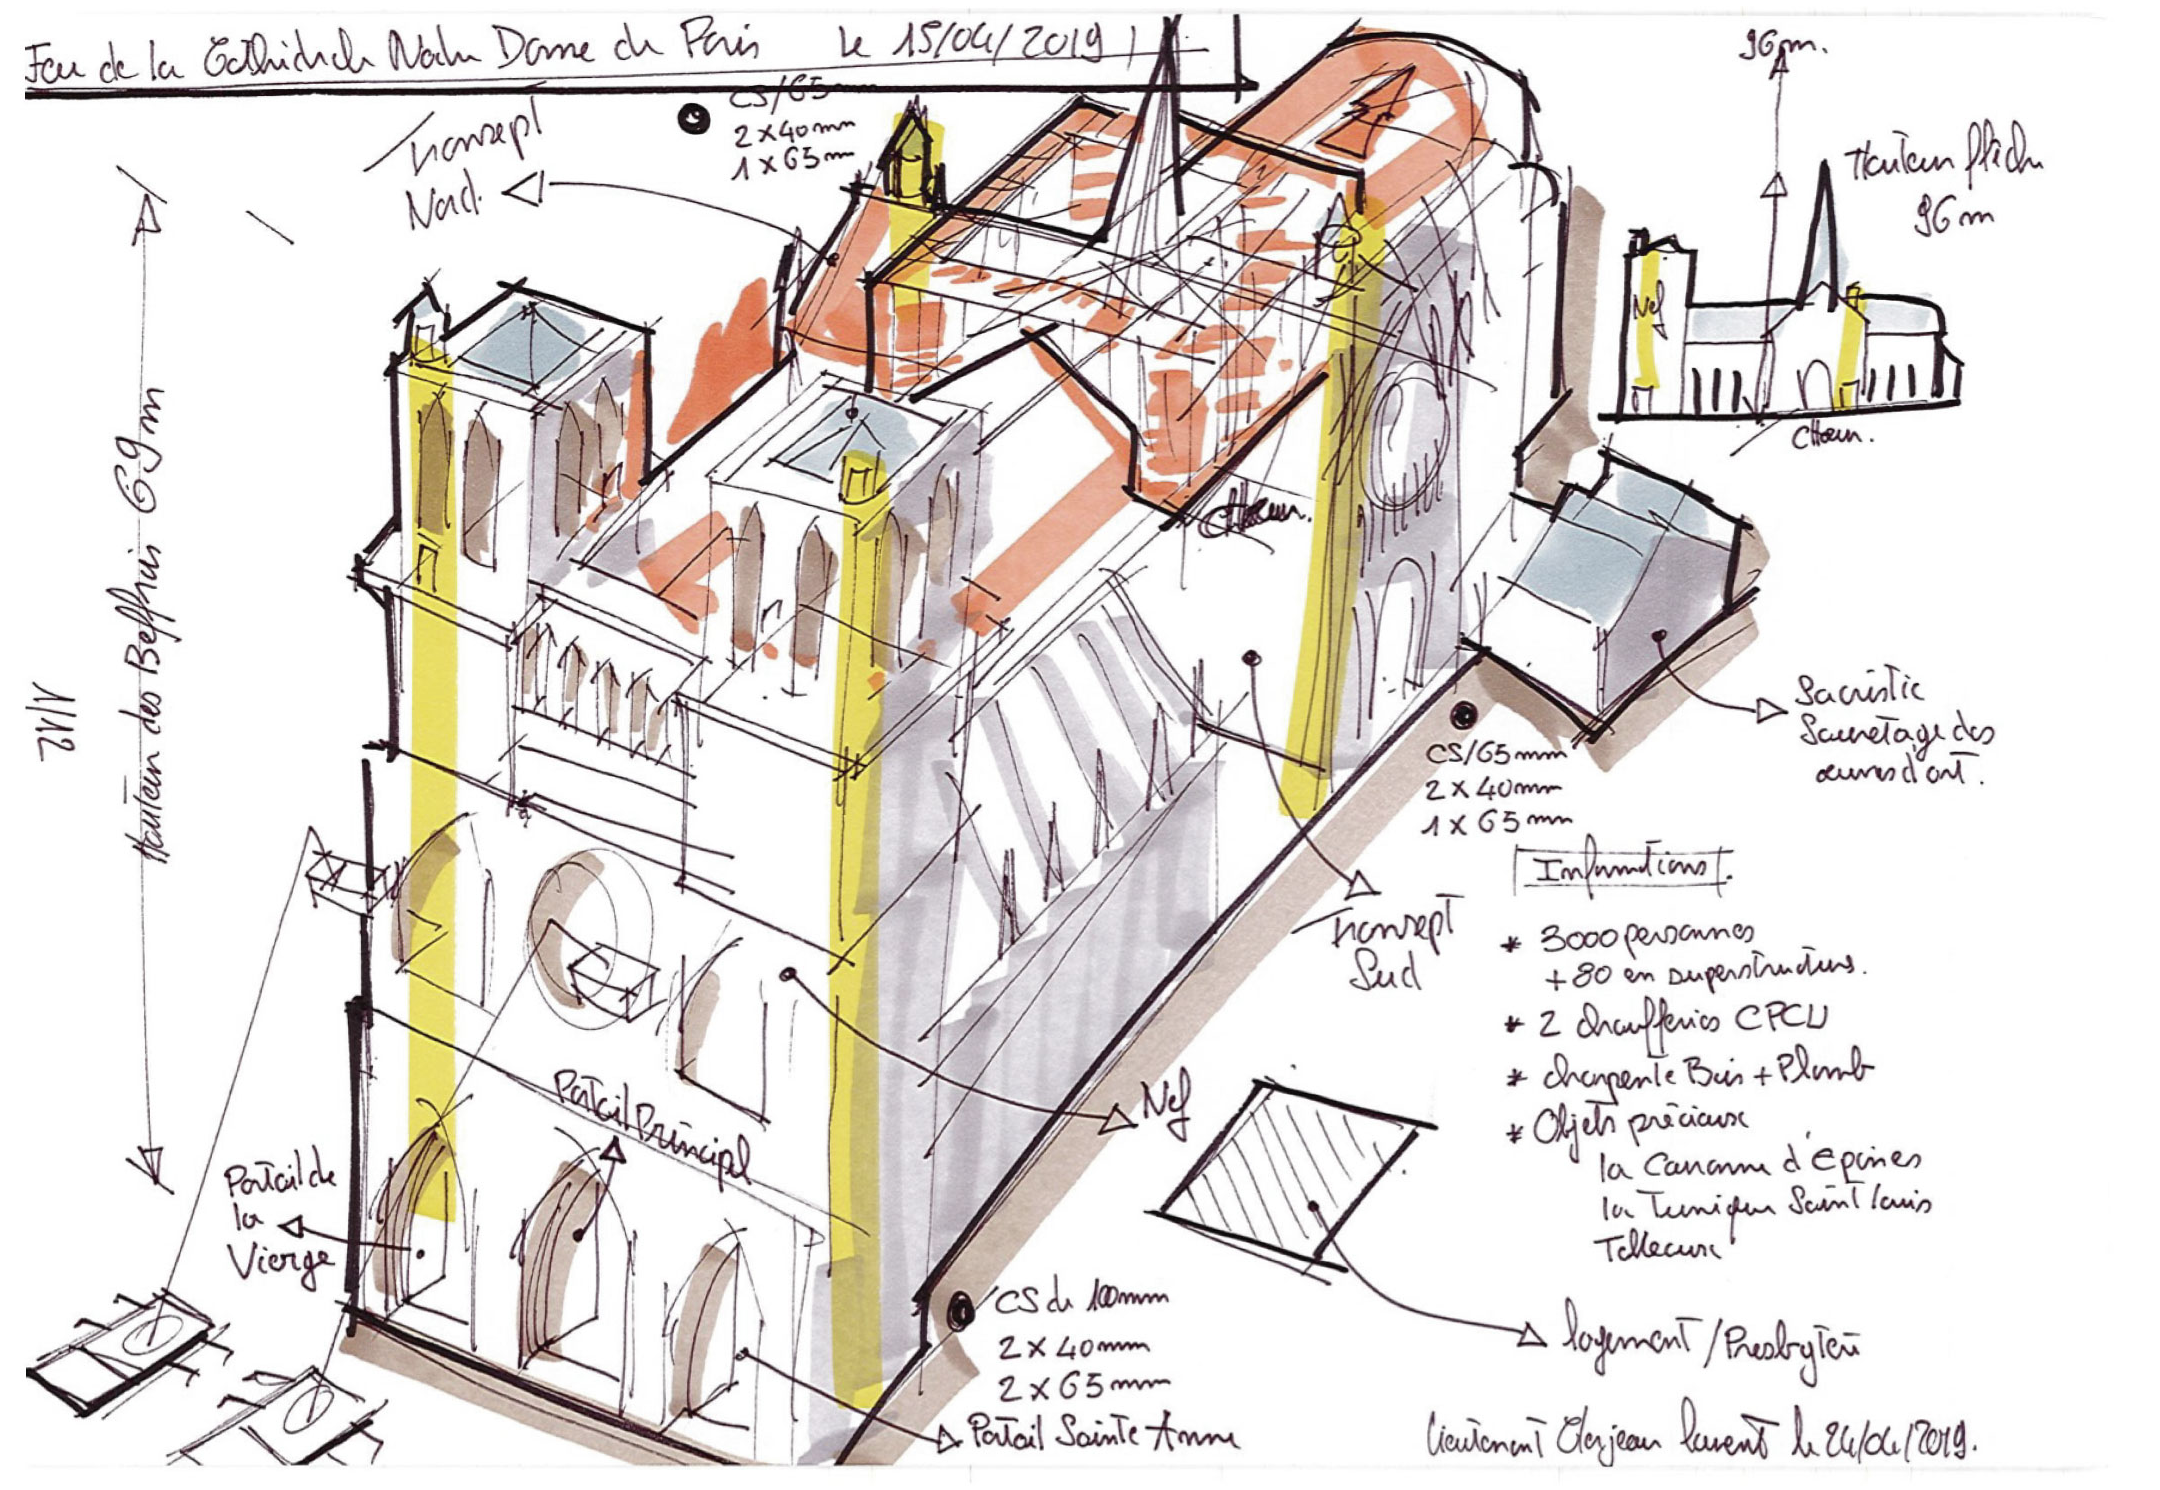
The graphics are the same amazing illustrated models from before. Now with routes taken by firefighters and coloured areas indicating key equipment used in the fight to preserve what could be saved. But the real gem in the article are a series of graphics from the firefighters themselves.

Some pretty hot sketches here

Naturally the annotations are all in French. But this French firefighter and sketch artist detailed the progress of the battle during and in the days after the fire. It makes me wish I could read French to understand the five selected sketches the Times chose to use. And I love this line from the Times.

For all the high-tech gear available to big-city fire departments, investigators still see value in old-school tools.

If you are interested in the story of how the cathedral was saved, read the lengthy article. If you just want to see some really amazing and yet wholly practical sketches, scroll through the article until you get to these gems.

Credit for the overall piece goes to Elian Peltier, James Glanz, Mika Gröndahl, Weiyi Cai, Adam Nossiter, and Liz Alderman.

Credit for the sketches goes to Laurent Clerjeau.

A World Without Addresses

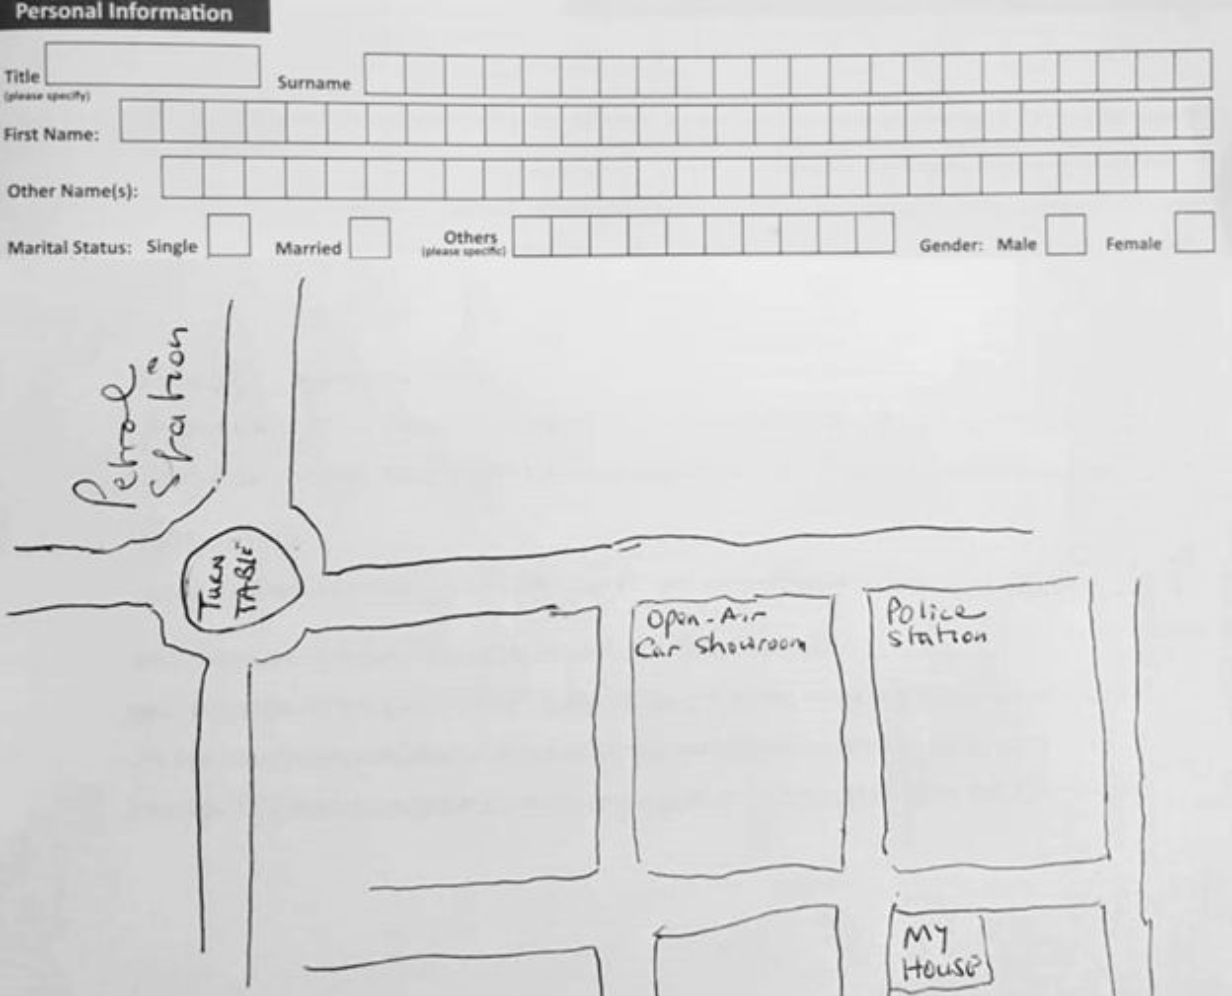
I am always intrigued by the mental maps people create for themselves and the environments in which they live. (Try it yourself, draw a map of your day-to-day world. How far can your mind draw streets, neighbourhoods, landmarks, &c. without the aid of a Google Maps?) In this article from the BBC, a Sierra Leonean-Gambian journalist related how he dealt with the lack of a formal address system in the Gambia impacted his ability to do even the simple things like providing a mailing address on postal or banking forms. They provide a very large space for the individual to draw their home address on a map.

At the corner of the street south of the roundabout and between the police station and  open air car showroom.
At the corner of the street south of the roundabout and between the police station and open air car showroom.

But unlike my interest in what could you or I draw, this is practical. There is no other option than to be able to draw your neighbourhood. The whole article is well worth a read to help you…gain perspective on your surroundings.

Happy Friday, all.

Credit for the piece goes to Ade Daramy.

The Chrysanthemum Throne

Today we move from the Iron Throne of Westeros (Game of Thrones) to the Chrysanthemum Throne of Japan. Emperor Akihito abdicated his throne in favour of his son Naruhito. Fascinatingly, because Japanese monarchs are not allowed to abdicate, the Japanese parliament had to pass a law allowing Akihito to do just that. It was also a one-time deal. The next emperor would need similar legislation should he ever want to abdicate. You will also note there are a lot of male pronouns in this paragraph. By law, women cannot inherit the throne. And when royal princesses marry, they leave the royal household.

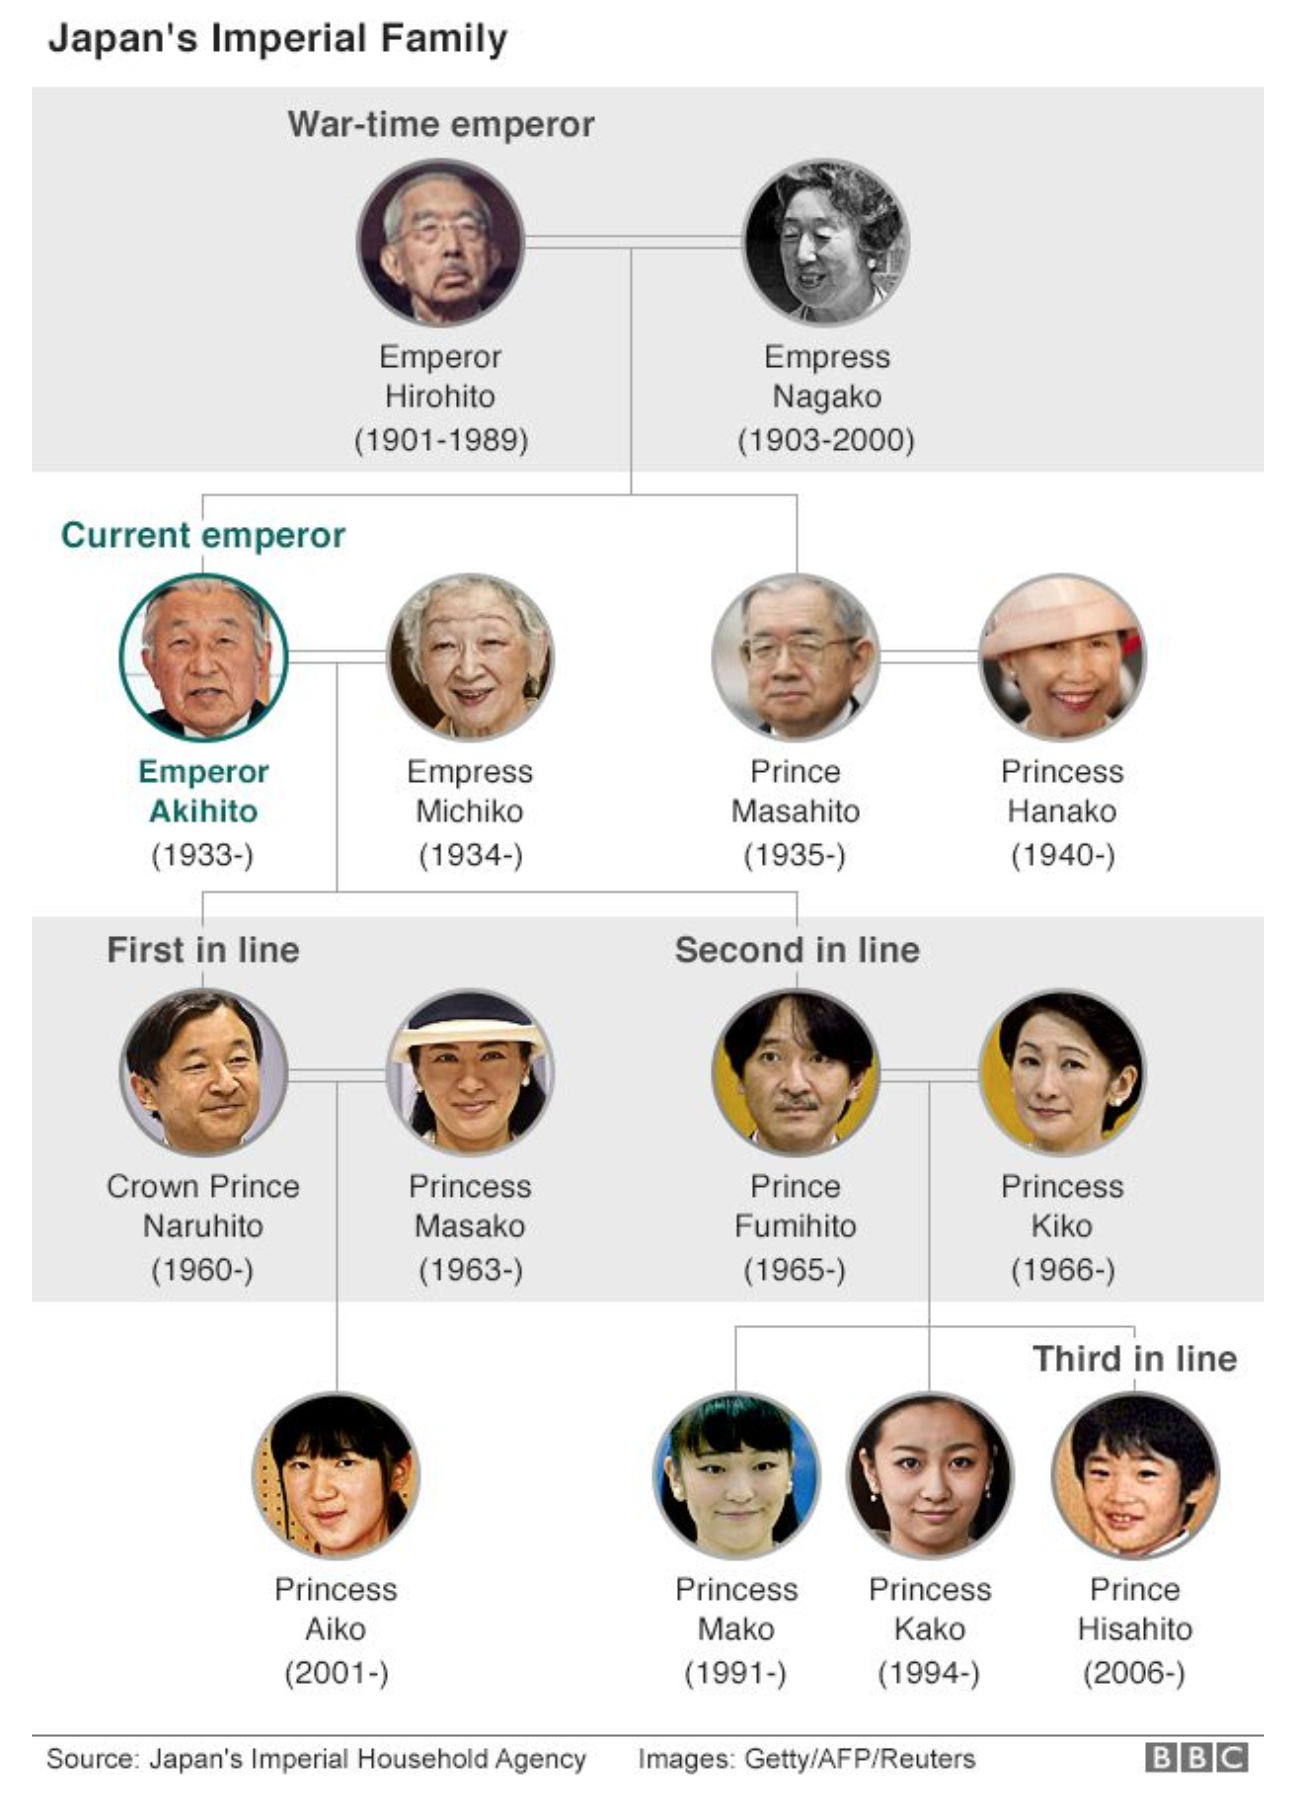
Not surprisingly, the news today had some graphics depicting the family tree of the Japanese royal family. And you all know how much I am a sucker for genealogy related work. This piece comes from the BBC and it is pretty simple. It uses a nice grey bar to indicate the generations and some titling indicates who succeeds whom.

There ain't no Cersei here…
There ain’t no Cersei here…

The graphic also makes rather painfully clear that if Japan wants to preserve its monarchy, it will need to embrace some kind of reforms. There are only four males left in the line of succession and only one is likely to have any sons.

Credit for the piece goes to the BBC graphics department.

The M87 Black Hole in Context

Last week we looked at the amazing news that astronomers had finally photographed a black hole. Or, technically, the shadow of a black hole since the black hole itself cannot be seen. I want to return to that news, because it’s awesome. And because xkcd published a piece that annotated the image to show the size of things by comparison.

I had mentioned that it was a supermassive black hole, some of the biggest of the bigs. And M87 is a beast.

Voyager 1 is barely at the event horizon…

Credit for the piece goes to Randall Munroe.

The Fire at Notre Dame Cathedral: Part Trois

On Tuesday I talked about a small article published by the New York Times that looked at the cathedral fire. I lamented that there were no immediate graphics explaining what happened. Just give me two days. Tuesday we had the BBC piece and then yesterday the New York Times published a more extensive look.

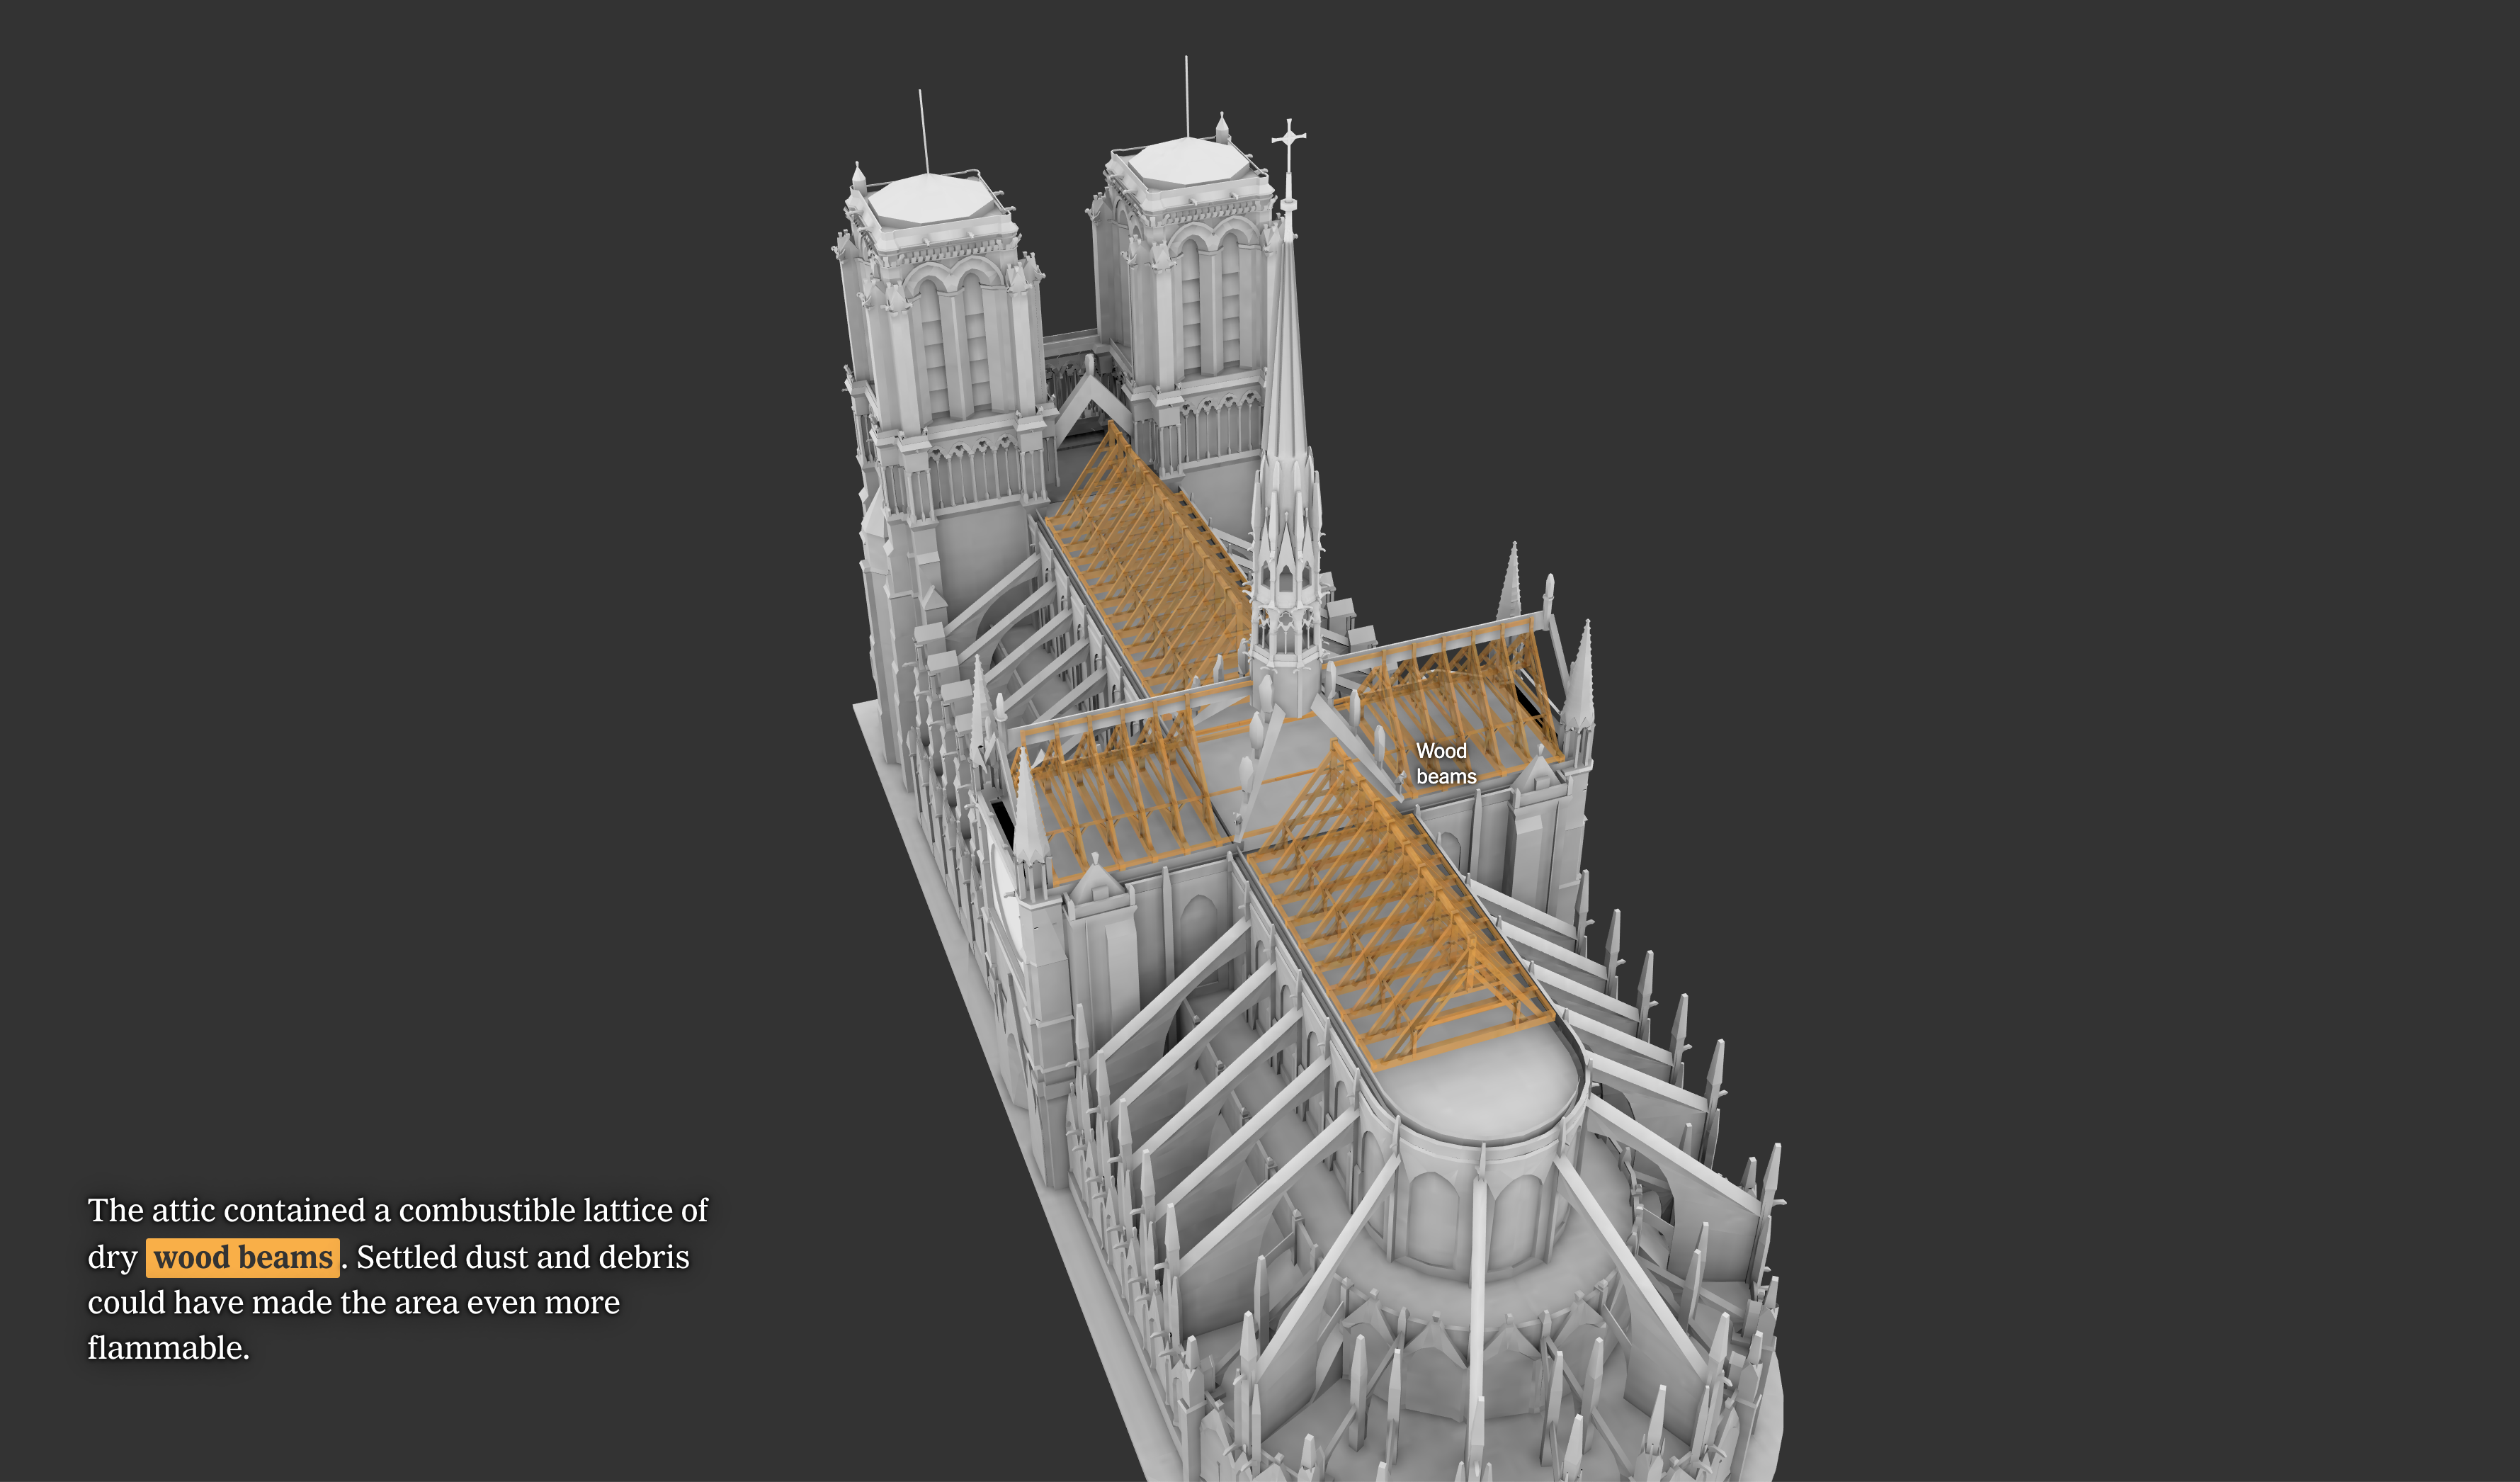
As the user scrolls through the piece, a 3-dimensional model reveals the key structural elements whilst text explains why that part is being focused upon in the story.

Wood beams do not make for preventative measures.

I do not know if the dramatic, black background helps. It might create contrast the designers deemed helpful against the light-coloured illustration. But that is probably my only real point to make about the piece. Otherwise, it is a very thorough and helpful guide to the architecture and how that helped the fire spread.

Credit for the piece goes to Larry Buchanan, James Glanz, Even Grothjan, K.K. Rebecca Lai, Allison McCann, Karthik Patanjali, Yuliya Parshina-Kottas, Jeremy White, and Graham Roberts.

The Fire at Notre Dame Cathedral: Part Deux

Yesterday I mentioned how there were few graphics detailing the fire at Notre Dame de Paris. Just give media organisations a day. The BBC published this piece about the fire. It includes, much like the Times piece from yesterday, an illustrative diagram detailing the key locations of the fire.

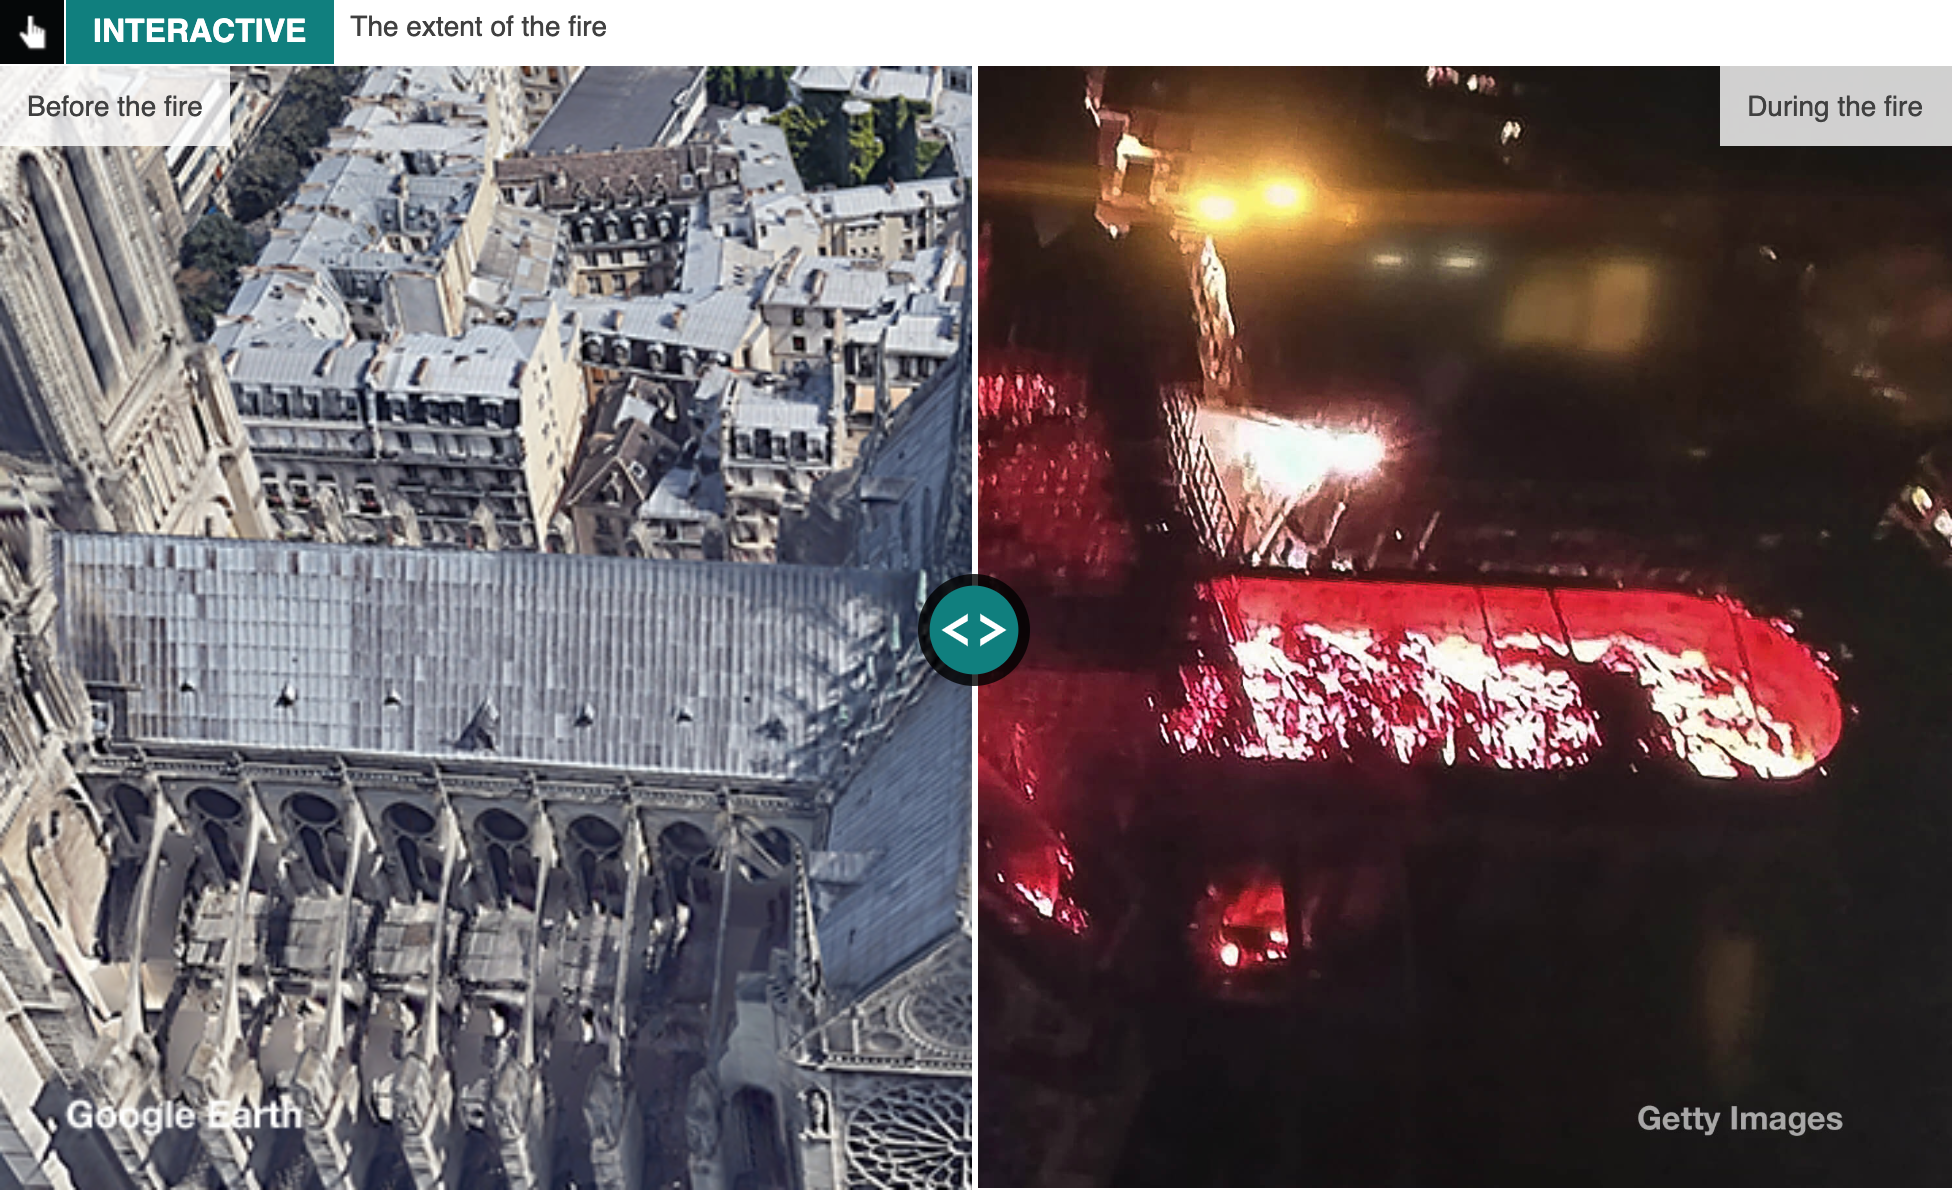
But the BBC piece goes a bit further and includes photo sliders like this.

The roof is on fire
The roof is on fire

It shows the extent of the fire burning away at the roof. (Amazingly, the stone vaulted ceiling below the roof contained most of the fire as the ground floor is nearly intact.)

Another slider looks at the appearance of the cathedral while photographs are annotated to provide immediate context of what the reader is seeing.

Overall, it is a very strong piece.

Credit for the piece goes to the BBC graphics department.

The Fire at Notre Dame Cathedral

This was not what I was going to write about today, but the news of the fire that ravaged Notre Dame yesterday rightly dominated the news yesterday and this morning. However, while I found multiple articles dealing with photographic evidence of the damage, I did not see many that detailed the fire from an illustrative or diagrammatic standpoint.

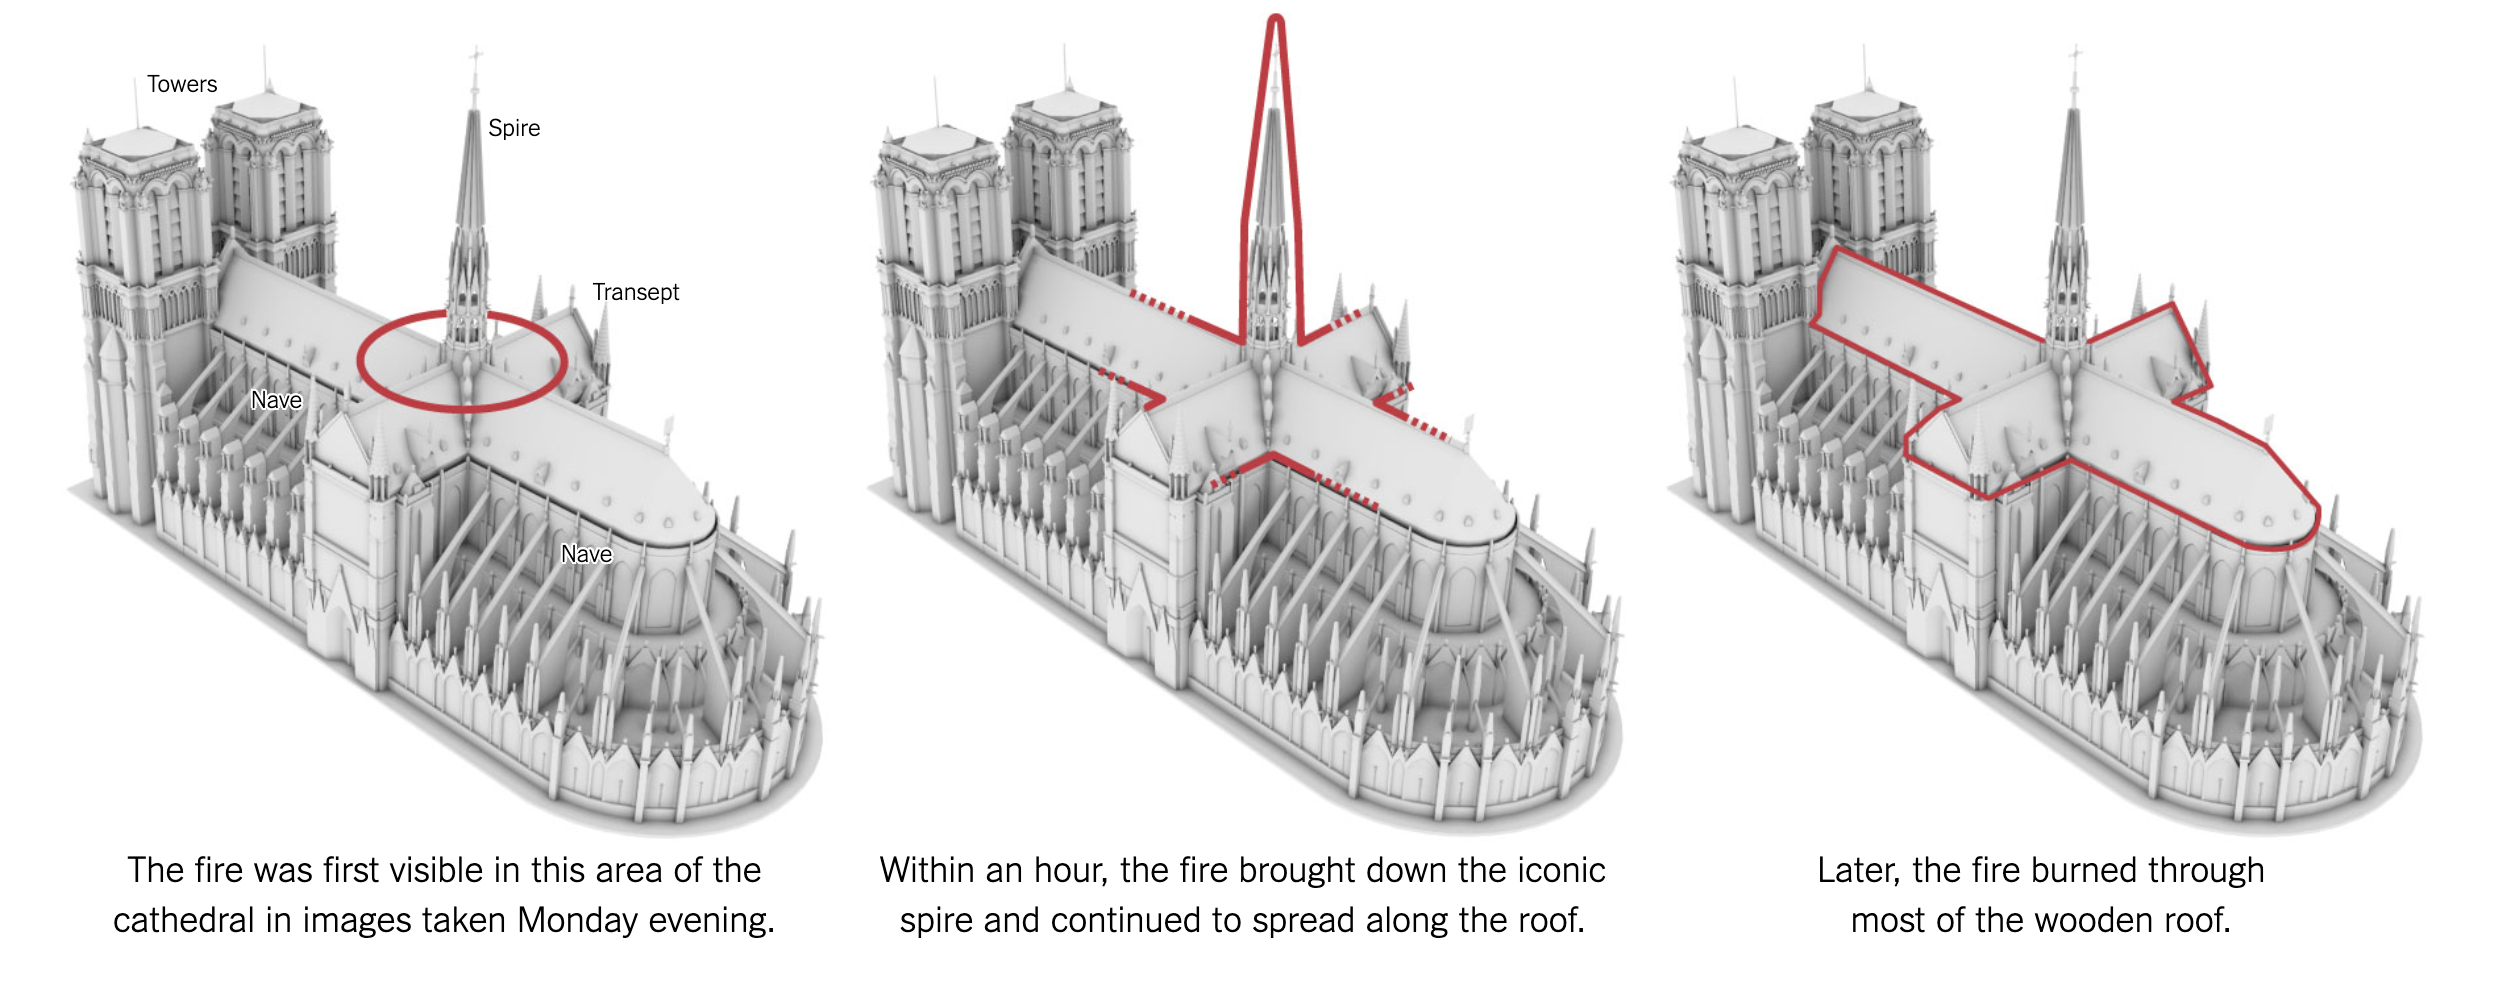
Thankfully, the New York Times did just that. They posted an article that deals specifically with the fire. It includes this set of small multiples that shows the progression along the roof and spire.

Unfortunately wood burns quickly

The article also includes a nice diagram explaining how the fire was focused on the cathedral’s attic. That explains some of the imagery from this morning that shows combustible materials like the pews and pulpit on the stone floor fully intact. And that provides hope the overall building can be saved, as French officials are indicating today.

Credit for the piece goes to Larry Buchanan, Weiyi Cai, James Glanz, Evan Grothjan, Allison Mccann, Yuliya Parshina-Kottas, Karthik Patanjali, Jugal K. Patel, Scott Reinhard, Bedel Saget, Anjali Singhvi, and Jeremy White.