Today is Friday.

Behold the awesomeness of Star Trek characters in pixel form, trexels. How many can you identify? I admit, I got a whole bunch. I shall admit no further.
Designed by John Martz with Koyama Press. Posting via Flowing Data.
Today is Friday.

Behold the awesomeness of Star Trek characters in pixel form, trexels. How many can you identify? I admit, I got a whole bunch. I shall admit no further.
Designed by John Martz with Koyama Press. Posting via Flowing Data.
Le Monde is a French-language publication and so I never really bother with it, despite favourable reviews. However, they do have a small site with some content in the English language that I check from time to time. Frequently they have maps or other graphics of some interest, and this time upon visiting—done to see if they have anything on Libya given the lead taken by France and the UK—they had a few maps of the situation in North Africa.
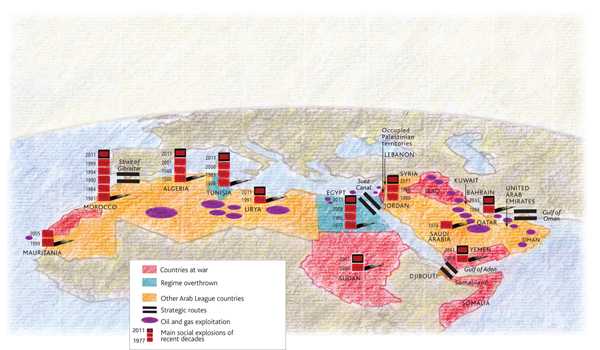
By and large, nothing radical or ground-breaking in the maps. But, the designer, Philippe Rekacewicz, used a different cartographic perspective than I am at least accustomed to seeing for infographics. And then the aesthetic of the map is interesting, and quite different than what one typically sees. In a refreshingly interesting way. Now, whether he used a texture or filter in Photoshop to create the background map or whether he physically drew the map (and then overlaid the informational elements digitally), it matters little as the style works. I enjoy the idea of mixing the hand-made and data visualisation—though it needs to be well-executed.
He created a few sets of maps; each makes use of a slightly different palette. These certainly help create the visual distinction necessary between data sets. The pie charts are not particularly helpful, but they at least are kept simple: looking at only two parts of the whole. The comparison within each nation by bar charts of internet connectivity and higher-education learning works. It begins to work not so well as one tries to compare country to country. Though, the separation of the bars into ten-percentage point sub-bars begins to alleviate that issue. The main map, that highlights the political situation does a nice job of putting these countries into broader context. That is, who has oil and who has control over the key waterways in the region.

All in all, a refreshing set of maps that illustrate the fluid situation in North Africa and the Middle East.
Two hundred years later, and the US Navy is again in action off the shore of Tripoli. Except instead of calling it the Barbary Coast, we now typically see the name the Maghreb. Things will surely be fluid and changing far faster than I can hope to detail in graphics, let alone follow casually. However, this here details what I have learned since this morning. Nothing too fancy, just mapping out some places to show just how far American, British, and French warplanes are flying to reach Libya. Then what aircraft are being used, at least that we know of, what ships are in the blockade and lastly who supported the Resolution 1973.
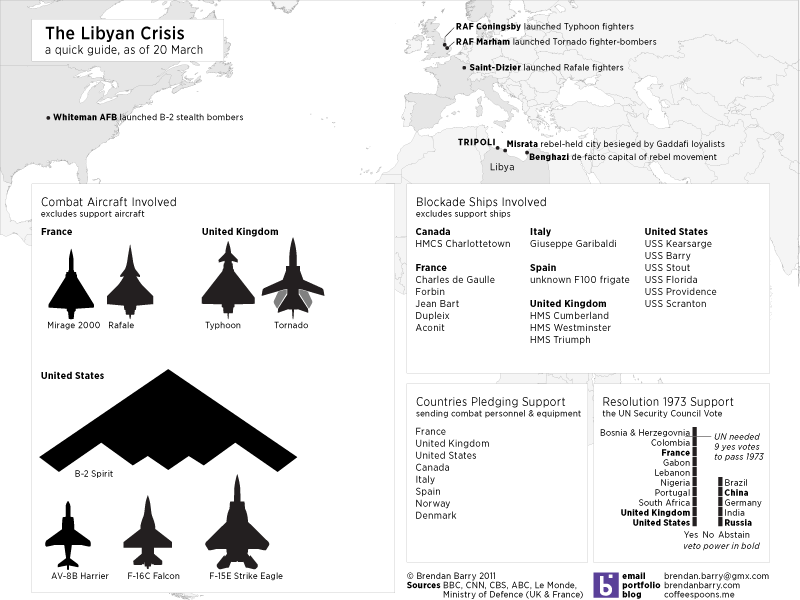
By Monday we shall surely be seeing further attempts by news and media agencies.
Valentine’s Day is a day both loved and loathed; I need not detail which groups feel which way. However, despite the dark history—think less hearts and love and more martyrdom and death—we have seen the lighter elements promoted by various causes from genuine love to commercial profits. But all things must have their symbols, especially if they are to be capitalised upon for profits, and we are now accustomed to Cupid representing love and Valentine’s Day. (One must wonder what the Christian martyrs would think if they learned that Valentine’s Day, once originally a Christian saint day, was now symbolised by a heathen, pagan god.)
Courtesy the New York Times, designer Ji Lee now, however, offers you not the staid and static symbol of love we have all come to know and love, but now a true choice of form and symbol. Which would you choose?
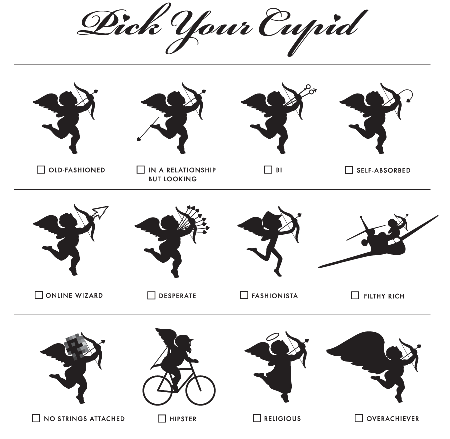
Personally, I have to go for the G5…
My co-worker, Ben, who is far more knowledgable about cars than myself, brought the following to my attention.
At the Consumer Electronics Show we always get to see the latest in cool, new, must-have toys. This year, however, a company called Fulton Innovations displayed a proof-of-concept, wireless charging-station for electric vehicles. And while one must wonder about the conservation and inefficiencies of such a powering station, Fulton provided information on just how efficient their system would be. In the form of graphics.

And by and large, they are not bad. Yes, yes, the pie charts could be substituted for something else. But, I do like linking the colours in the pie chart to the parts in the power-system located in the diagram of the car. They help to explain just where exactly the inefficiencies in the system are to be found. And by providing the base of the plugged-in car, they also allow one to compare the two methods of wireless charging to that of plugging the vehicle in.
I appreciate that people will want scary graphics given the upcoming holiday.
But like many other things in life, that does not mean I want to actually see them. Alas, this comes from the BBC on an article about the holiday’s growth in the United Kingdom.
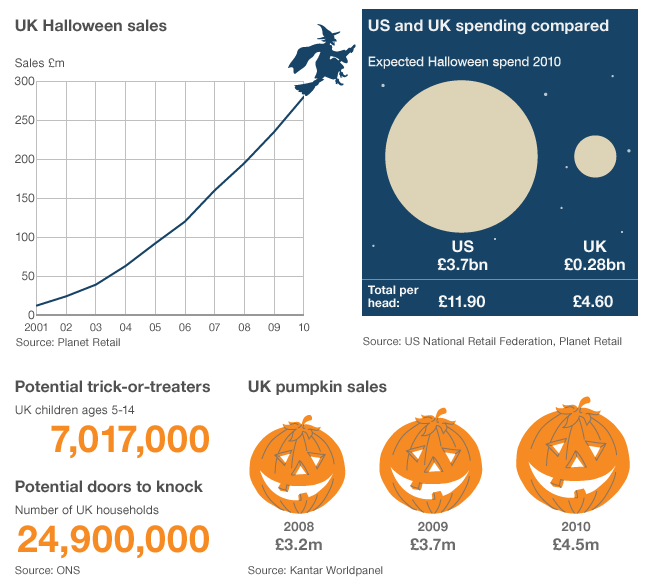
Need I count the ways?
from XKCD

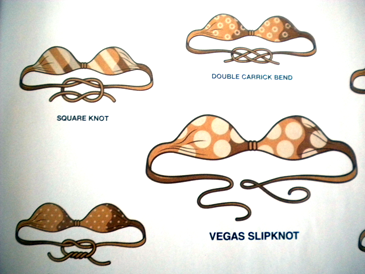
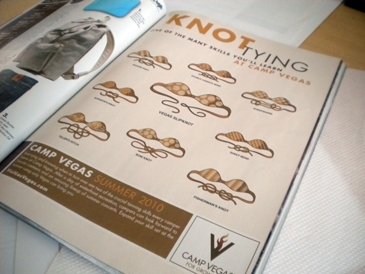
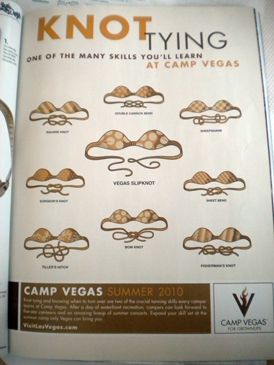
Courtesy of Feras, this is from the magazine Complex that was the light entertainment for the office this day. It is, of course, an advert for Las Vegas. But in a magazine apparently aimed at men, this felt like a good Friday evening, i.e. pre-bar or other, mixed-gender, social outing, information graphic to share.
My post is inspired by a post on FlowingData a few days ago. FlowingData’s post is about a diagram of coffee recipes and it interests me on a personal level. For long before ever designing anything professionally, I was a barista. Over three and a half years of my life were (somewhat) dedicated to crafting coffees, espressos, and on the rare occasion, tea. We used Starbucks’ recipes—and on several occasions I commented about the graphics and diagrams they sent so baristas could all be making the same drink. I may have even kept a few…but that would require some digging through some really old collections.
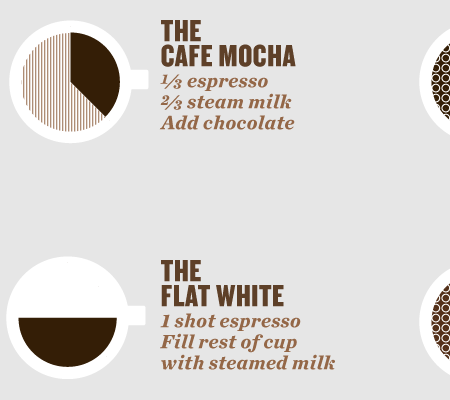
However, Plaid Creative made something for me. Well, me in the sense that I would like to talk about it here and now, not really for me. They created a diagram to explain the various recipes for coffee and espresso-based beverages. I am especially fond of the inclusion of Irish whiskey. However, FlowingData’s post comments upon how Plaid’s piece is in some sense an update of an earlier chart by Lokesh Dhakar, found here. (Update: So that link to Lokesh’s work is broken, here’s a link to it courtesy of The Babble Out.)
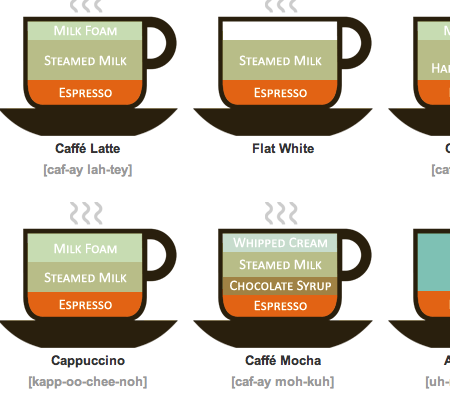
So how do these two compare?
First, keep in mind that Plaid’s is much more extensive in terms of the number of recipes examined and the number of ingredients used (or suggested). For while Dhakar’s piece uses a consistent and simple colour scheme that relates well to the subject matter, Plaid addresses the breadth of its recipes by introducing patterns and so allows for the colour scheme to still relate to the subject. I like the idea of patterns, and here they work in differentiating between the ingredients. However, it took me a little while to make sense of them all and I wonder if a small legend would not have been helpful. Or even just labelling the colours and patterns when each first appears.
However, the one thing I find most interesting about the two pieces is that Plaid represents the drinks as multiples of pie charts. The proportions of ingredients are thus wedges or slices of said pie. Dhakar’s piece instead keeps the cup form and shows the proportions as layers. (And what is noticeably helpful is that the sides of the cup are straight, making comparisons easier than they might otherwise be in cups with fancy, curving sides.) And while I prefer the aesthetic of Plaid’s piece, that Dhakar chose to show proportions as layers allows him to also show the order of events.
From personal experience, the order of events can actually impact the flavour of the drink. And to be honest, I am not certain that Dhakar intended to show order of events—for the mochas I made always started with the mocha first. But the system he used to show the drinks would theoretically allow for that element in the actual graphic. Plaid’s would likely have to have the order of events be written explicitly; the only other option is to order the arrangement of the pie wedges, but I am not certain that doing so would be as easily assumed as pies are normally ordered by value, here the proportion amounts, if ordered at all.
Both, however, do help the average Joe enjoy his, well, you know as increasingly create more and more complicated versions and variations. And in that sense, both are successful and entertaining pieces. If one, however, were to try and use either as a more educational piece in a true recipe-like sense, than I find Dhakar’s piece to the more successful of the two.
Either way, I still do not like coffee.
Computer: tea, Earl Grey, hot.
A brief bit of background before I begin, a few months ago, a South Korean warship, a corvette, was sunk in waters claimed by both South Korea and North Korea. And technically speaking, the Korean War has never ended and the two countries remain at war. An independent commission studied the situation and determined that a North Korean submarine sank the ship with a torpedo. It did not help North Korea that North Korean markings were found on the remnants of a torpedo not far from the submerged wreckage.
Regardless, North Korea claimed innocence and the case went before the United Nations. The UN expressed, per usual, its toothless displeasure at the entire affair and everything has since sort of faded away—at least here in the United States it has. However, apparently somebody has smuggled a poster out of North Korea that hints at responsibility. According to the article, the text in the poster reads “If they attack, we will smash them in a single blow”.
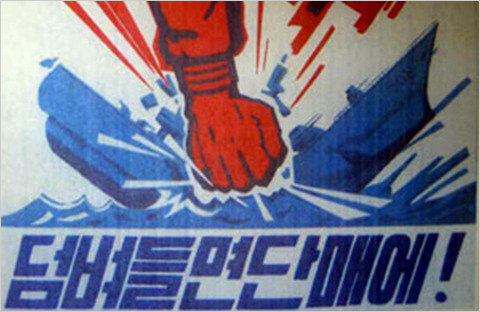
photo uncredited, via the New York Times
I just found it fascinating that in 2010 we can still see good, old-fashioned propaganda posters. Even if we can only get them smuggled out of North Korea.