Killed in Action in Iraq, State by State

The Iraq War is over. And now it is time to reflect on what we have gained and what we have lost. This map by the Guardian details the number of soldiers killed in action in Iraq. (Other options include total wounded, killed by non-hostile, &c.)

Killed in Action in Iraq by State

Unfortunately, I call it a ‘no kidding’ type of map. The data, accessible via the Guardian here, corresponds nicely with a list of states by total population. Of the top ten countries in KIA, only Virginia is not among the top ten in population; it is 12th. The country thus not in the top ten in KIA, but in population is North Carolina. It’s rank in terms of KIA? 11th.

The data is interesting and worth depicting if we are to reflect. But, perhaps a more suitable visualisation could have been chosen.

On a personal note, these Google Maps overlays are annoying when, in the cases of, e.g., Wisconsin and Massachusetts, the shapes are incorrect. Perhaps coastlines are not as easy as states with ‘straight lines’ for boders, but we would do well to try and make irregular coasts at least somewhat correct.

Why the Riots?

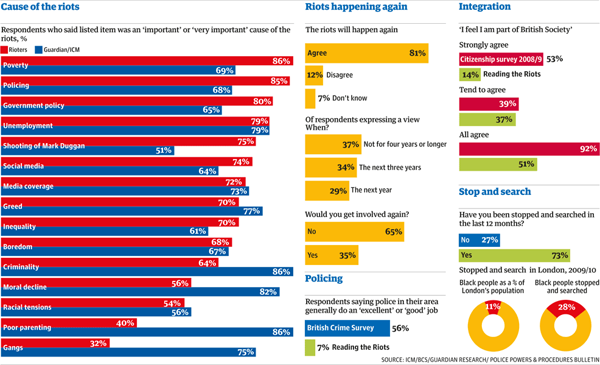
The riots in the UK earlier this year prompted questions about British society and the causes behind the riots. The Guardian has been reporting on different elements of the riots for some time now and has released the results of their work on discovering those causes. And naturally, survey results should be visualised for more awesomeness.

Surveying Rioters
Surveying Rioters

The discrepancies between the causes should be interesting. However, the number of bars and their tight spacing along with contrasting colours makes me wonder if the chart would be more effective not if it plotted the value of the responses, but rather the value of the difference in the responses.

Exporting the Sun

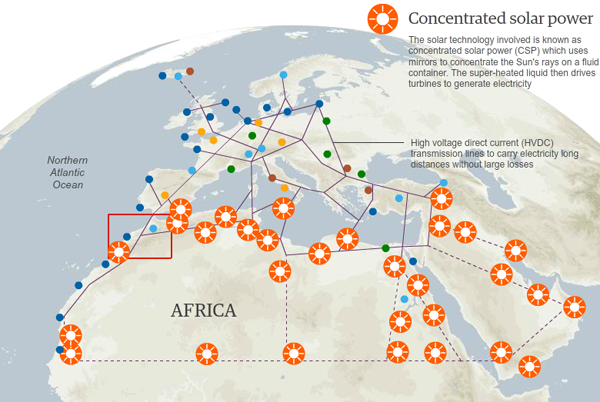
Plans are afoot to harness the power of the sun in the deserts across northern Africa. The electricity generated in Morocco is planned to turn on light switches in Madrid and throughout the rest of Europe.

The Guardian created a map to show how the solar facilities could be connected to each other and to other renewable power sources in Europe—from Icelandic geothermal plants to North Sea wind turbines to Alpine hydroelectric plants.

Renewable Power Map
Renewable Power Map

Credit for the piece goes to Christine Oliver.

The Bottom of the Ocean (and the World)

There have been a lot of interesting maps of late that map out continents and planets, but today is one for the sea—the bottom of which we know less about than the surface of the Moon.

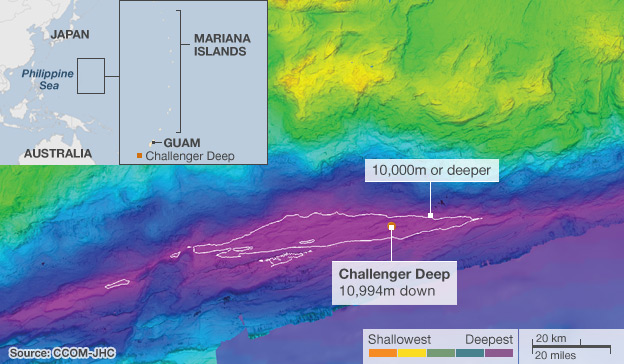
According to a story covered by the BBC, the US State Department backed an exploration of the Mariana Trench, a subduction zone where one oceanic plate is slipping underneath another. The result is an inward-folding crumple and then a bunch of volcanos—the Mariana Islands. The US wants to know if it can extend its economic zone further, but can only do so if certain geographic conditions are met. Hence, the study.

The topography of the Mariana Trench at Challenger Deep

Challenger Deep is the deepest, lowest point on the planet. Though one can argue that because the Earth is not a perfect sphere, points in the Arctic and Antarctic may yet be deeper/nearer the centre of the Earth. If one were to Mount Everest, the tallest mountain on the planet, inside the Mariana Trench at Challenger Deep, the very tip of the mountain would still not break the surface of the ocean.

Returning to Fukushima. Someday.

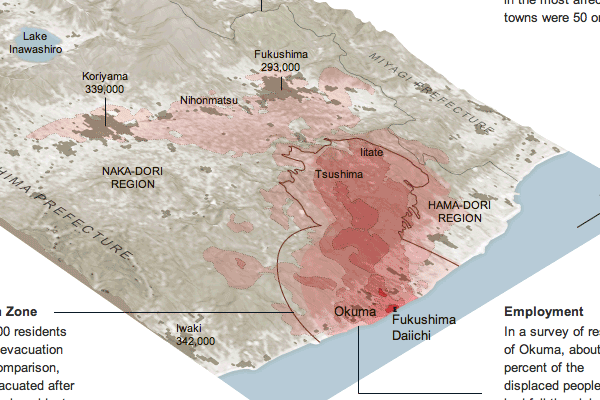
Earlier this year, the earthquake and tsunami that damaged Japan also brought about failures in a nuclear plant at Fukushima. As we near the end of the year, the New York Times reports on how it might take many years for those who had to—or chose to—move away to return to a safe Fukushima.

Radioactive Contamination

Technology Today

Technology changes and changes rapidly. The United States led the way with cabled phone networks. Now, countries in Africa are skipping landlines and moving straight to mobile phones. The New York Times has an piece on the changes in technology and accompanies that piece with small multiples of choropleth maps that showcase different technologies and their prevalence.

Mobile Phone Subscriptions

What is interesting about these maps is that the Times eschewed the conventional Mercator or Robinson map projections and went with a slightly more unusual layout. But, a layout that saves some space by its contortion of the world’s oceans. Was their reason spatial or something more about maintaining consistent area? I would be curious to see the piece in print to see if it needed to fit a narrow column.

All in all, an interesting set of maps.

We Want to (Quell a) Riot (with Military Grade Hardware)

The New York Times had a piece in the Sunday paper asking whether American police have gone military, especially in the wake of the images of the police response to Occupy Oakland and Occupy Wall Street with police/troops deployed in tactical body armour, armoured vehicles, &c. The Times piece was accompanied by an Op-Art piece that took three key protests and illustrated the type of police officer responding to the unrest.

Evolution of Riot Gear

Credit for the illustration goes to Chi Birmingham. The title of this post comes from a British publication about the Brixton riot of 1981 where an individual was asked about why he was rioting was quoted as saying “We want to riot, not to work.”

Campaign Ad Spends

I don’t know about you, but to me, it’s beginning to look a lot like campaign season. At least from what I read on the internet. Because, according to this interactive piece by the Washington Post, there has been little local campaign spending on ads in the Chicago television market.

Mad Spending
Mad Spending

By clicking on the left, you are able to see the spending amounts and spending places of ads by both personal campaigns and interest groups. For national ad campaigns, there is a small outline of the continental US in the bottom left.

Above the map you have some facts about the spending and spending over time and a curious bit about whether the ads are positive or negative. Already if you move from the beginning to now, you can watch the positive ad number slip.