Delco vs Chesco

One of the things in the pop culture these days is an HBO show called Mare of Easttown. For those that haven’t heard of it, probably my more international audience, it’s a crime drama set in the near suburbs of Philadelphia, a placed called Delaware County that locals simply call Delco.

Last Saturday, the show got its limelight on Saturday Night Live, which spoofed the show in a trailer for a fictional show called Murdur Durdur, from the producers of Mare of Easttown as well as those of It’s Always Sunny in Philadelphia.

The SNL skit included a crime map of which I took a screenshot.

I can see my house from here. Dur.

This caught my attention because one of the characters mentioned Downingtown, which is where your author grew up until he was 16. SNL‘s map really just served as a vehicle to showcase Googling all the town names—and the Philadelphia region has a wealth of them—because the map is all over the place, pun intended.

Conshohocken is actually a real place in neighbouring Montgomery County, on the Schuylkill River (real place). Royersford is also real and also in Montgomery County. Hockessin is also real, but is in Delaware, the state, not Delaware County, which is in Pennsylvania. (Both border the Delaware River.)

The map also makes reference to Lionville, a real place near Downingtown. Your humble author worked in a restaurant in Lionville, located in Uwchlan Township. (They don’t mention that, but I can see people enjoying that name as well.)

The keen observers will also note the placement of a label for Altor, which is only about 2.5 miles from my aforementioned childhood home. Clearly some SNL writer is from or is incredibly familiar with the western suburbs of Philadelphia.

As for the map itself? Well, it’s fictional. One, there is no Jagoff Bridge. Two, it’s actually a map of Bethlehem, to the north in the Lehigh Valley. Route 30 is a real place and does run through Downingtown and Chester County. But nowhere does it cross any town or city like the one the map depicts. Instead that road is Route 378 crossing the Lehigh River. (Fun fact, Route 30 runs west and eventually through Indiana and Illinois, south of Chicago.)

In fact the funny thing is, the map spoofing the show set in Delaware County does not contain a single place in the real Delaware County. Easttown is, for fans of the show, not actually located in Delaware County. Instead, it’s in Chester County. And your author, not surprisingly perhaps, has connections there because it’s where you can find Devon and Berwyn. (My Chicago readers may recognise those names, as several streets were named for Main Line towns.) And where I attended middle- and high-school is across the street from Easttown Township. The real one.

Now I want to actually watch the show. The real one. Not the SNL one. But first I’ll need to grab a Yuengling and a Wawa hoagie.

Credit for the piece goes to probably the writers and props department of Saturday Night Live.

An Illustrated Guide to the Deaths in Game of Thrones

Did something important happen yesterday in the news? We’ll get to it. But for now, it’s Friday. You’ve made it to the weekend. So sit back and binge. On gin or Game of Thrones, whatever.

Last Sunday the hit HBO show Game of Thrones returned for its final series. I did not have time to post about this piece then, but thankfully, not much has changed.

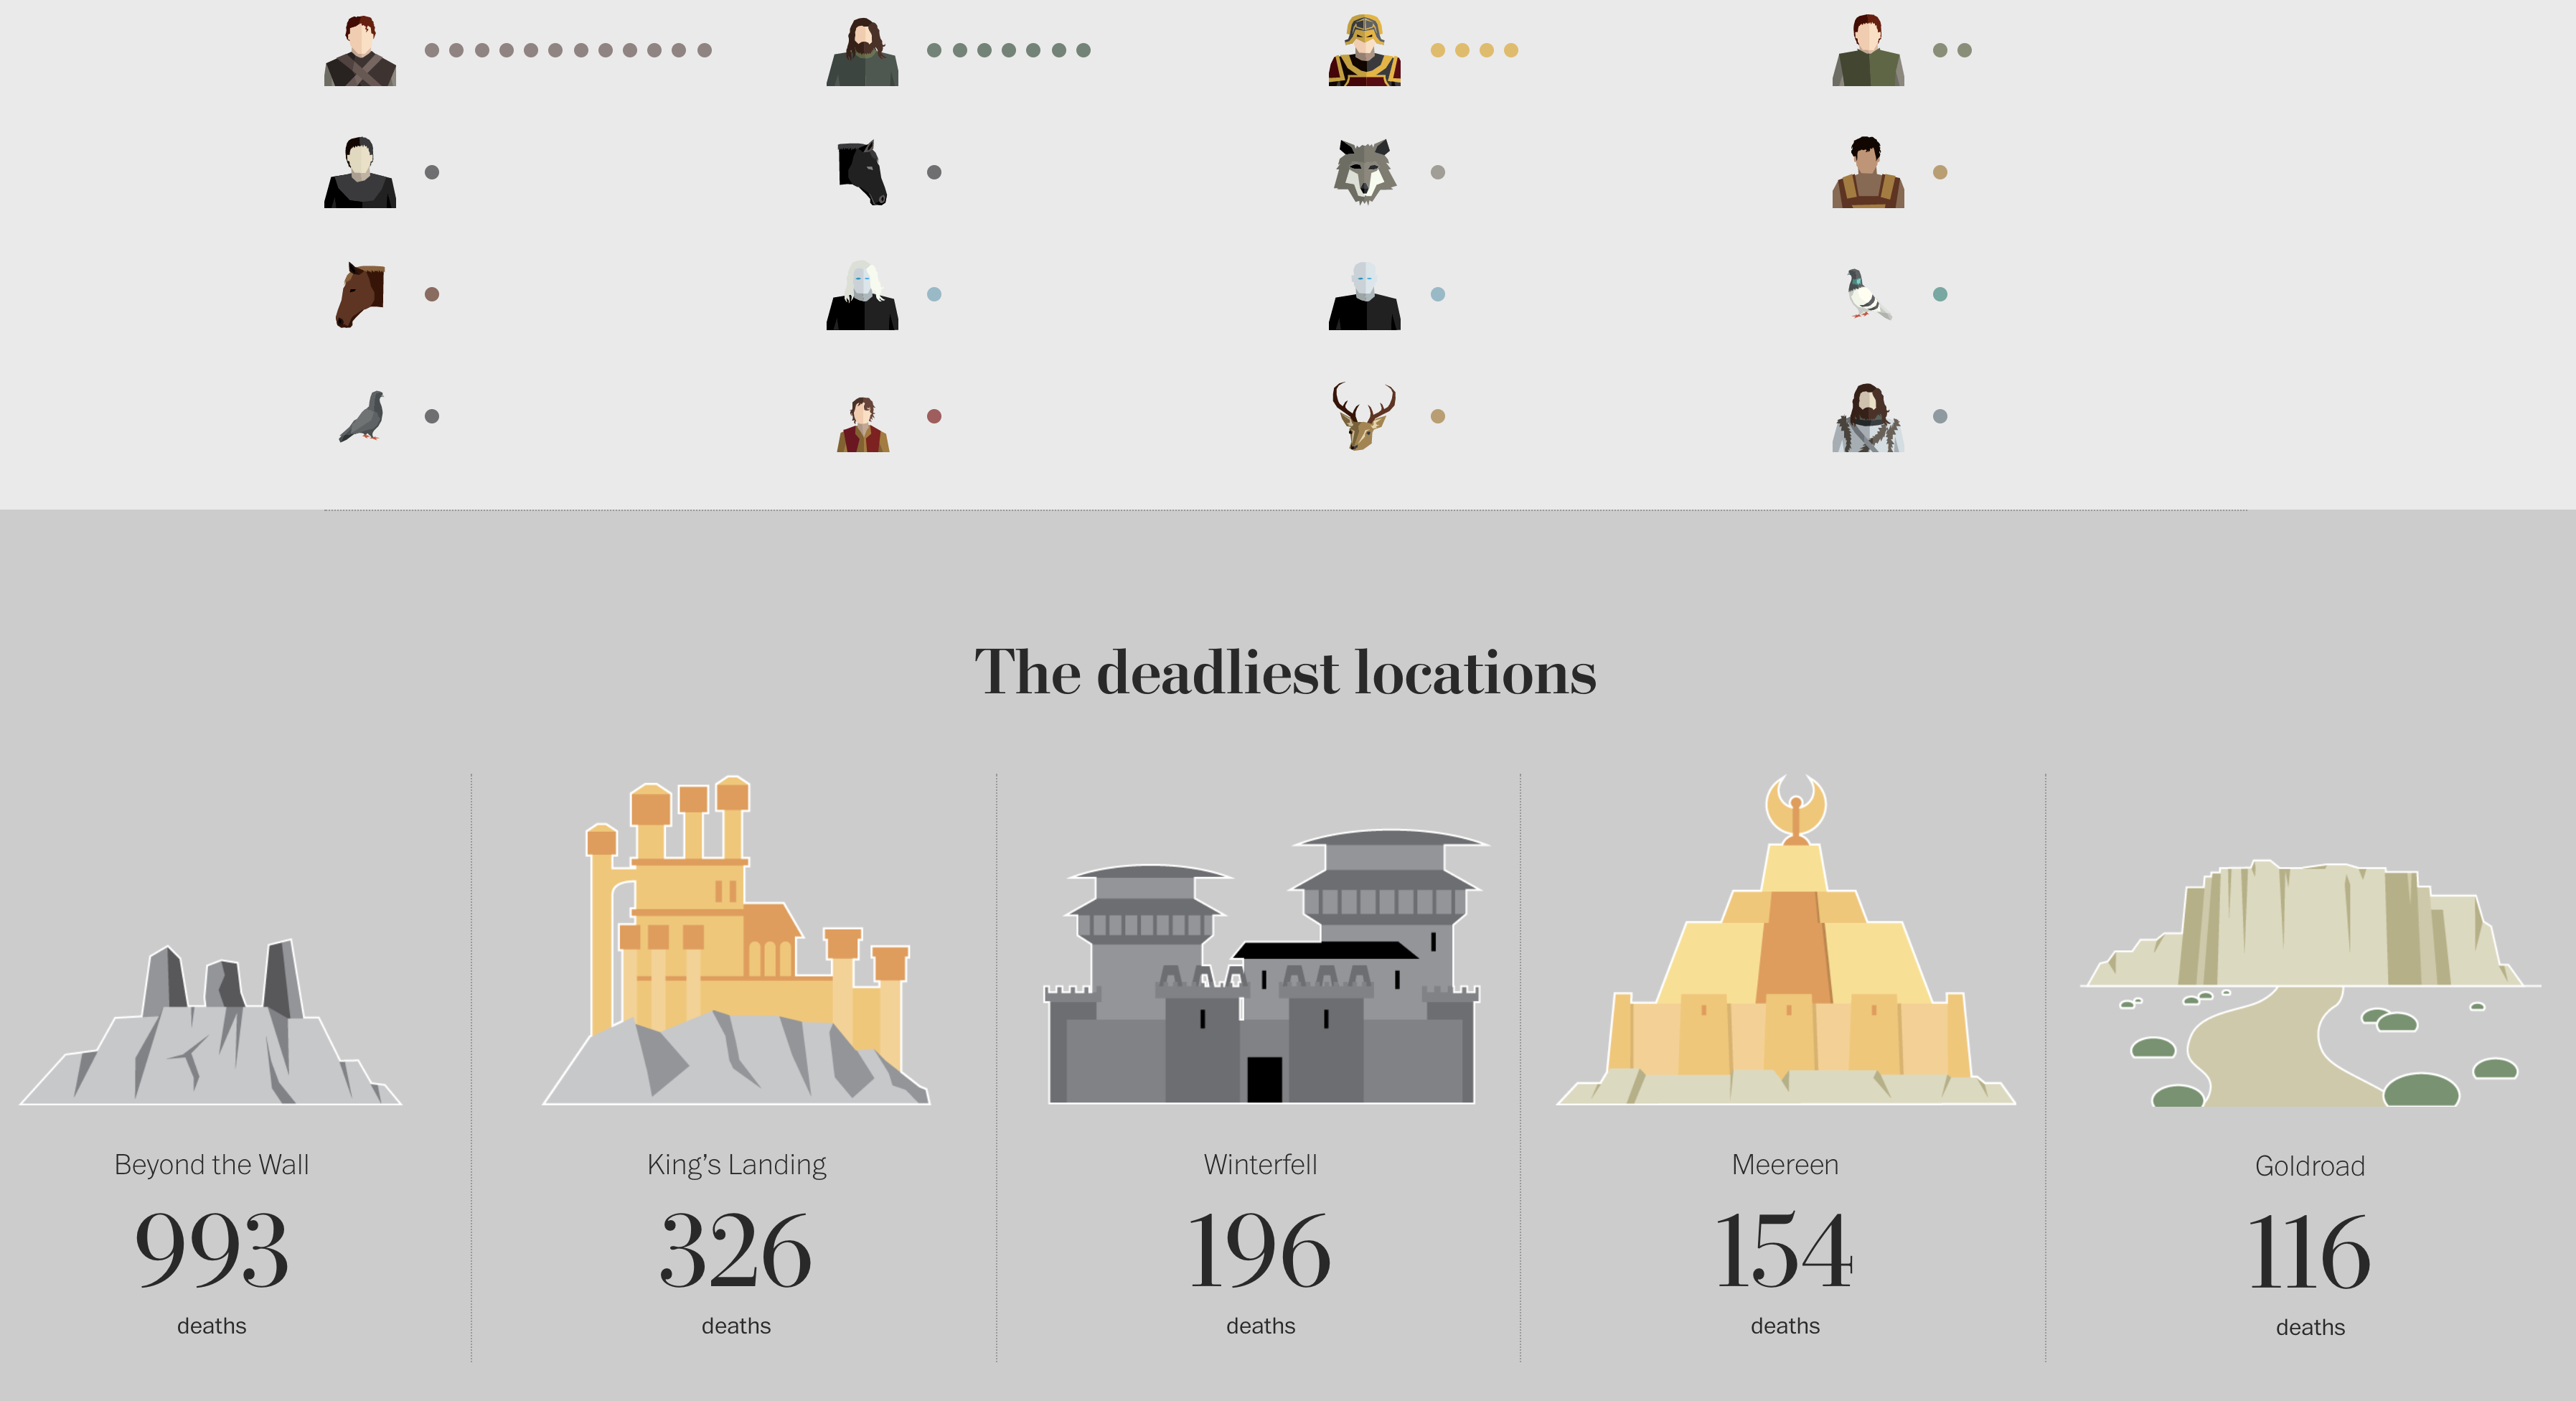
It details all the on-screen deaths in the show. (Spoiler: a lot.) It includes the series in which they died, the manner of their death, who killed them, and some other notable information. Remarkably, it is not limited to the big characters, e.g. Ned Stark. (If that is a spoiler to you, sorry, not sorry.) The piece captures the deaths of secondary and tertiary characters along with background extras. The research into this piece is impressive.

Don’t worry, if you haven’t seen the show, this spoils only some extras and I guess the locations the show has, well, shown.

Don't go beyond the Wall
Don’t go beyond the Wall

Thankfully, by my not so rigourous counting, last week added only four to the totals on the page (to be updated midway and after the finale).

In terms of data visualisation, it’s pretty straightforward. Each major and minor character has an illustration to accompany them—impressive in its own right. And then extras, e.g. soldiers, are counted as an illustration and circles to represent multiples.

For me, the impressive part is the research. There is something like over 60 hours of footage. And you have to stop whenever there is a battle or a a feast gone awry and count all the deaths, their manners, identify the characters, &c.

Credit for the piece goes to Shelley Tan.

How to Choose the Match to Broadcast

I was reading the Sunday paper yesterday and whilst I normally skip the sports section, especially during baseball’s offseason, this time a brightly coloured map caught my attention. Of course then I had to read the article, but I am glad that I did.

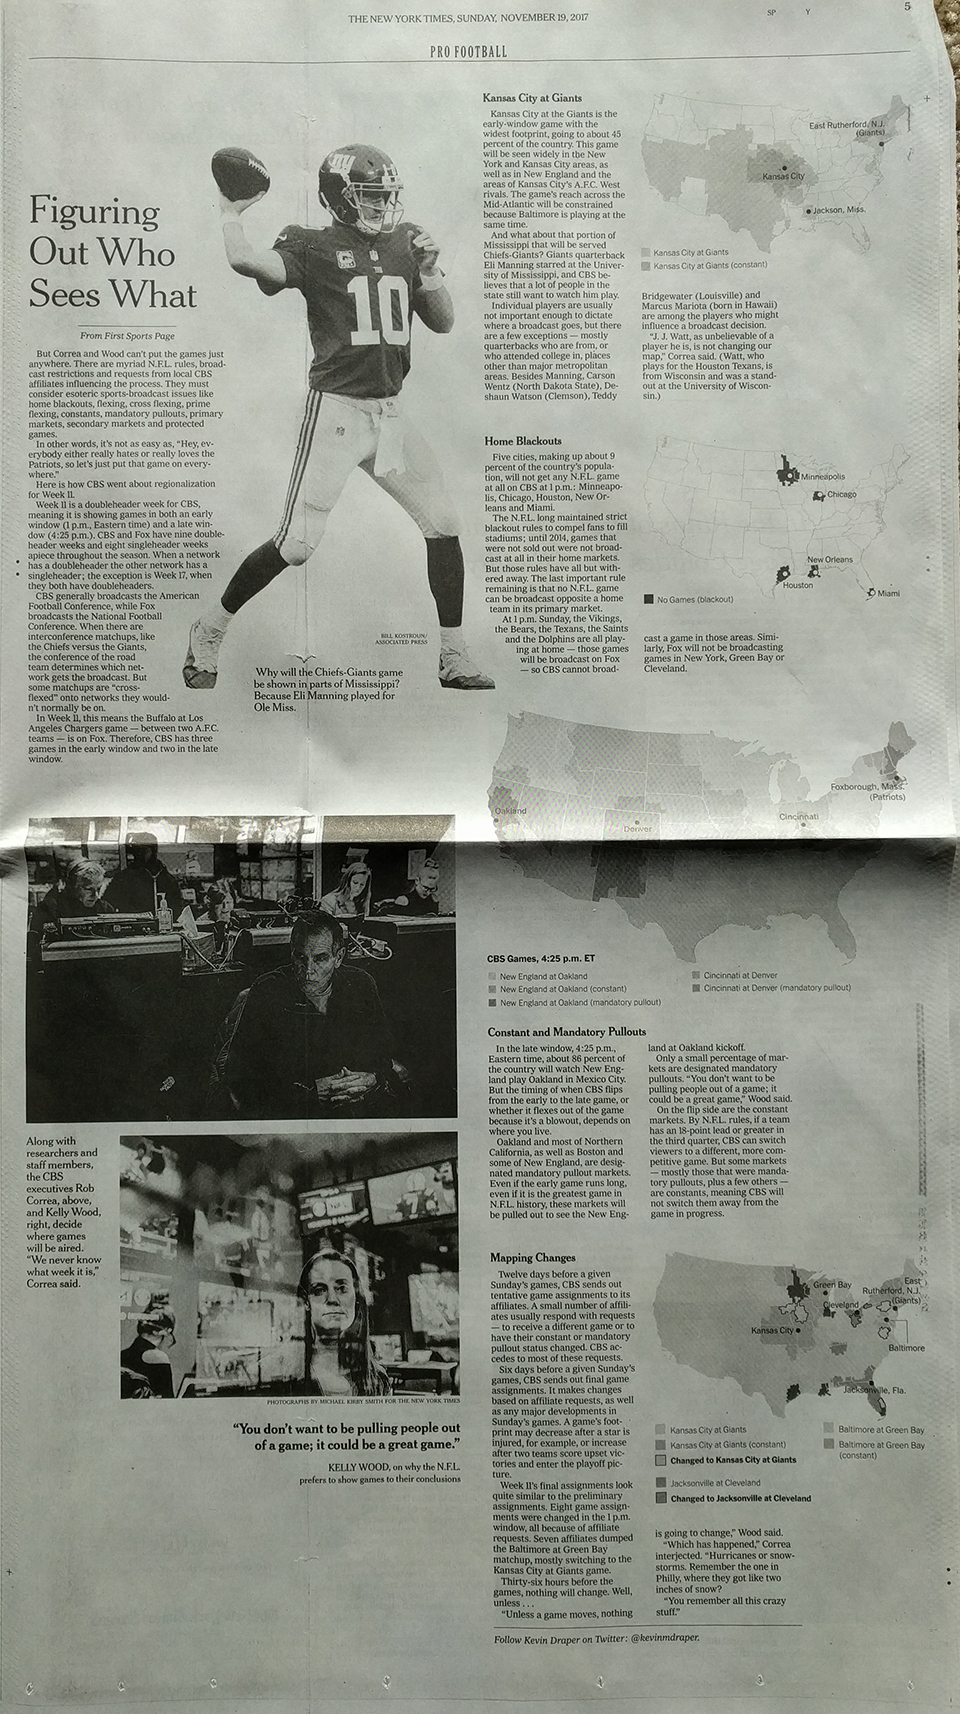
On Sunday the New York Times ran a print piece—I mean I assume I can find it online (I did.)—about CBS chooses which American football matches to air in the country’s markets. It is a wee bit complicated. And if you can find it, you should read it. The process is fascinating.

But I want to quickly talk about the design of the thing. Remember how I said a map caught my attention. That was pretty important, because the map was not the largest part of the article. Instead that went to a nice big photo. But the information designer I am, well, my eyes went straight to the map below that.

The story dominated the section page

There is nothing too special about the map in particular. It is a choropleth where media markets are coloured by the game being aired yesterday. (The piece explains the blackout rules that changed a few years ago from what I remember growing up.)

But then on the inside, the article takes up another page, this time fully. It runs maps down the side to highlight the matches and scenarios the author discusses, reusing the same map as above, but because this is an interior page, in black and white. It probably looks even better online as they likely kept the colour. (They did. But the maps are smaller.)

To have that much space in which to design an article…

Overall, I really enjoyed the piece and the maps and visuals not only drew me into the piece, but helped contextualise the story.

Credit for the piece goes to Kevin Draper.

O’Reilly’s Out

Of all the things I expected to cover this week, this was not one of them.

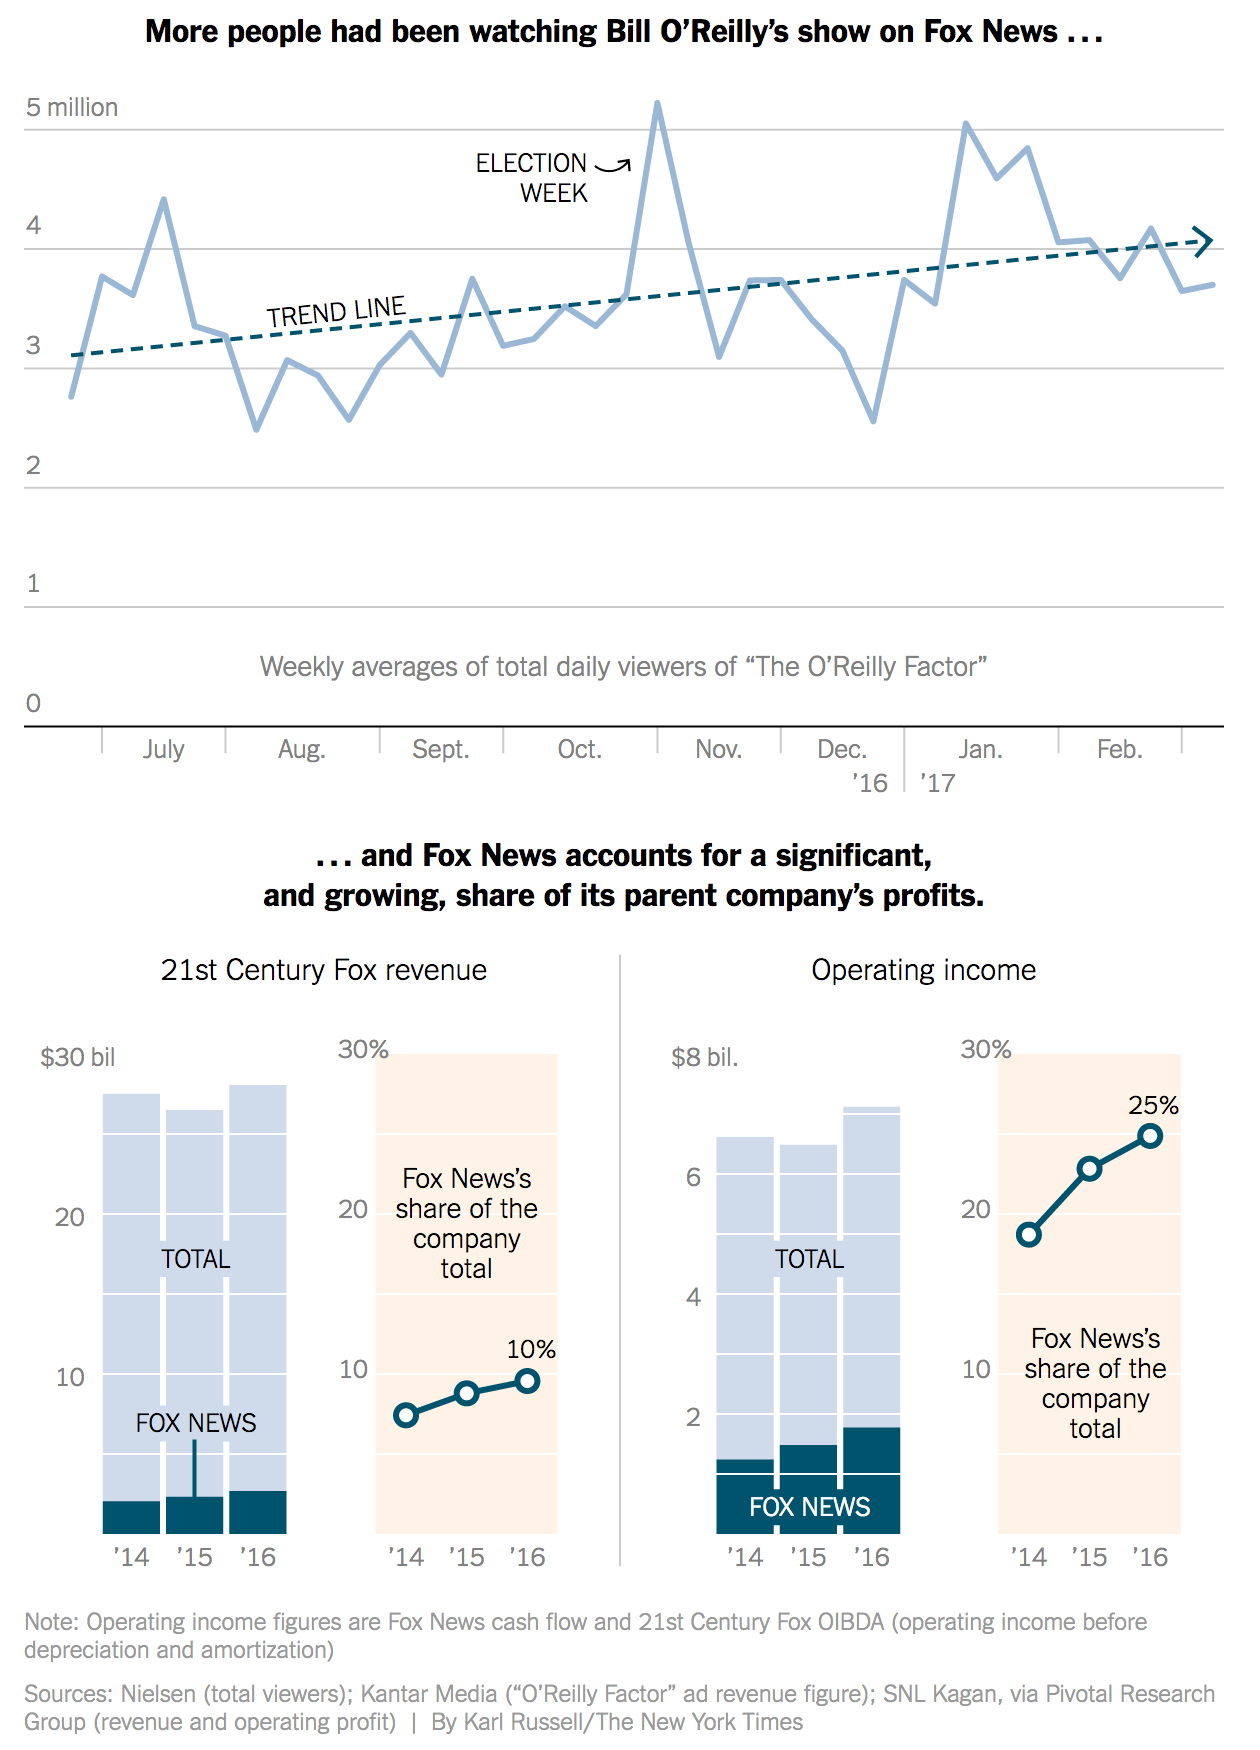
This is Fox New’s firing of Bill O’Reilly, their lead personality and heaviest hitter for the last 21 years, for accusations of sexual harassment both externally and internally. But up until yesterday afternoon, just how important was O’Reilly to Fox News? Well, as you might guess somebody covered just that question. The New York Times addressed the question in this online piece and uses a nice graphic to buttress their argument.

What goes up must eventually fall down

I like the use of the longer time horizon across the top of the graphic. But most important in it is the inclusion of the trend line. It helps the reader find the story amid the noise in the weekly numbers. The big decline towards the end of December looks important until one realises that it probably owes the drop to the Christmas holidays.

Then the bottom piece does something intriguing; it shows both the actuals and percentages side-by-side. Typically people love stacked bar charts—by this point you probably all know my personal reluctance to use them—and that would be that. But here the designer also opts to show the share as a separate data point beside the stacked bar charts.

I think the only thing missing from the piece is a bit more context. Is O’Reilly still the heaviest weight in the lineup? The top chart could have perhaps used some additional context of other shows over the last few months. For example, how does O’Reilly compare to Hannity?

Regardless, this piece does a fantastic job of showing the until-yesterday increasing importance of O’Reilly to Fox News and then Fox News’ importance to 21st Century Fox.

Credit for the piece goes to Karl Russell.

Twitch.tv

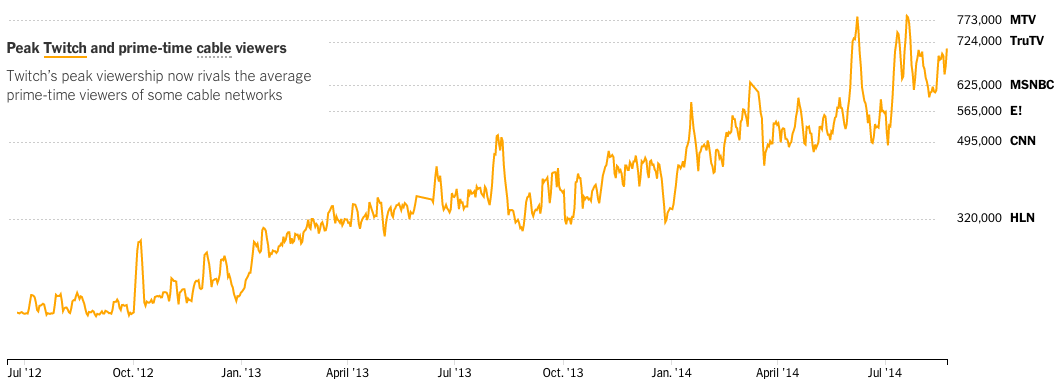
Twitch.tv is a site where people can go to watch streaming video games. While it is not quite my thing, it is a thing for enough people that Amazon bought the site. The New York Times took a look at Twitch’s popularity.

Twitch viewership
Twitch viewership

Credit for the piece goes to Gregor Aisch and Tom Giratikanon.

Cutting the Cable

We have all heard talk about cutting cable, i.e. unsubscribing from cable television. But the question is what is replacing it if anything? Fortunately, this really nice graphic produced by Quartz shows the market over the course of the last five years.

Cutting the cable
Cutting the cable

It is a really nice use of small multiples and the power of not overlapping size and growth charts, or combo-charts, just because you can. Different metrics deserve different charts. The important part is placement, and that’s where a good designer can make sure to place relevant data near its partner.

Credit for the piece goes to Ritchie King.