Much Improved Mapping of American Migration

Forbes released Jon Bruner’s latest map of migration in the United States. It uses IRS figures to show inbound and outbound movement from counties across the United States. The work itself is an improvement from his map from last year, which was a bit more difficult to read. Beneath is the new version, and at the end, for comparison, the old.
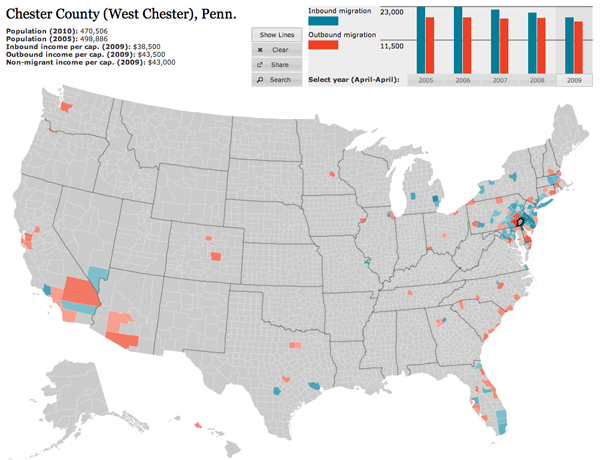
This year's migration map

Firstly, the colour palette is far more sophisticated. Secondly, and most crucially, the user can hide the lines on the map, which obscures a key part of the story of migration in urban areas—higher income people moving out of the city and into the suburbs. Thirdly, the map data now includes additional years, which are available by clicking the small chart in the upper right—a welcome addition that allows the data from last year’s map to become accessible this year. Fourthly, and to be fair this may have existed previously but not that I can recall, the new map is accompanied by essays.

These essays use the map and its data to tell stories and explain what one sees going on with the data. It is (relatively) easy for one to put together a piece of data visualisation from a data set. But, without knowing where to look, users may not actually find anything valuable in the visualisation. By pointing to these essays, the map—already much improved from a design perspective—takes on a much more rounded and mature character and becomes more about generating information and knowledge than simply figures and statistics.
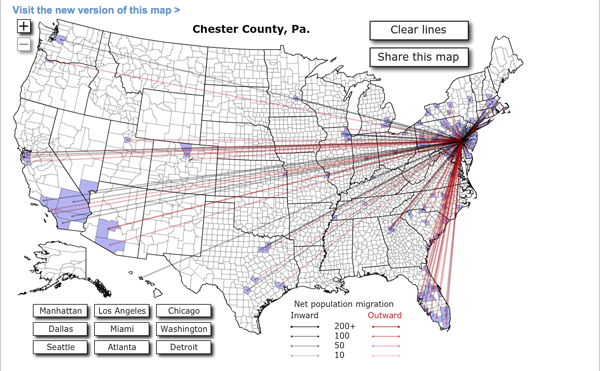
Last year's migration map

Income Segregation in the Philadelphia Metro Area

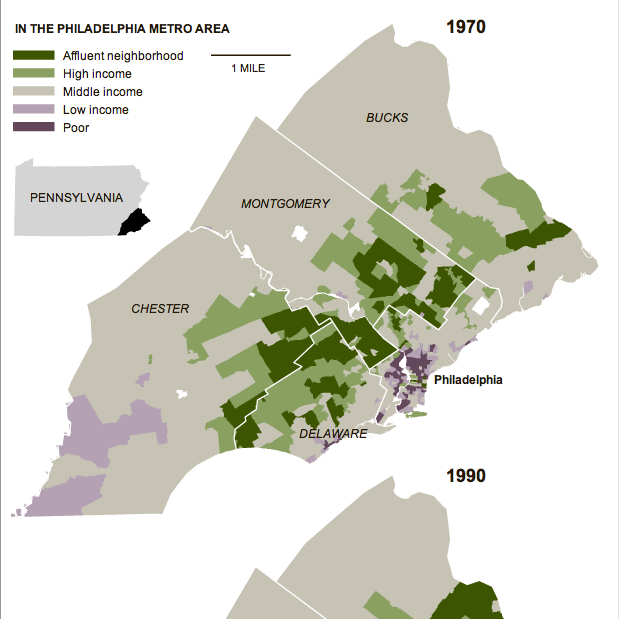
In an area very close to me…quite literally…the New York Times published an article about increasing segregation between the rich and the poor via the areas where they live. The study by Stanford University found that the Philadelphia metropolitan area saw the “sharpest rise” in segregation since the 1970s—the study used census data available through 2007. The accompanying graphic highlights the growth of the segregation from 1970, using small multiples of choropleths to compare 1970 to 1990 to 2007.

In 1970, much of the metro area was middle-income neighbourhoods. Certainly, the central core of Philadelphia was depressed. So too was Chester and rural southwestern Chester County. The upper-income neighbourhoods were in the close suburbs, note the townships stretching due west of the city and you see the Main Line, one of the most affluent areas of the United States, while other veins of wealth extend along other old rail lines leaving the city.

Neighbourhoods by Income in 1970

Those such as myself who are familiar with both the area and recent history should note that places like Coatesville and Downingtown are shown as middle-income. In the 1970s, areas like this and in similar places like Falls Township in Bucks County had robust steel and manufacturing sectors that employed a substantial portion of the local population.

But, compare this to 2007 and you will begin to see how many old factory towns of middle-income areas became dense pockets of depression while the city of Philadelphia itself saw a flight of wealth to the rest of the suburbs. The rural parts of Chester, Montgomery, and Bucks have seen high growth by means of new developments of upper-middle- and upper-income homes.

The Case Against Jerry Sandusky

Penn State is going through some rough times. The charges against Jerry Sandusky are most serious and the failure to do more than the legal requirement in reporting him has cost the university president his job and head coach Joe Paterno his job. Anyone familiar with the school or Paterno’s prior standing in the state—as I am as both a former student at Penn State and nearly life-long resident of Pennsylvania—is shocked/gutted/upset about what has happened.

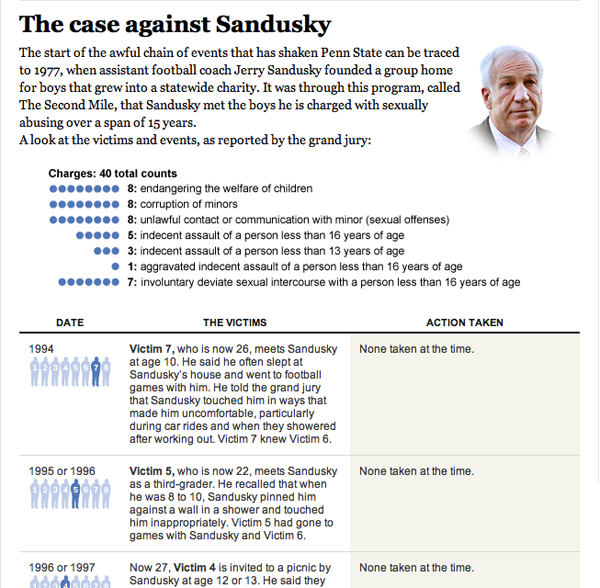
The Washington Post, in an attempt to make sense of the charges against Sandusky, created this graphic explaining the timeline of the allegations and actions taken by principle players.

An infographic outlining the allegations made against Jerry Sandusky

Credit for the piece goes to Bonnie Berkowitz and Laura Stanton of the Washington Post.

Hispanic Growth in the Plains

There is a scene in the re-imagined Battlestar Galactica where with the human population almost extinct, one character comments on the romances of two others by saying “they better start having babies”.

The demographics of the United States are changing. Not that they were not changing prior to recent years; Native American populations were reduced by English and Scottish settlers; the English and Scottish populations were diluted by Germans; then came the Irish and the Italians; then the Slavs; then Chinese—simplistic, but you get the idea.

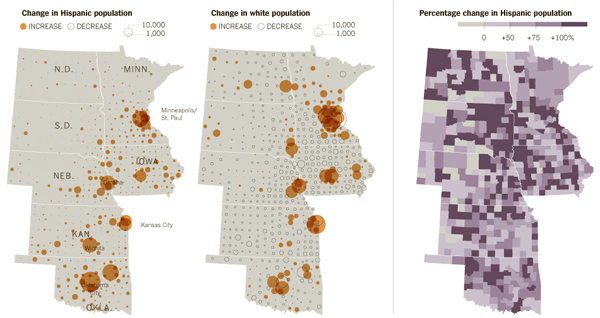
Now, in the Midwest, as the New York Times reports in both an article and its supporting graphic, the long-established relative decline of the United States’ white population is being checked by a surge in Hispanic growth, especially in the rural plains states.

Hispanic Growth in the Plains

I am never so much a fan of the circles as sizes of population—a choropleth would have worked equally well—but it does suffice for this graphic. My larger concern is that the graphic measures growth but does not state growth between what years. Presumably, though the data is sourced from Queens College Department of Sociology, it originates in census figures. That would most likely mean growth between 2000 and 2010.

Armistice Day

Today is Veterans Day. Originally it was called Armistice Day. At 11.00 on 11/11 in 1917, fighting ceased between the Allies and Germany. World War I was effectively over.

Since World War I, in the United States, we have gone on to have World War II, the Korean War, the Vietnam War, the First Gulf War, the Afghanistan War, the Second Gulf War and many smaller conflicts in between. The holiday now represents all veterans, but, it started to commemorate that first horrible war in the West’s history: the Great War of 1914–1918.

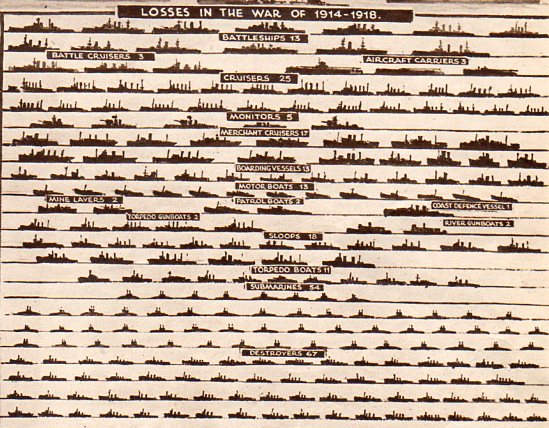
This graphic, from a post at a bookstore owned by John Ptak, originally comes from a larger illustration (beneath) in the Illustrated London News of Royal Navy losses at the conclusion of World War II. For comparison’s sake the original illustrator, G.H. Davis, included this drawing of the Royal Navy’s losses in the Great War of 1914–1918. That war, in naval terms, is perhaps best known for one of the few true battles between battleships on a large scale: the Battle of Jutland.

Royal Navy losses in World War I
Royal Navy losses in World War II

363 Days

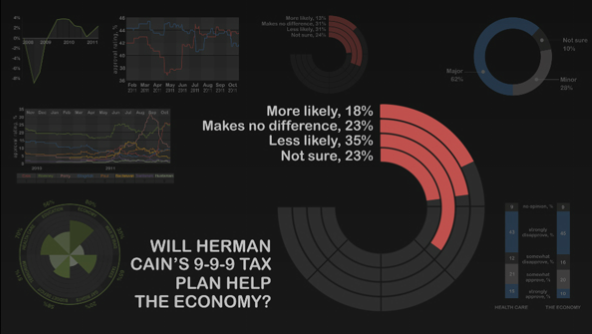
We are now just under 365 days away from Election Day 2012. Without a doubt, I shall have many politically-themed graphics coming. People just have to start making them. But for now, the Economist kicked it off Monday—when it was 365 days—with a motion graphic piece that outlines some of the polling numbers and challenges to the Republicans vying for power and President Obama determined to keep it.

365 days until Election Day 2012

Certain types of the chart are very much not helpful in determining the actual numerical comparisons. But, with the voiceover keeping our attention and explaining what is going on with the charts, it is as always interesting to experience a story told in charts and graphs for nearly three minutes. And about a story with real significance.

To Compare the Fares of Cabs

If you live in a big city, you’ve probably been running late, missed the bus or the train, needed to get home safely at least once. So you’ve probably taken a cab.

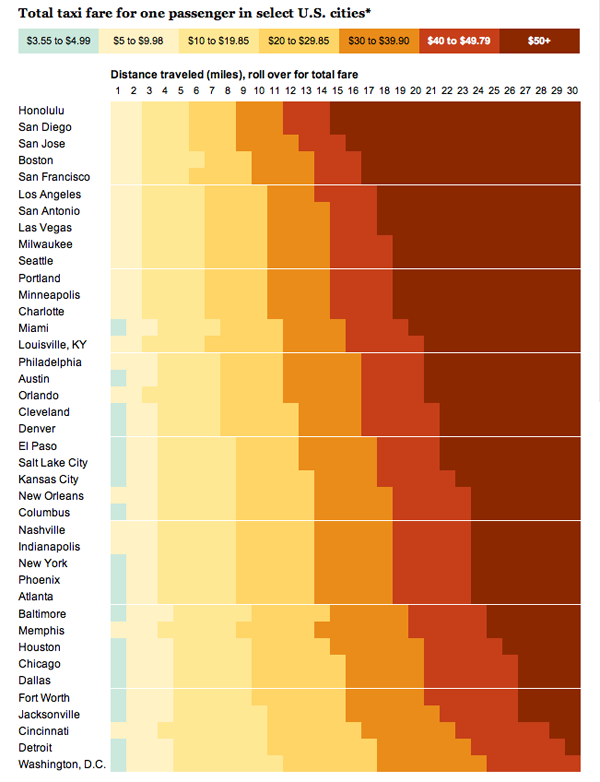
This interactive graphic from the Washington Post compares cab fares across a number of major cities in the United States. The cheapest cab rides are to be found in Washington D.C. The priciest are in Honolulu.

Comparison of Cab Fares Across Major US Cities

Credit for the piece goes to Todd Lindeman and Sisi Wei.

Humanity’s Not So Finest Hours

Humanity is amazing. We have great emotional power for love, sympathy, compassion, &c. We have great intellectual power; we have/are mastering mathematics and science to explore the depths of this ocean and the surfaces of planets not our own.

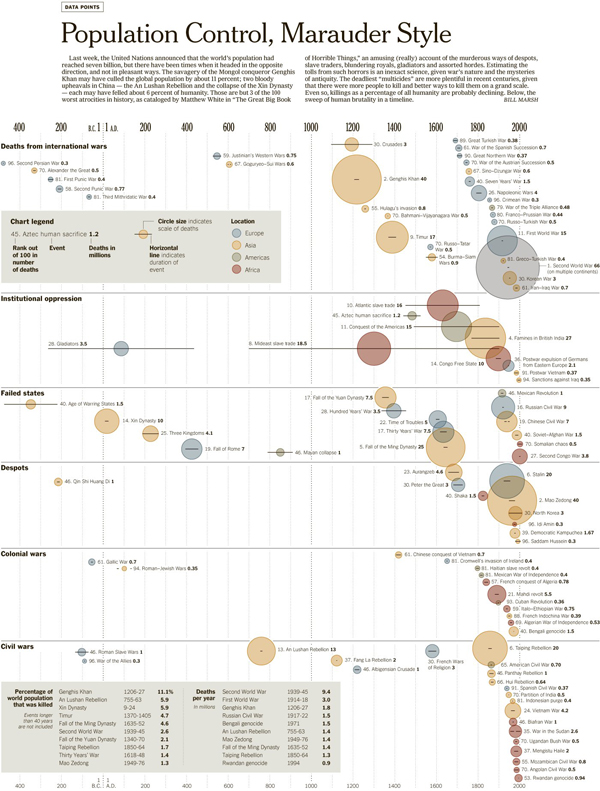
Yet with these great powers comes a great responsibility. And as we continue to reflect upon the milestone of reaching a population of 7 billion men and women, Bill Marsh at the New York Times, along with Micah Cohen, Matthew Ericson, and Kevin Quealy, reflected Sunday on humanity’s ability to let this responsibility slip from time to time and how at those times the human population of Earth fell.

Timeline of Humanity's Atrocities

The data comes from a book by Matthew White called “The Great Big Book of Horrible Things” that details the worst 100 cases of man killing fellow man. (Although, according to Marsh the account is humourous, though I have never read it.) At the top are no particular surprises: World War II, World War I, and Genghis Khan. The reigns of Chairman Mao, Stalin, and the Kims of North Korea. But a look further down the list, further down the timeline reveals in all its tarnished glory the history of humanity when we not quite so amazing.

Can a Republican Win the White House?

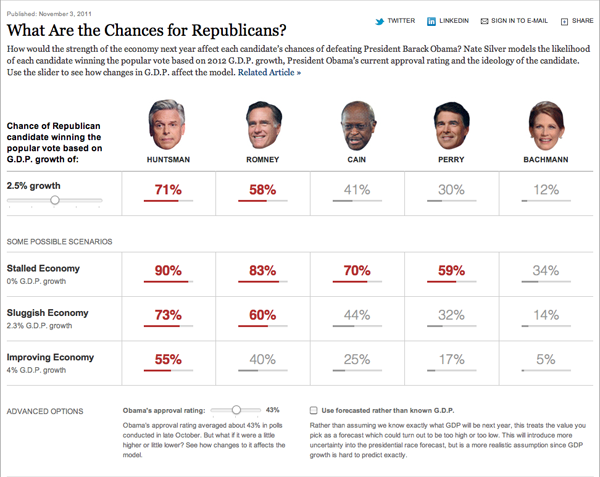
It’s Election Day. Well, not really. But, Nate Silver and the New York Times have come together to release an election simulator, if you will, focused on the chances that a Republican will win the White House.

Chances of Republican Candidates Winning the Election

You play with a few different variables to control the outcome: GDP growth and President Obama’s approval rating. These then are computed along with a few other things (I assume) and, like magic, you get to see your Republican pick’s changes of winning the election.

Keep in mind that these are just possible candidates, not necessarily likely candidates. John Huntsman, after all, is polling in the single digits in some of the early primary states. So while the moderate, centre-right, former ambassador to China, ex-governor of Utah looks almost unbeatable in several scenarios, I think most would agree that the Republican base will not vote for him.

But it is scenarios like that of Huntsman that are worth reminding us that perhaps the current party political system we have in the United States does not yield the best candidates for public office, nor the most broadly electable.

Random is the New Orderly

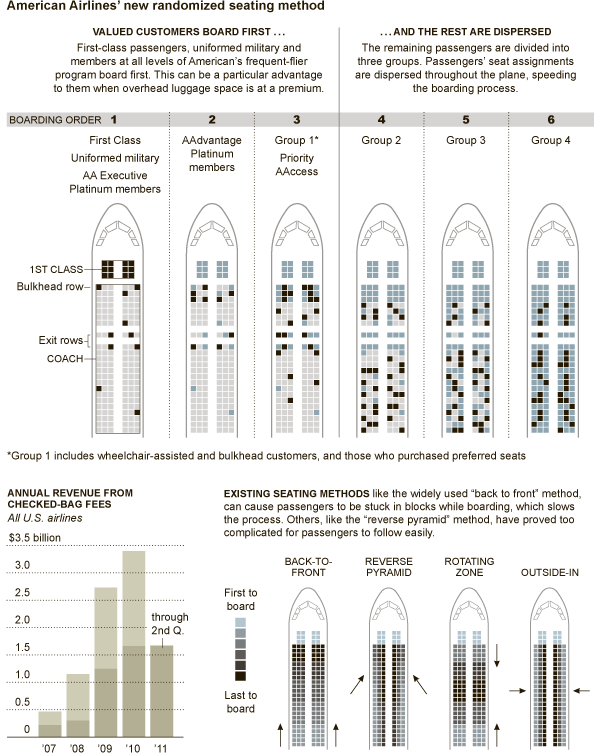
Ever been on a flight where there is not enough overhead luggage capacity for everyone? Then they make you stow your bag anyway? Well, apparently that’s what’s happening in these days of baggage fees—which make airlines quite profitable.

This diagram in the New York Times shows how American Airlines is changing from the more common front-to-back seating of passengers to a random assignment of seats in an attempt to reduce the time spent boarding the plane. After all, not only are baggage fees money, but so is time.

Boarding Diagram
Boarding Diagram