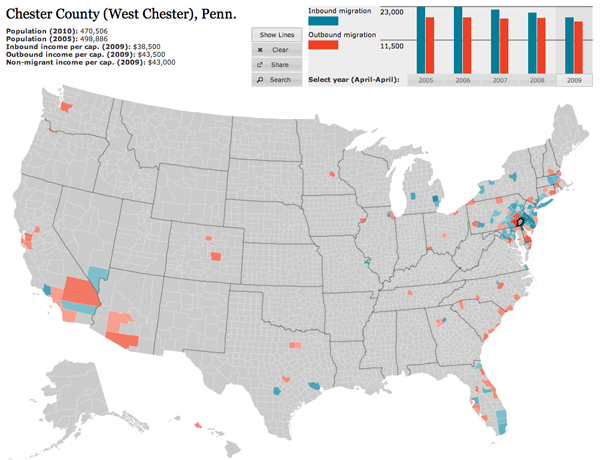
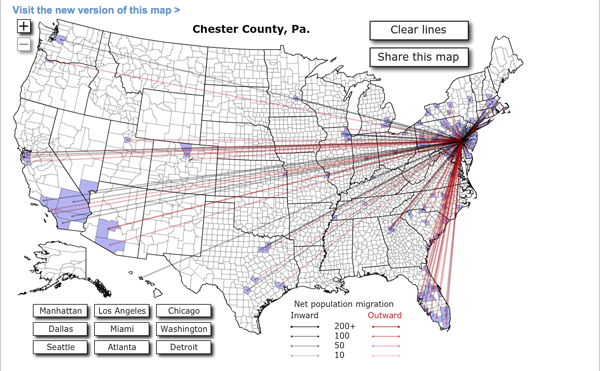
Forbes released Jon Bruner’s latest map of migration in the United States. It uses IRS figures to show inbound and outbound movement from counties across the United States. The work itself is an improvement from his map from last year, which was a bit more difficult to read. Beneath is the new version, and at the end, for comparison, the old.

Firstly, the colour palette is far more sophisticated. Secondly, and most crucially, the user can hide the lines on the map, which obscures a key part of the story of migration in urban areas—higher income people moving out of the city and into the suburbs. Thirdly, the map data now includes additional years, which are available by clicking the small chart in the upper right—a welcome addition that allows the data from last year’s map to become accessible this year. Fourthly, and to be fair this may have existed previously but not that I can recall, the new map is accompanied by essays.
These essays use the map and its data to tell stories and explain what one sees going on with the data. It is (relatively) easy for one to put together a piece of data visualisation from a data set. But, without knowing where to look, users may not actually find anything valuable in the visualisation. By pointing to these essays, the map—already much improved from a design perspective—takes on a much more rounded and mature character and becomes more about generating information and knowledge than simply figures and statistics.

