Where the (Disproportionate) Jobs Are

A little while ago, LinkedIn put together a map looking at the disproportionately represented jobs and skills in cities in both the United States and Europe. That is different from the most common jobs but those that are “most uniquely found” in cities.

The unique skills of America's various cities
The unique skills of America’s various cities

Unfortunately the interface is a bit clumsy. For something that is about exploring different cities, I think the small area of the map could be bigger. And the highlighting functionality lags. But the overall idea is interesting.

And on a side note, while graphic design is not specifically covered, I found the list of skills for Chicago surprising. If only because I work as a designer for a company in the market research industry.

Kind of explains a lot. Well, to me.

Credit for the piece goes to Sohan Murthy.

White (Immigrant) People

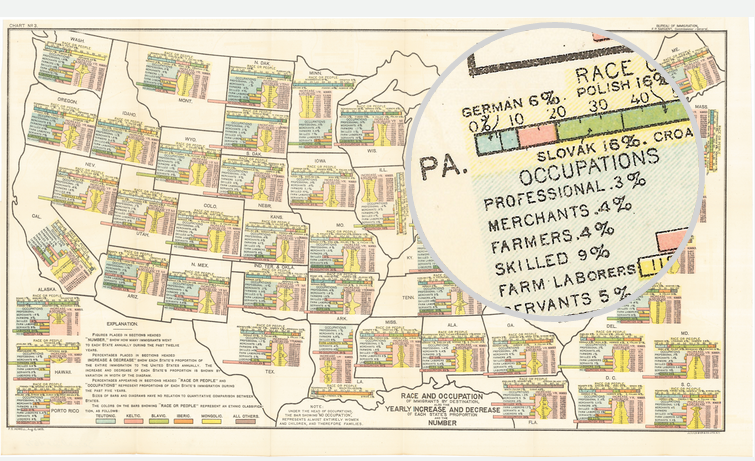
This is an old map that saw the light of day a while back. Featured on Vox, the map supports the notion that some white people are whiter than other white people. The map explores immigrant populations. Using a map for spatial arrangement of integrated components, the data looks at immigrants’ ethnic origins, their workforce breakdown, and their recent growth.

A look at PA, my ancestors are in that data set

Credit for the piece goes to FS Howell. (I presume.)

American College Football Part Deux

A couple of weeks ago I shared a map from the New York Times that looked at American college football programme loyalty. And I quipped that none of it made sense to me as someone born and raised in the Northeast. The New York Times followed that piece up with another that looks solely at Facebook likes of college football via likes for any team. Not surprisingly the sport does not do too well in the Northeast. But it does appear quite popular in other regions of the country.

Chester County is not big on it…

Credit for the piece goes to Neil Irwin and Kevin Quealy.

The American Empire

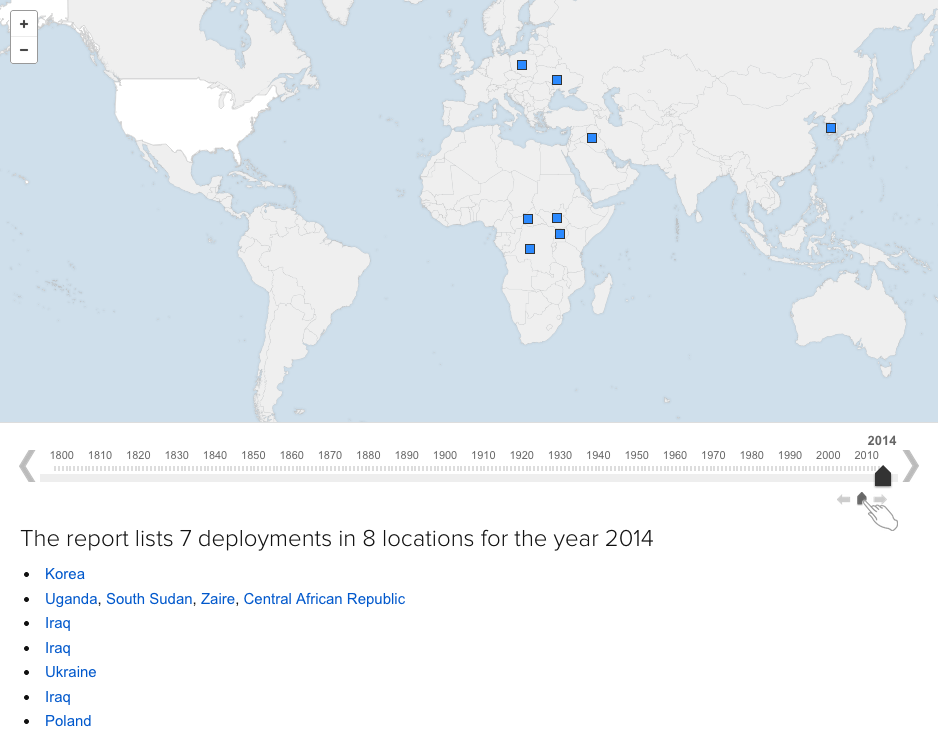
The United States has a long history of deploying troops overseas. How long? And where to? Well, ABC (as in the Australian Broadcasting Corporation) mapped out every US deployment dating back to 1798. I captured the year 2014, but if you are curious, you should check it out for yourself.

US Deployments Abroad

A neat little bonus, watch the growth of the borders of the United States from 1798.

Credit for the piece goes to Simon Elvery.

Mapping Equal Populations

After a week of some depressing material. Let’s lighten things up. Since, you know, it is a Friday.

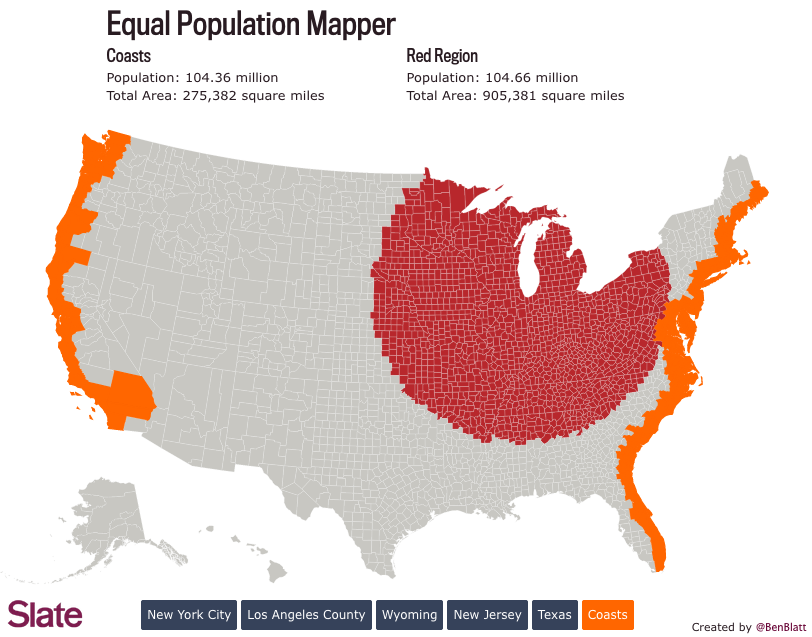
Two weeks ago we looked at comparisons of actual geographic area. These are sometimes useful comparisons. But more often than not we are talking about the people that live in said areas. And speaking as someone who has lived in either suburbs of big cities or within big cities my entire life, comprehending the not-do-dense rural flyover states is a bit hard to do. Thankfully Ben Blatt over at Slate put together a nice interactive piece that allows you to get a better sense of just how empty the middle of the country really is. (Hint, it is empty.)

Here we take a look at comparing the East and West coasts to Chicago. Turns out you have to go pretty far from the shores of Lake Michigan to equal the population of the two coasts. That’s a lot of flyover.

Coasts vs. Chicago
Coasts vs. Chicago

Credit for the piece goes to Ben Blatt.

Drawing Down America’s Presence in Afghanistan

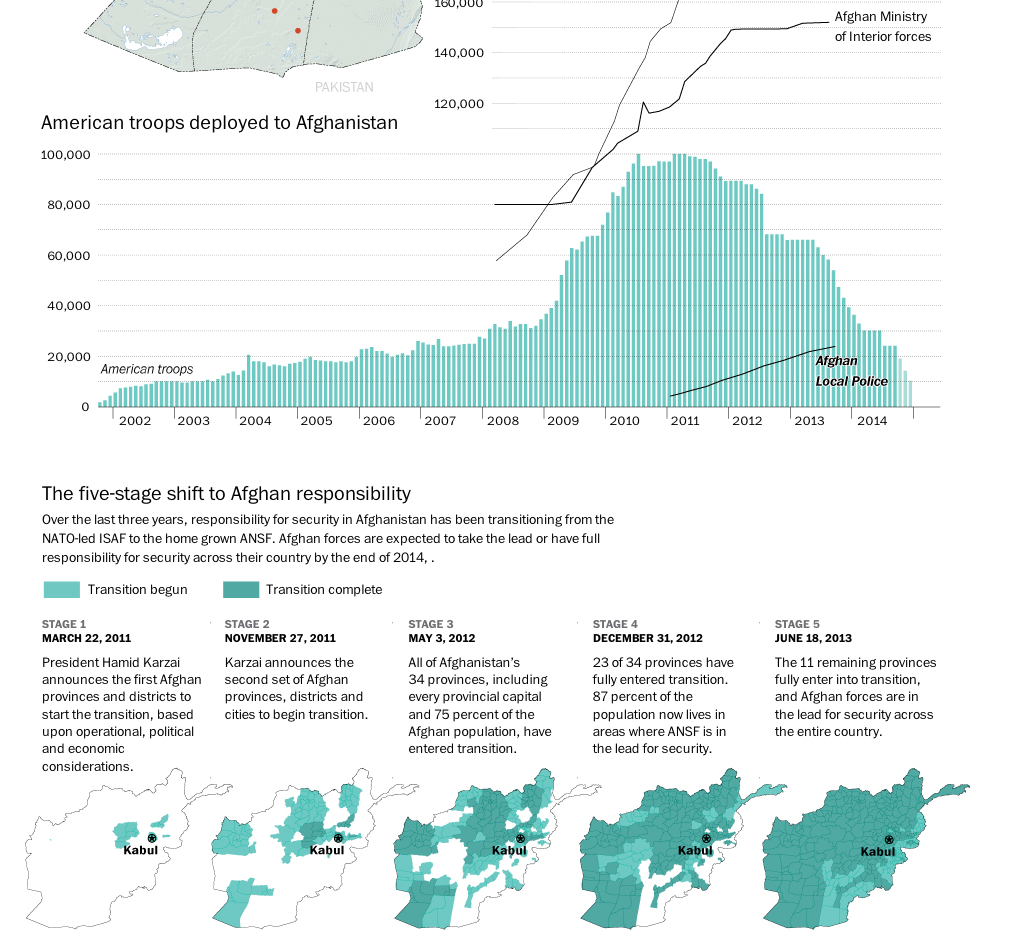
The United States and its allies are slowly beginning to pull out of Afghanistan. While several thousand troops will remain, the total will be nowhere near the peak figure a few years ago. This graphic from the Washington Post details just how this transition has been occurring.

The anti-surge
The anti-surge

Credit for the piece goes to Richard Johnson.

The Fall of the Berlin Wall

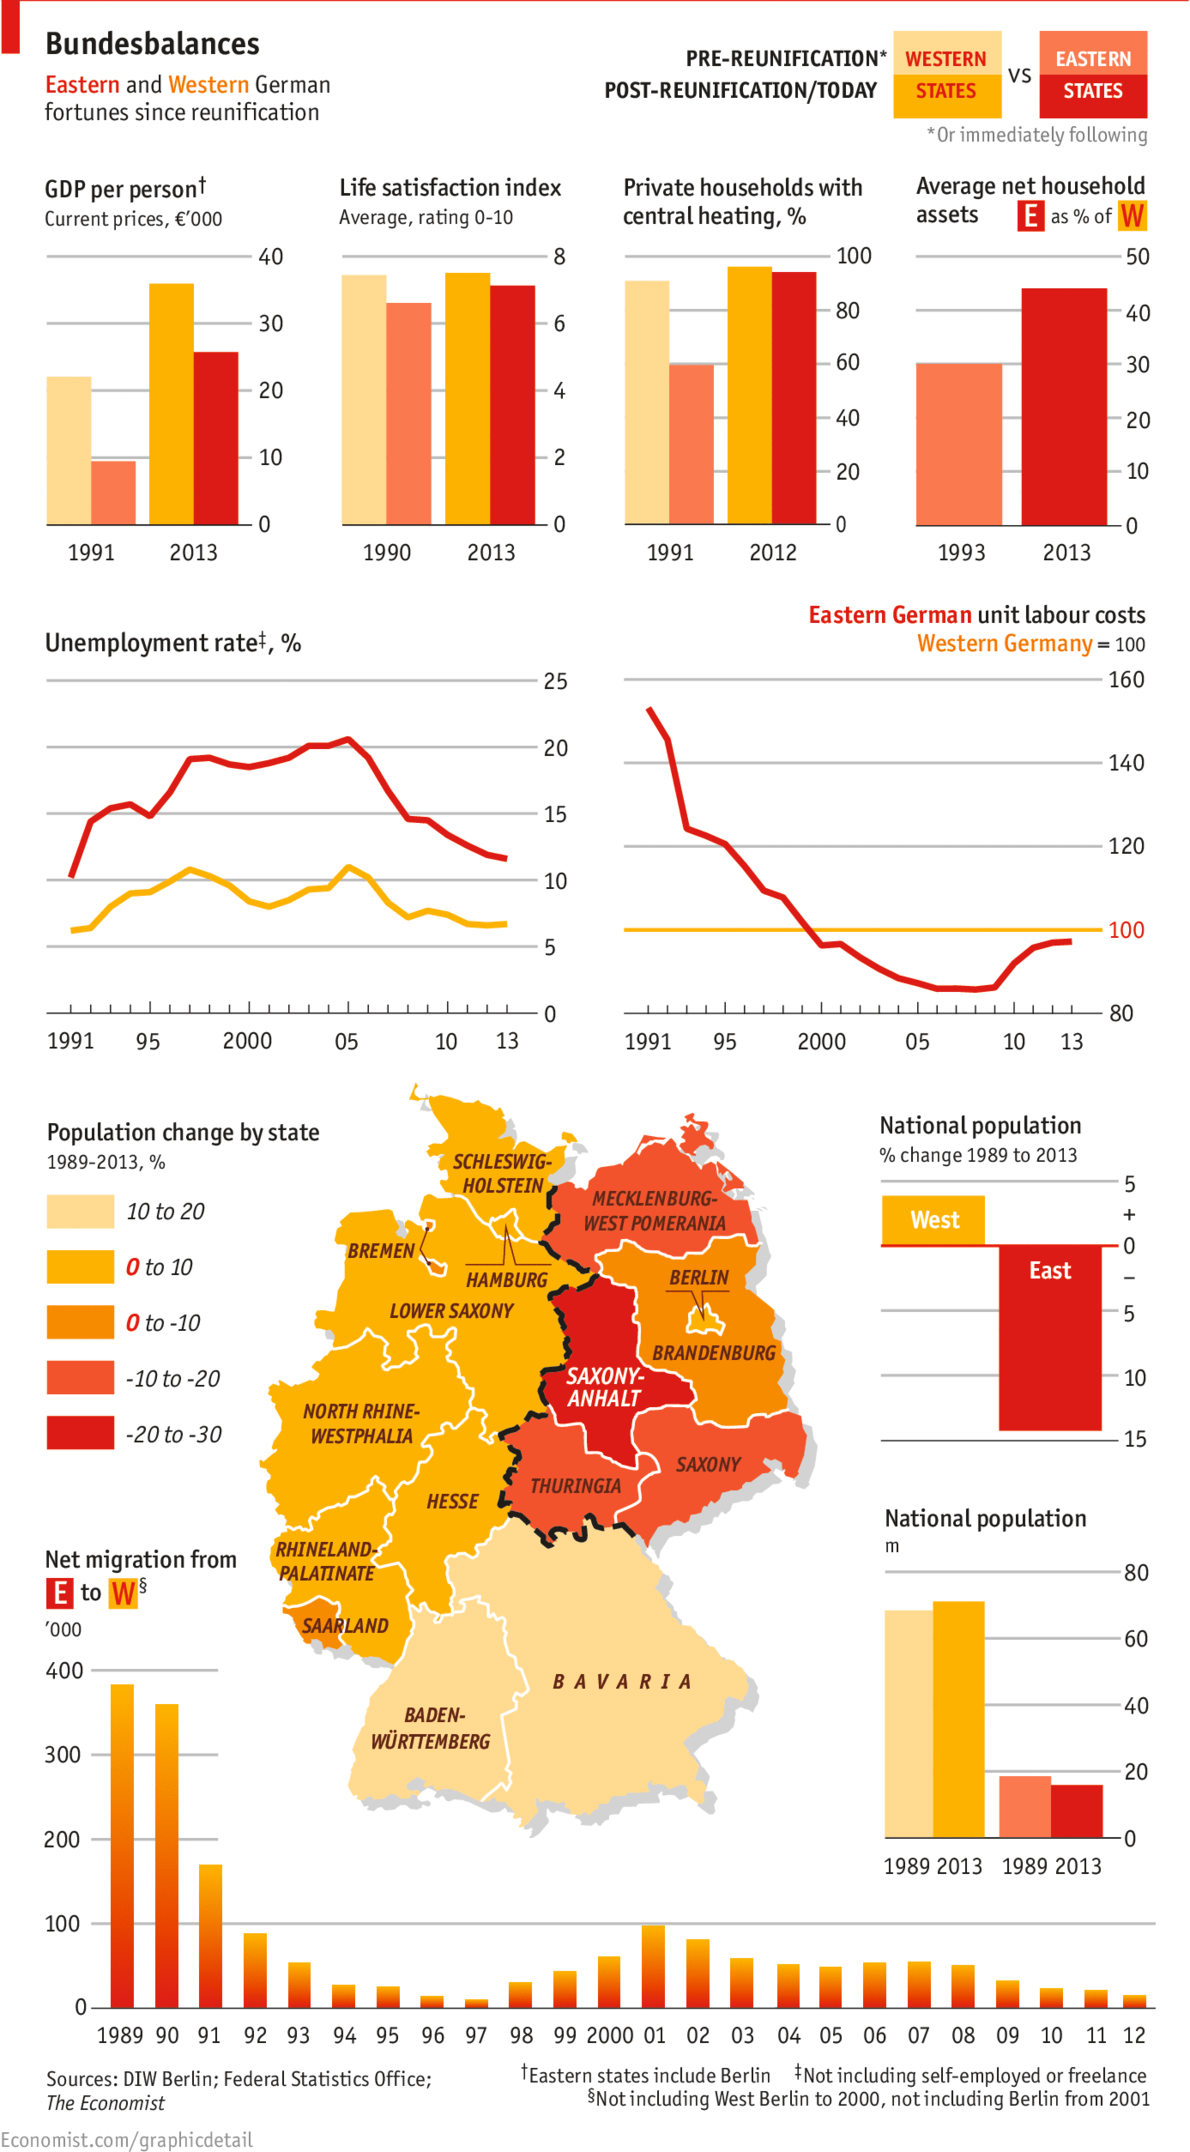
Yesterday marked the 25th anniversary of the fall of the Berlin Wall. But with the reunification of Germany a year later, has the former East Germany been able to catch up to what was West Germany? The Economist looks at the results in this graphic and the answer is yes. And no.

East vs. West. 1989 vs. 2013.

Credit for the piece goes to the Economist’s graphics department.

The Libyan Revolution’s Results So Far…

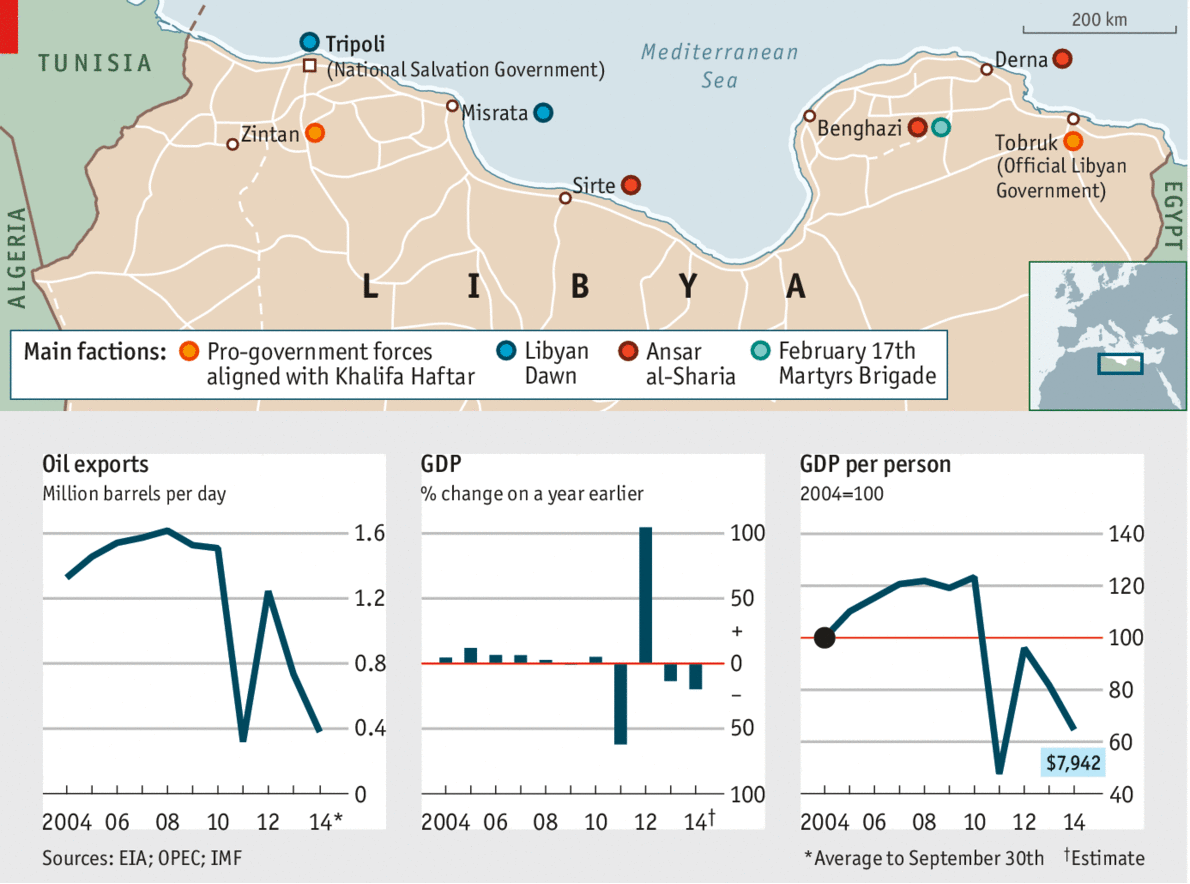
The Libyan Revolution that removed Gaddafi from power was just over three years ago. Unfortunately, if we have not learned by now, the process of building Western-like liberal democracies is clearly a messy process. Because Libya is far from it as this graphic from the Economist shows.

So how's that revolution working out for you?
So how’s that revolution working out for you?

Credit for the piece goes to P.J.W. and L.P.

Chinese Nuclear Submarine Navy

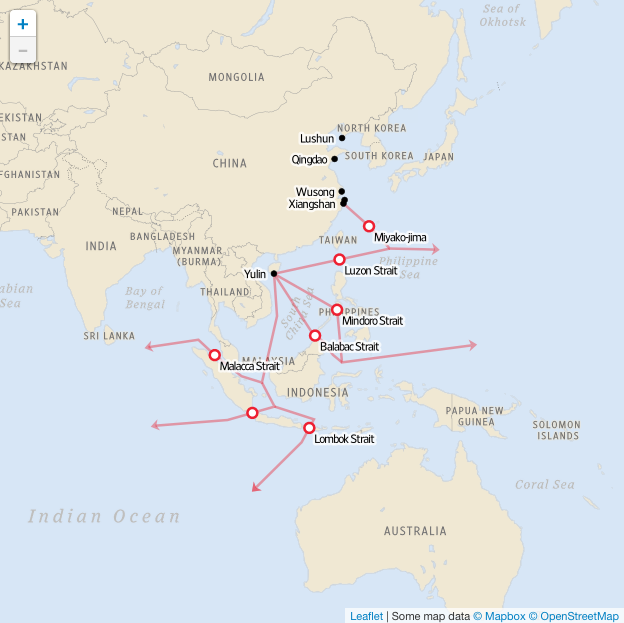
This weekend the Wall Street Journal published an article that combined my interest in data visualisation with my interest in naval ships. The article looks at the growth of the Chinese nuclear submarine programme. And alongside the article are maps, charts, illustrations, and a narrated video that support the written word.

Choke points for the Chinese navy

Credit for the piece goes to Alberto Cervantes and the Wall Street Journal’s graphics department.