The Freedom of the Press

By now you may have heard that this Thursday media outlets across the United, joined by some international outlets as well, have all published editorials about the importance of the freedom of the press and the dangers of the office of the President of the United States declaring unflattering but demonstrably true coverage “fake news”. And even more so, declaring journalists, especially those that are critical of the government, “enemies of the people”.

I have commented upon this in the past, so I will refrain from digressing too much, but the sort of open hostility towards objective reality from the president threatens the ability of a citizenry to engage in meaningful debates on public policy. Let us take the clearly controversial idea of gun control; it stirs passions on both sides of the debate. But, before we can have a debate on how much or how little to regulate guns we need to know the data on how many guns are out there, how many people own them, how many are used in crimes, in lethal crimes, are owned legally or illegally. That data, that verifiably true data exists. And it is upon those numbers we should be debating the best way to reduce the numbers of children massacred in American schools. But, this president and this administration, and certain elements of the citizenry refuse to acknowledge data and truth and instead invent their own. And in a world where 2+2=5, no longer 4, who is to say next that no, 2+2=6.

There are hundreds of editorials out there.

Read one from the Philadelphia Inquirer, the Chicago Tribune, the Guardian, and/or the New York Times.

But the one editorial board that started it is that of the Boston Globe. I was dreading how to tie this very important issue into my blog, which you all know tries to focus on data and design. As often as I stand upon my soap box, I try to keep this blog a little less soapy. Thankfully, the Globe incorporated data into their argument.

The end of their post concludes with a small interactive piece that presents survey data. It shows favourability and trustworthiness ratings for several media outlets broken out into their political leanings. The screenshot below is for the New York Times.
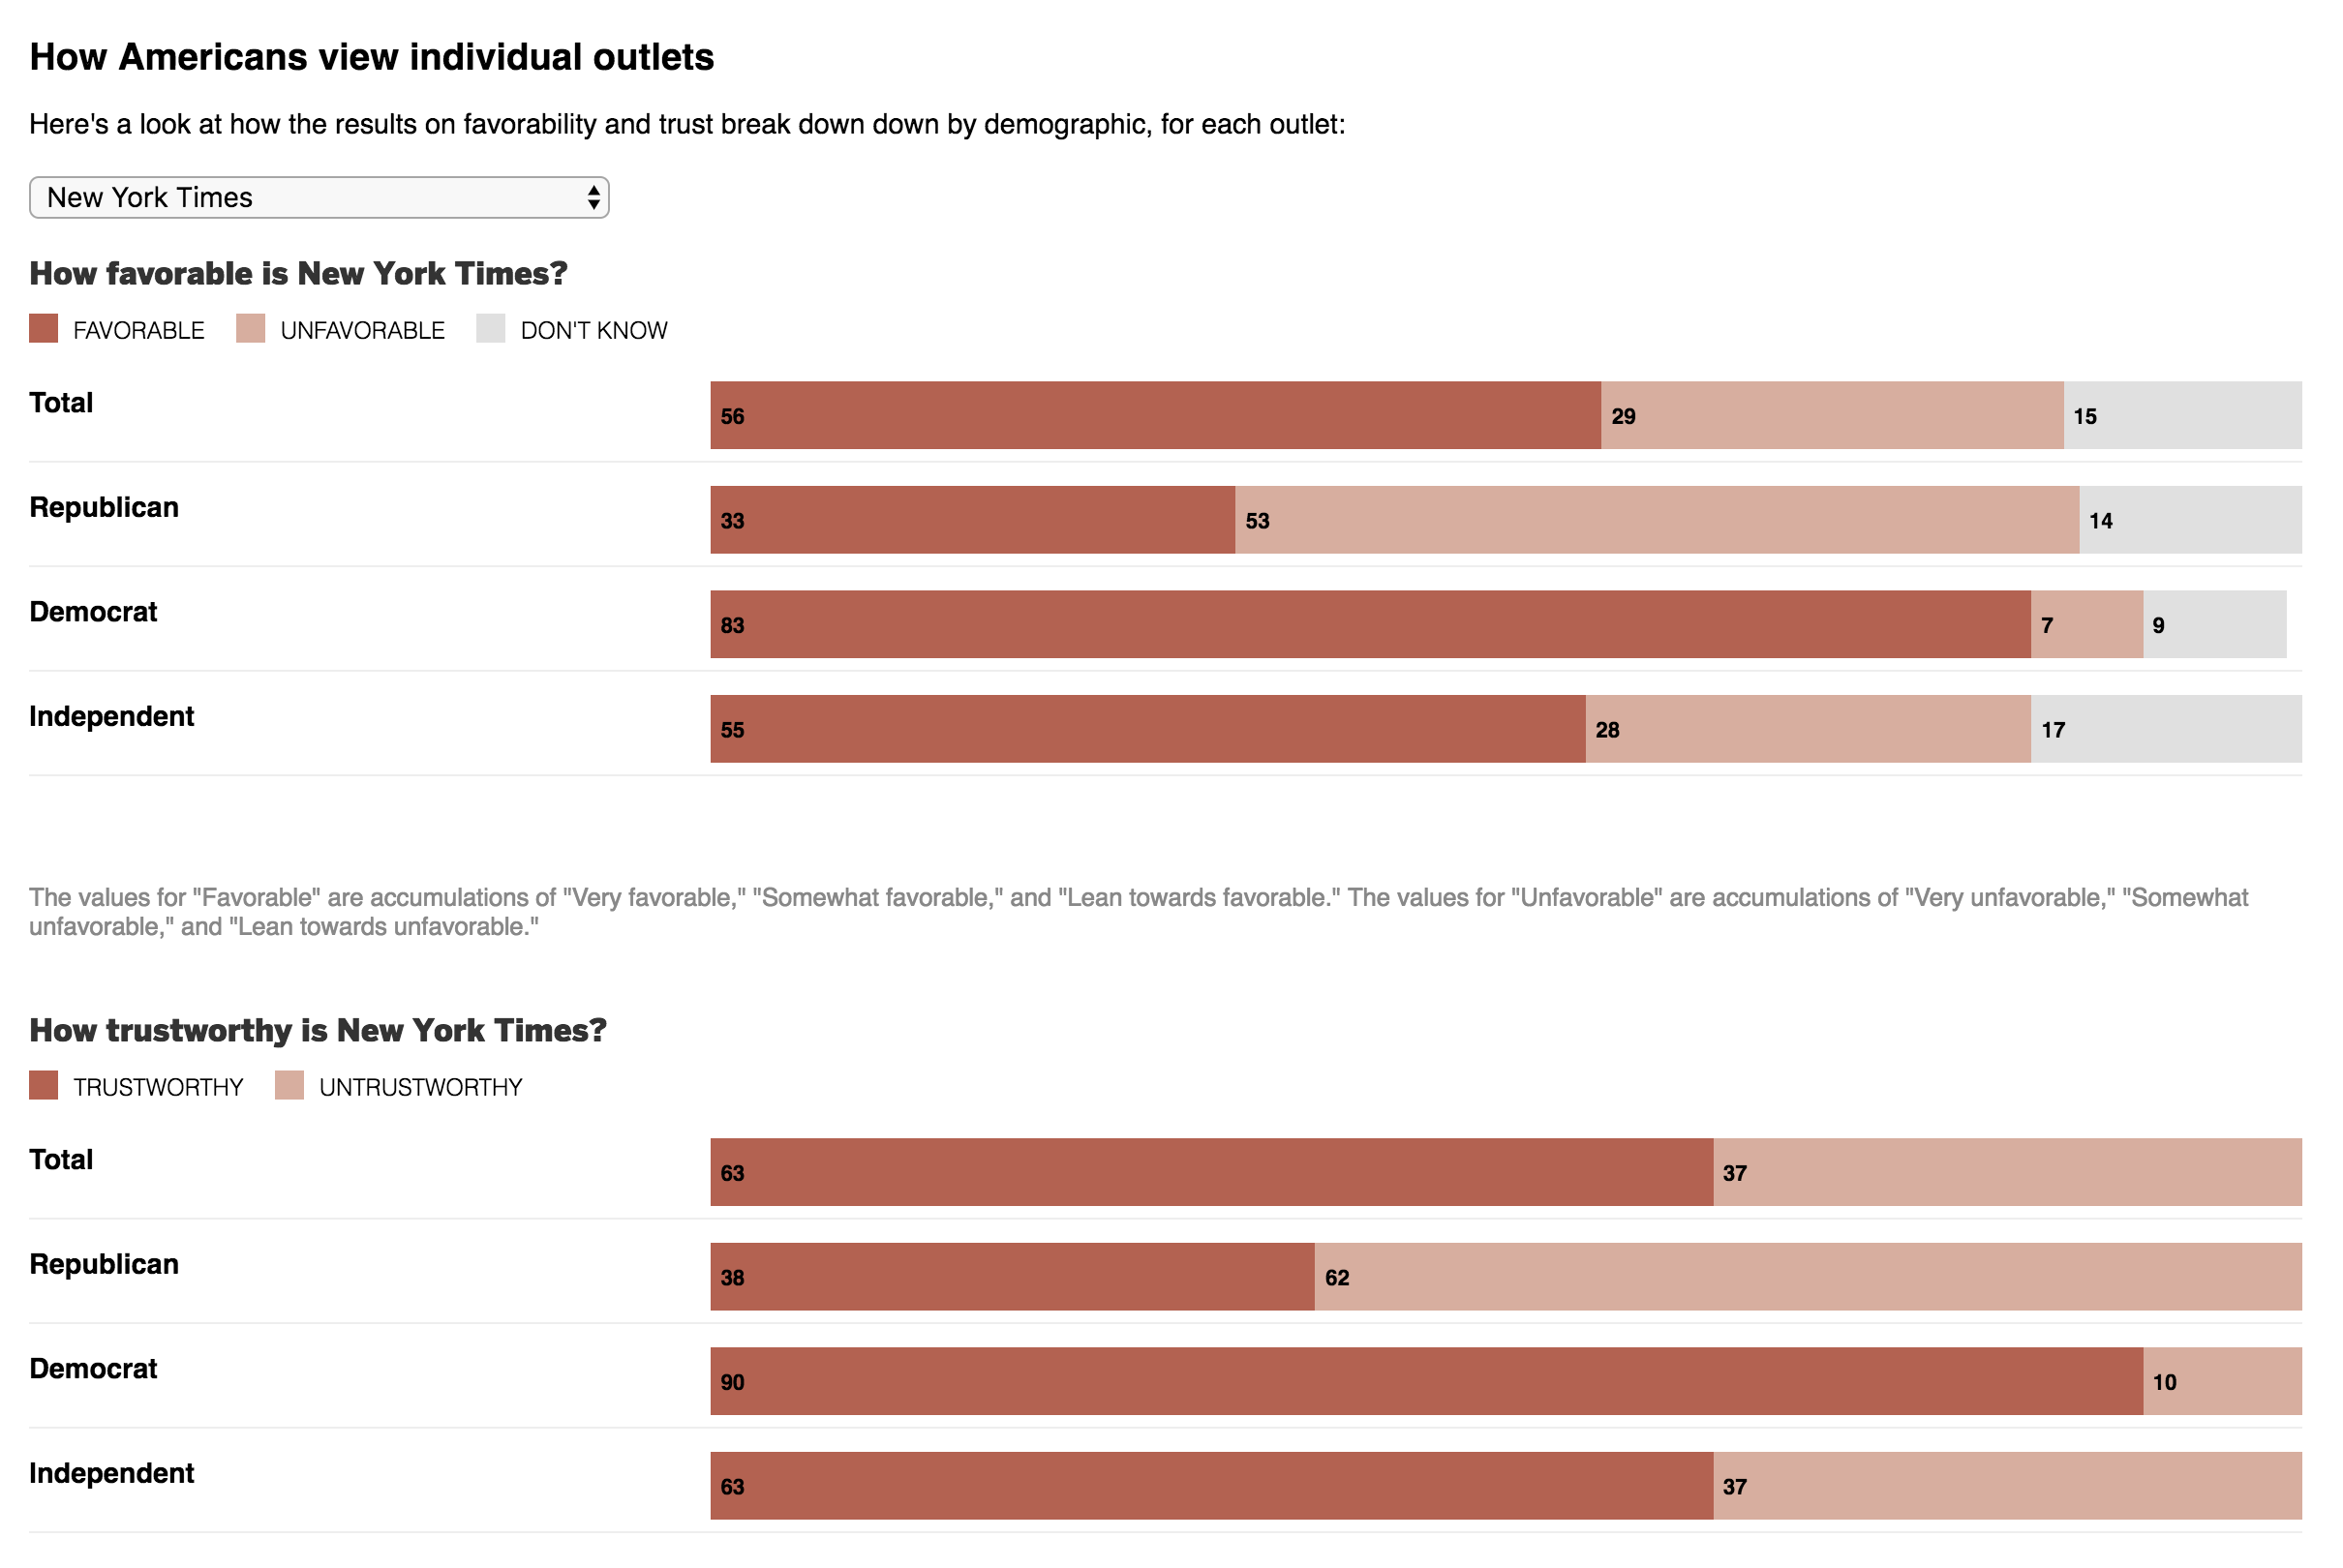
Clearly Republicans and Democrats view the Times differently

The design is simple and effective. The darker the red, the more people believe an outlet to be trustworthy and how favourably they view it.

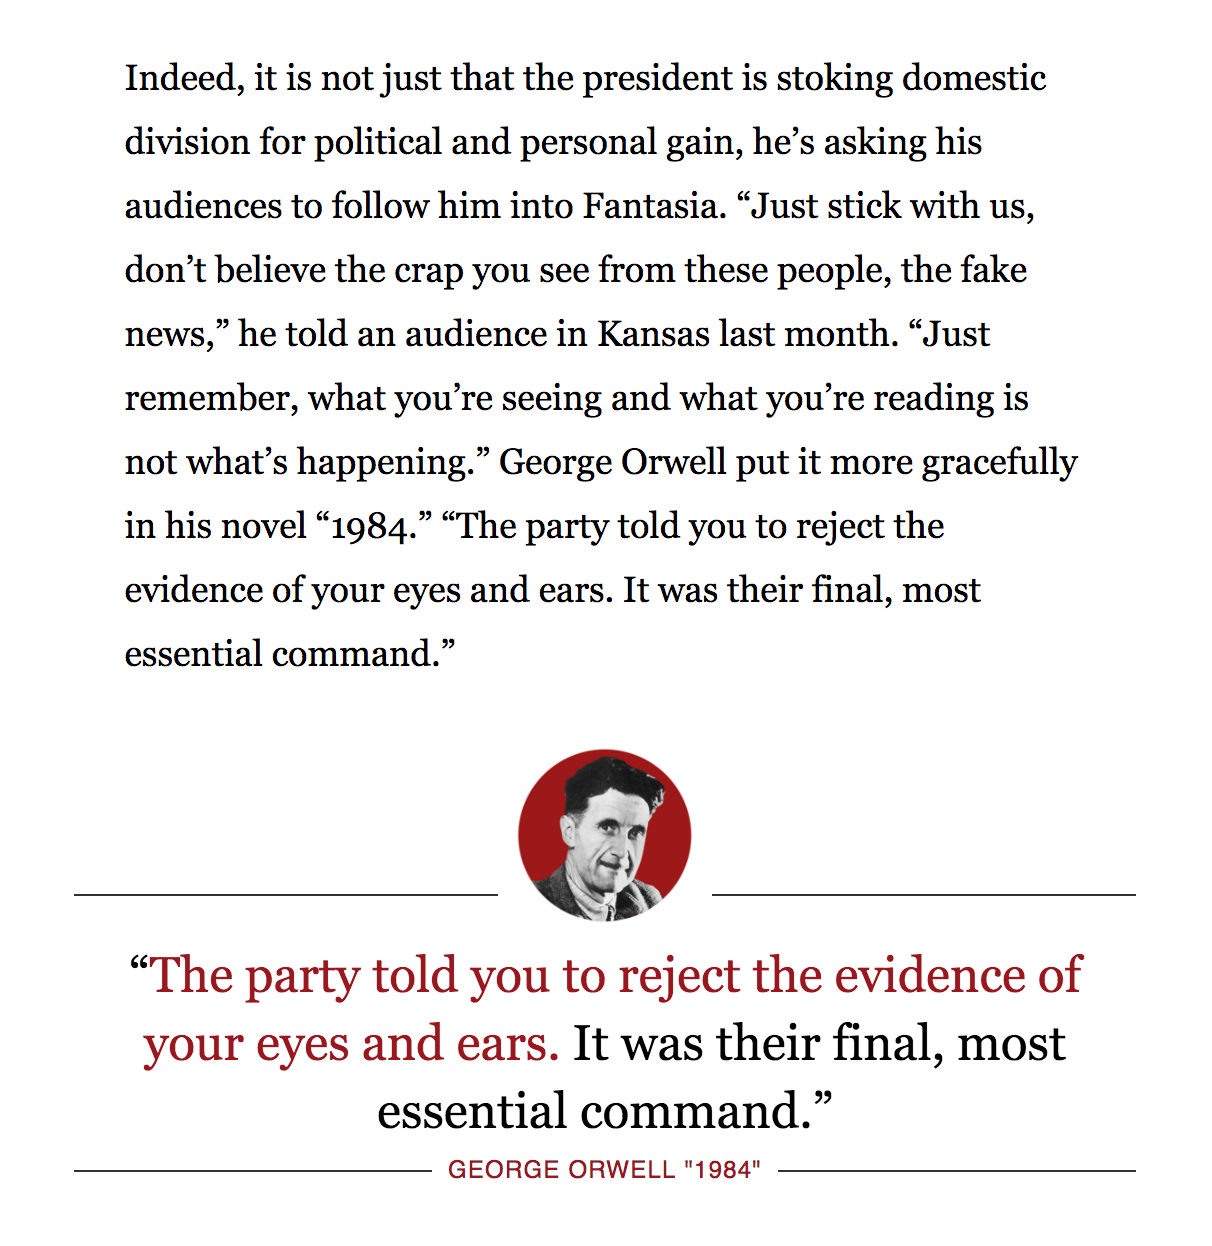
But before wrapping up today’s post, I also want to share another bit from that same Boston Globe editorial. As some of you may know, George Orwell’s 1984 is one of my favourite books of all time. I watched part of a rambling speech by the president a few weeks ago and was struck at how similar his line was to a theme in that novel. I am glad the Globe caught it as well.

Credit for this piece goes to the Boston Globe design staff.

The Decline of the Media

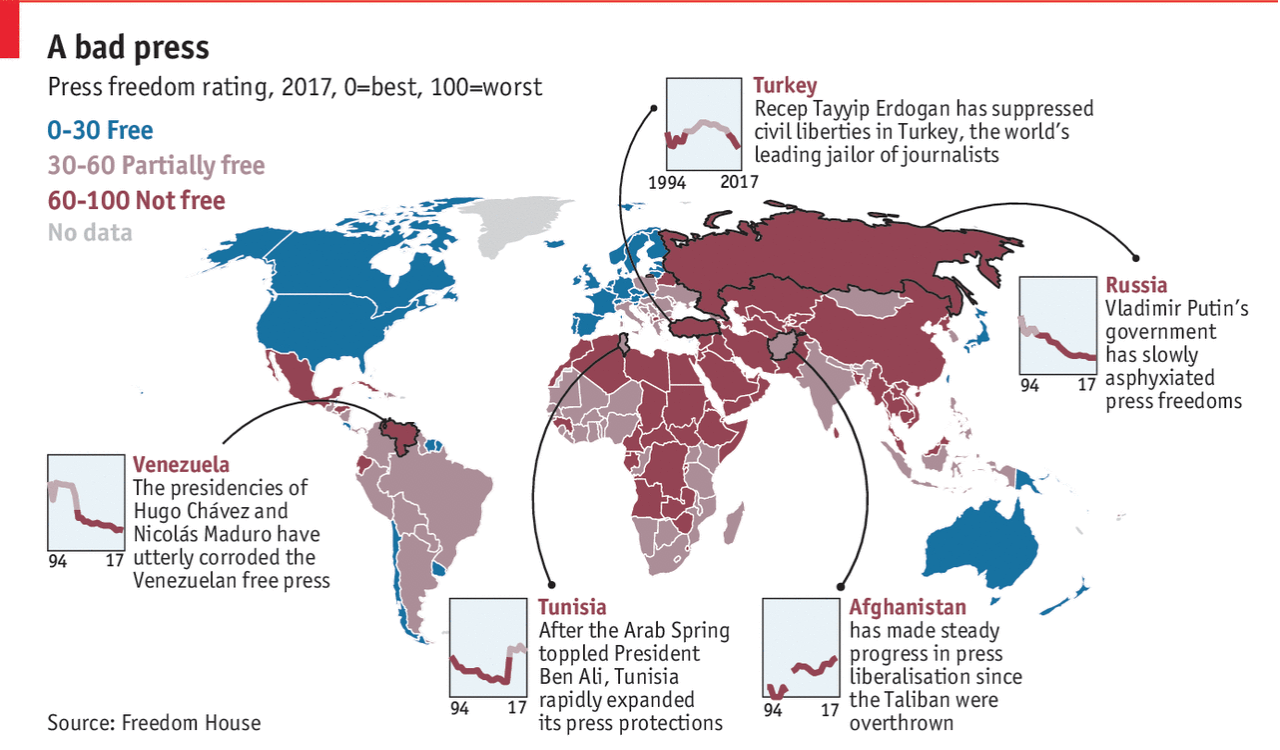
Everybody loves maps. Unfortunately this is not a map to love. The Economist looked at the global status of the free press and its decline around the world.

If only it were a larger map

The graphic is a neat little package of a map to anchor the narrative and a few callout countries with their general declines—or in Tunisia’s case the reversal thereof—highlighted. But I do have a few issues with the piece.

Do the lines need to be curved? Some certainly make sense, e.g. how do you get from the Turkey box to the outline of Turkey? But then for Afghanistan, a straight line through Balochistan, Pakistan would mean the line would not have to cover Pakistan, India, curve around Sri Lanka, and then finally reach the box.

In the little boxes, I also wonder if the lines need to be as thick as they are. Could a lighter stroke weight improve the legibility of the charts?

And to be super picky, I wonder if the stroke outlines of the countries are complete. My trained eye fails to register an outline of both the European part of Turkey and of the Russian oblast of Kaliningrad.

Credit for the piece goes to the Economist’s Data Team.

Trumping (Most) All on Twitter

Initially I wanted today’s piece to be coverage of the apparent coup d’état in Zimbabwe over night. But while I have found some coverage of the event, I have not yet seen a single graphic trying to explain what happened. Maybe if I have time…

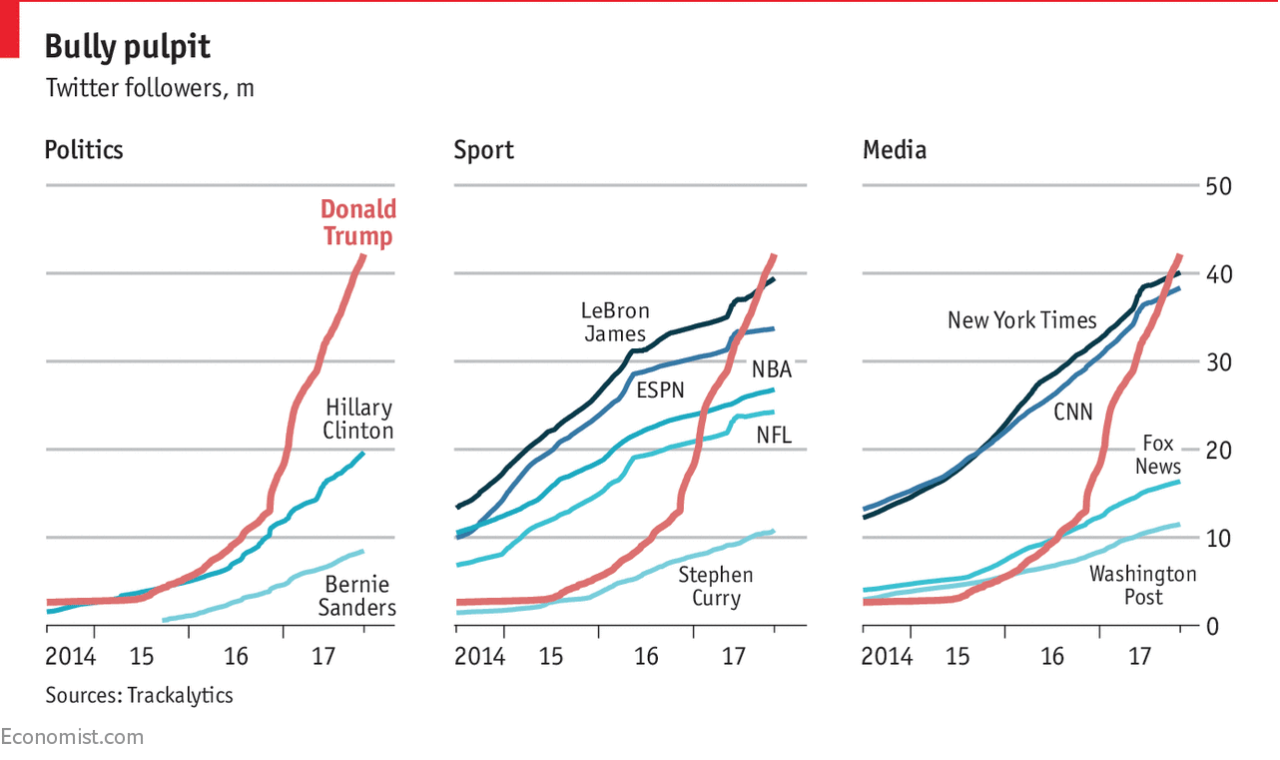
In the meantime, we have the Economist with a short little piece about Trump on Twitter and how he has bested his rivals. Well, most of them at least.

Trumping one's rivals
Trumping one’s rivals

The piece uses a nice set of small multiples to compare Trump’s number of followers to those of his rivals. The multiples come into play as the rivals are segmented into three groups: political, sport, and media. (Or is that fake media?)

Small multiples of course prevent spaghetti charts from developing, and you can easily see how that would have occurred had this been one chart. But I like the use of the reddish-orange line for Trump being the consistent line throughout each. And because the colour was consistent, the labelling could disappear after identifying the data series in the first chart.

And worth calling out too the attention to detail. Look at the line breaks in the chart for the labelling of Fox News and NBA. It prevents the line from interfering with and hindering the legibility of the type. Again, a very small point, but one that goes a long way towards helping the reader.

I think the only thing that could have made this a really standout, stellar piece of work is the inclusion of another referenced data series: the followers of Barack Obama. At 97 million followers, Obama dwarfs Trump’s 42.2 million. Would it not be fantastic to see that line soaring upwards, but cutting away towards the side of the graphic would be the text block of the article continuing on? Probably easier for them to do in their print edition.

Regardless, this is another example of doing solid work at small scale. (Because small multiples, get it?)

Credit for the piece goes to the Economist Data Team.

O’Reilly’s Out

Of all the things I expected to cover this week, this was not one of them.

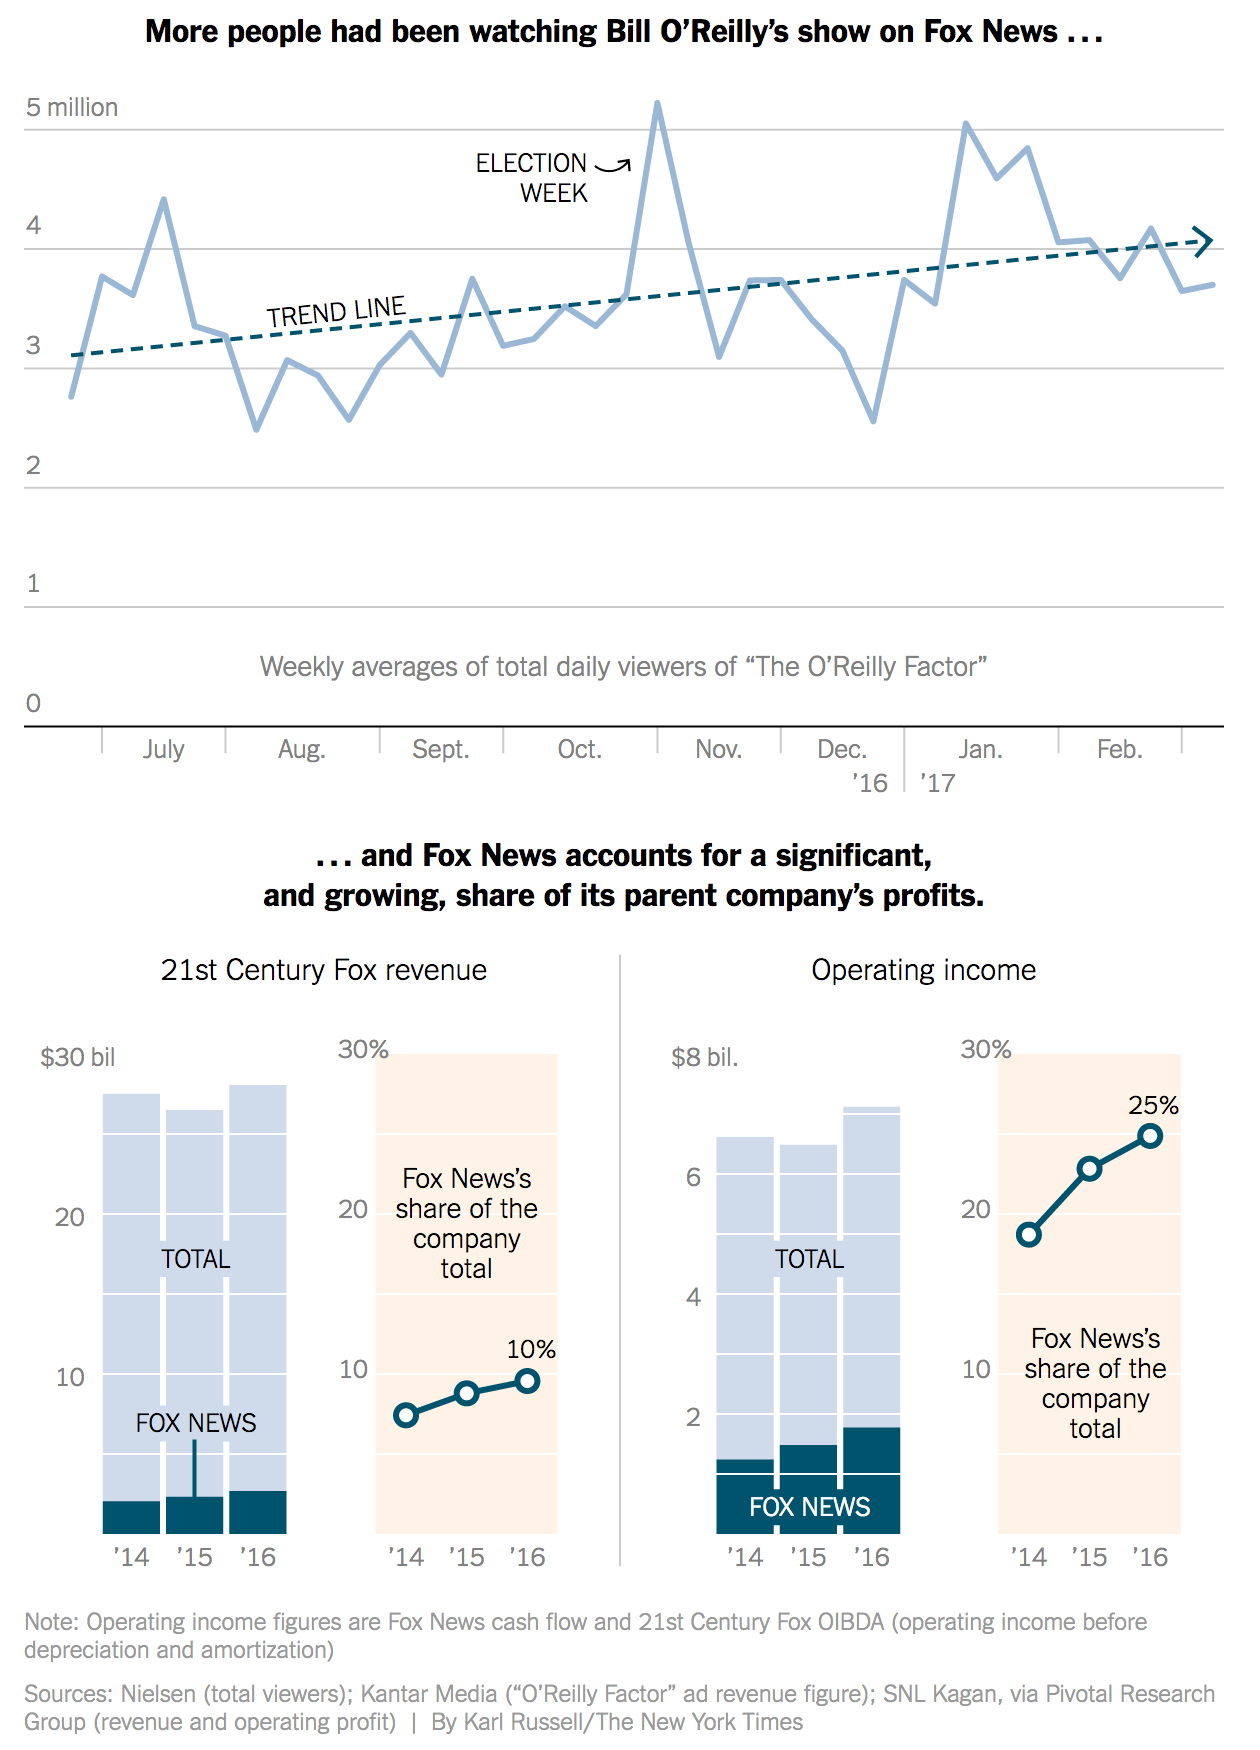
This is Fox New’s firing of Bill O’Reilly, their lead personality and heaviest hitter for the last 21 years, for accusations of sexual harassment both externally and internally. But up until yesterday afternoon, just how important was O’Reilly to Fox News? Well, as you might guess somebody covered just that question. The New York Times addressed the question in this online piece and uses a nice graphic to buttress their argument.

What goes up must eventually fall down

I like the use of the longer time horizon across the top of the graphic. But most important in it is the inclusion of the trend line. It helps the reader find the story amid the noise in the weekly numbers. The big decline towards the end of December looks important until one realises that it probably owes the drop to the Christmas holidays.

Then the bottom piece does something intriguing; it shows both the actuals and percentages side-by-side. Typically people love stacked bar charts—by this point you probably all know my personal reluctance to use them—and that would be that. But here the designer also opts to show the share as a separate data point beside the stacked bar charts.

I think the only thing missing from the piece is a bit more context. Is O’Reilly still the heaviest weight in the lineup? The top chart could have perhaps used some additional context of other shows over the last few months. For example, how does O’Reilly compare to Hannity?

Regardless, this piece does a fantastic job of showing the until-yesterday increasing importance of O’Reilly to Fox News and then Fox News’ importance to 21st Century Fox.

Credit for the piece goes to Karl Russell.

Examining the World’s Response to the Somalia Famine

Somalia is beset by a bevy of problems; from an Islamist insurgency that holds great swathes of the south, to the de facto independent regions of Somaliland and Puntland in the north, to the pirates operating off the coast, to the barely functional government in Mogadishu that controls only sections of the capital through the backing of an African Union peacekeeping force, to the recent famine that devastated the south of the country.

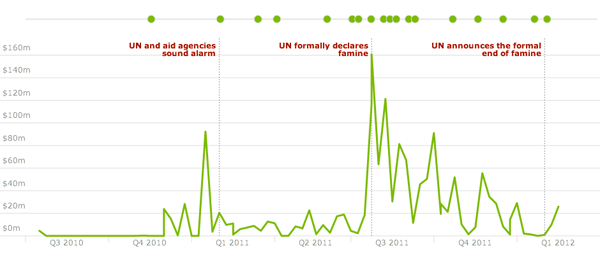
The famine, which ended formally ended only earlier this month, is the focus of an interactive piece by the Guardian. It examines how the tragedy unfolded, especially when early indicators pointed to the likelihood of a famine. Through a timeline, the piece marks out what happened when—probably important as not all readers may be familiar with the details of the disaster—atop a chart that visualises the aid given to Somalia. Other line charts describe who donated and when.

Timeline of the story and how that compares to donations

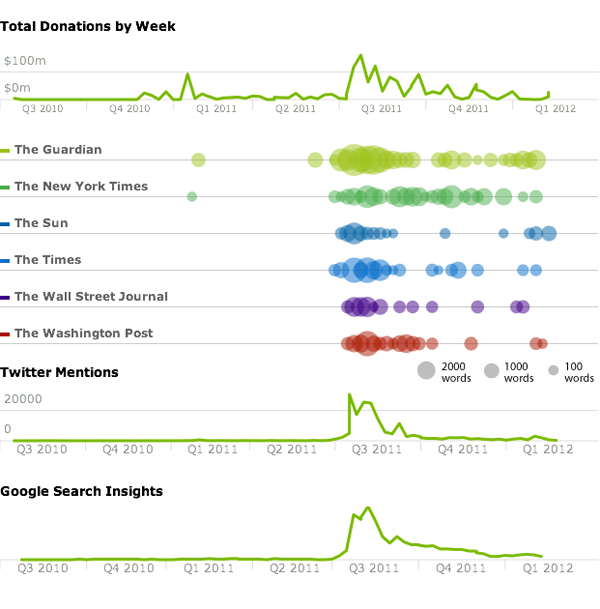
The most interesting, however, is an investigation into what (perhaps) spurred the donations. Using the same timeline as a common base, it charts when donations were made against mentions in six US and UK media outlets against Twitter mentions and Google Search Insights.

Donations overlap with media mentions

With this last bit in particular, the Guardian has attempted to use data visualisation to support an argument made in accompanying text. Often times data visualisation and infographics will simply document an event or provide facts and figures. Here, however, an attempt was made to link the aid effort to media coverage (90% of aid came to Somalia after the story broke in the media), perhaps to show causation. But, the writer admits that ultimately the visualisation can only show the overlap or correlation, which the writer further notes is itself consistent with academic debate over the existence of the “CNN effect”.

Credit for the piece goes to Claire Provost, Irene Ros, Nicola Hughes, and the Guardian Interactive Team.