Adding Guided Context to Maps

Maps are cool. They show the geographic distribution of data. And that is fantastic if there is a story in said distribution. But even if there is a story, sometimes given both the scale of the map and the amount of data encoded in the map, how could you possibly expect to find the story? Which little region of the map do you search to find the interesting nuggets?

On Sunday, the New York Times published an interesting solution to that very quandary. The context is an article looking at the anger and resentment felt by some towards government assistance via the social safety net, and yet how these very same people depend upon that safety net through programmes like Social Security, Medicare, Medicaid, &c. The map, a choropleth, examines several different metrics that comprise government assistance, e.g. Medicaid payments as a percentage of income.

Government benefits overview

One can easily toggle through the various metrics at the scale of the entire United States. This is a rather standard feature for such maps. However, in the upper-left corner, the designers placed a ‘guide’ that provides context and stories for each metric. But, not only does the guide provide text to support the map, but it zooms in on specific areas and regions that then support the text and best exemplify the point.

Here we see the map of the whole US for Medicaid, which appears to be scattered pockets of higher percentages. Interesting perhaps, but the user likely has few ideas as to what that visualisation actually means.

Medicaid's broad overview

Compare that to the guide’s view of the map, which focuses on the large cities on the East Coast.

Medicaid's eastern core context

Providing context and guiding a reader/user through the stories contained in the map, or at least those deemed interesting by the designers and editors, is an interesting solution to the problem of finding the story in maps such as these. However, by moving away from a strict visualisation of the data, the New York Times and others that try similar avenues introduce human biases in the story-telling that may otherwise be unwanted or distracting.

Credit for the piece goes to Jeremy White, Robert Gebeloff, Ford Fessenden, Archie Tse and Alan McLean.

Comparing the (Display of) Results in Colorado

Mitt Romney lost badly last night. No way around that. But as I watched the results come in through various sources, I noticed two interesting design decisions that made me think; one from the Guardian (the British perspective), and the other from the New York Times.

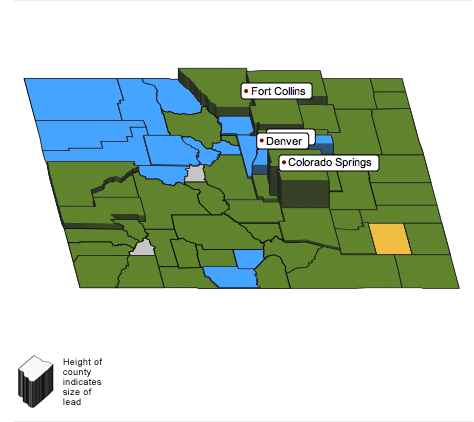
Using only Colorado as an example, here is the map of county results by the Guardian.

Results map from the Guardian

Note how the map is presented in 3-D that therefore allows the use of height as another encoded variable, in this case the size of the lead. Now compare that to the map used by the New York Times.

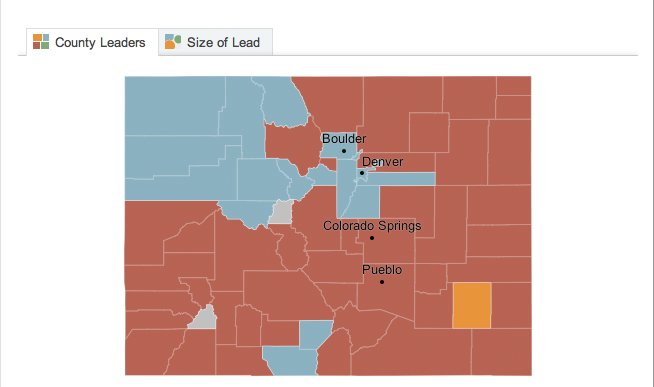
Results map from the New York Times

Note how this map is flat. So much less cool, right? But try to compare the results in Denver County. When I look at the Times’ map, I see blue; Mitt Romney won. When I look at the Guardian’s map, I see…actually, I can’t. That label is in the way. And then even when I begin to interact with the map, Denver County is hidden by the height of Arapahoe County.

But what about the size of the lead? I cannot see that encoded in the New York Times map. No, one cannot. However, they added a toggle function to change the data displayed on the map—though the utility of that view can be left for another discussion.

And now to a minor point about comparing the totals.

Again, a look at the Guardian’s presentation.

Results table from the Guardian

And now the New York Times. Numbers are numbers and faces are faces. But look at the graphic element representing the percentage. With the Guardian, I can just barely discern that the size of the circles for Santorum and Romney are not the same. And the same goes for Gingrich and Paul. But when I look at the Times’ presentation, I see a simple bar chart that more clearly shows the relationships between the results.

Results table from the New York Times

So interesting design decisions lead to one view that I find far more successful in showing the data: the New York Times.

Florida Primary

The Republican primaries…they’re still going on…on the long inevitable road to Romney’s coronation. Next up is Florida, always an interesting state to watch. There are a lot of people there with a whole host of interesting demographic slices. Perhaps one of the most interesting ones, at least to the media, is the Hispanic vote. Other things to look at in Florida include the burst housing bubble and rather high unemployment.

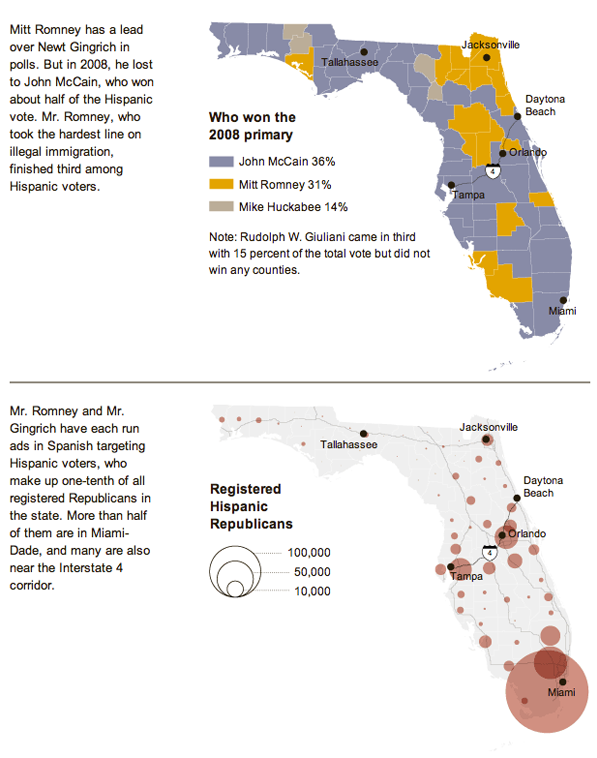
The New York Times published a graphic with a few maps and charts trying to paint the landscape of the Florida primary battle. These two selections below show which Republican primary candidates won which counties in 2008 as well as the size of the Hispanic population registered Republican.

Florida primary landscape

Credit for the piece goes to Haeyoun Park.

The Family Tree of Kim Jong Il

Kim Jong Il is dead. And nobody really knows what is going to happen in North Korea.

But, what we do have, is the interactive family tree of Kim Jong Il, courtesy of the BBC. Select individuals are clickable and have short biographical sketches. Unfortunately, the tree has been simplified for clarity and it does not contain all members of the family.

The family tree of Kim Jong Il

The Rise of Newt

The Iowa caucuses are quickly approaching. And that means for many candidates a scramble to gain as many supporters as possible and then convert their poll ratings into votes. For the Republicans, this has been a truly topsy-turvy cycle with the distant refrain of “anyone but Mitt” echoing in the background.

So, here we are looking at the return of Newt Gingrich. Over the weekend, the New York Times published a graphic comprised of small multiples of poll numbers for the various candidates. Each chart plots the individual polls and then the moving average.

The rise of Newt Gingrich

What one can clearly see is a moving wave of discontent. It begins small with Michelle Bachmann before rising with the arrival of Rick Perry. He floundered, however, and was soon overtaken by Herman Cain. And as his support ebbed, it buoyed Gingrich to the top or near-top, depending on the poll, of the Republican candidates.

All in all, a good series of charts that tells a convincing story rather quickly and succinctly.

The Finances of Social Security

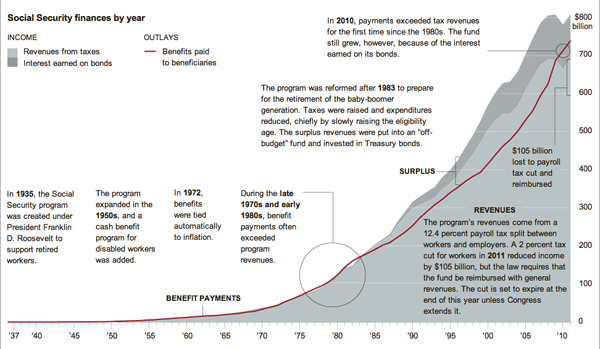
Simple graphs can tell great stories with little annotations. This graphic by the New York Times illustrates that point well with a stacked line chart set behind a line on the same scale. The two should match, or at least the red should be beneath the greys. When they don’t, you have a story and the Times calls it out.

Social Security Revenue vs. Expenditure

Technology Today

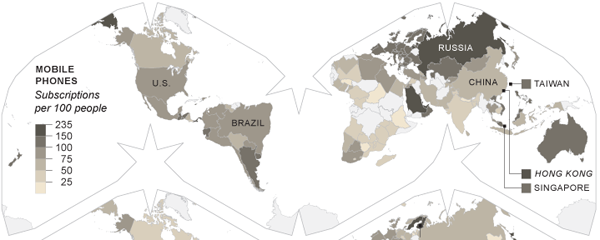
Technology changes and changes rapidly. The United States led the way with cabled phone networks. Now, countries in Africa are skipping landlines and moving straight to mobile phones. The New York Times has an piece on the changes in technology and accompanies that piece with small multiples of choropleth maps that showcase different technologies and their prevalence.

Mobile Phone Subscriptions

What is interesting about these maps is that the Times eschewed the conventional Mercator or Robinson map projections and went with a slightly more unusual layout. But, a layout that saves some space by its contortion of the world’s oceans. Was their reason spatial or something more about maintaining consistent area? I would be curious to see the piece in print to see if it needed to fit a narrow column.

All in all, an interesting set of maps.

Campaign Ad Spends

I don’t know about you, but to me, it’s beginning to look a lot like campaign season. At least from what I read on the internet. Because, according to this interactive piece by the Washington Post, there has been little local campaign spending on ads in the Chicago television market.

Mad Spending
Mad Spending

By clicking on the left, you are able to see the spending amounts and spending places of ads by both personal campaigns and interest groups. For national ad campaigns, there is a small outline of the continental US in the bottom left.

Above the map you have some facts about the spending and spending over time and a curious bit about whether the ads are positive or negative. Already if you move from the beginning to now, you can watch the positive ad number slip.

Maps of the Democratic Republic of the Congo

The Democratic Republic of the Congo is preparing for elections at the end of the month. For decades since independence from Belgium, the country has been beset by insurrection and civil war. Eastern portions of the country are all lawless and beyond the control of the government in the capital Kinshasa. Yet, DR Congo, which is almost the size of all of Western Europe, holds vast mineral and energy reserves.

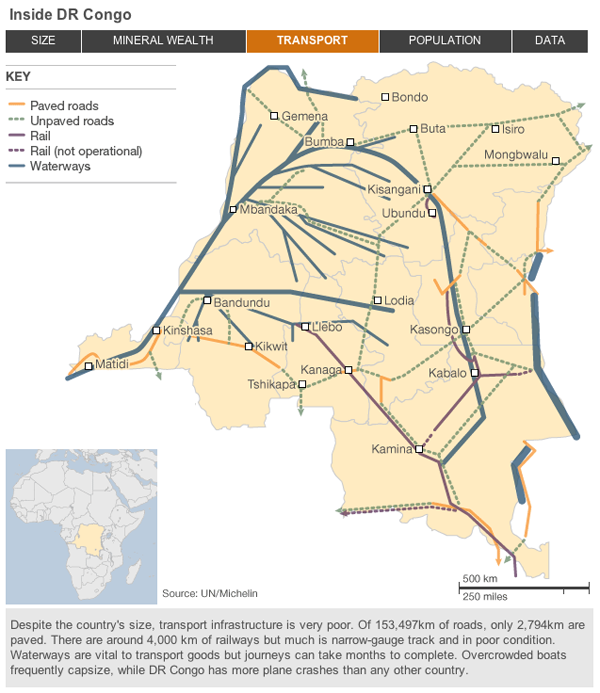
Much like with the independence of South Sudan, the BBC has released a small interactive piece detailing DR Congo through maps. While not as extensive and lacking in visualising anything about the warfare and bloodshed, the piece is useful to gain a brief insight into the complexities of the country and the sheer scale of its problems. But that is not wholly surprising as the title of the piece is Failed State: Can DR Congo Recover?.

Screenshot of a guide to DR Congo