In a good example of comparing share versus actuals, the National Journal looks at the state of debt across the United States. The choropleth map shows adult share of debt while the bar charts show the regional value of said debt. While the south holds more debt, the west and east coasts have more debt. They also, however, have higher incomes that make servicing or paying off said debt easier than lower income adults in the south.
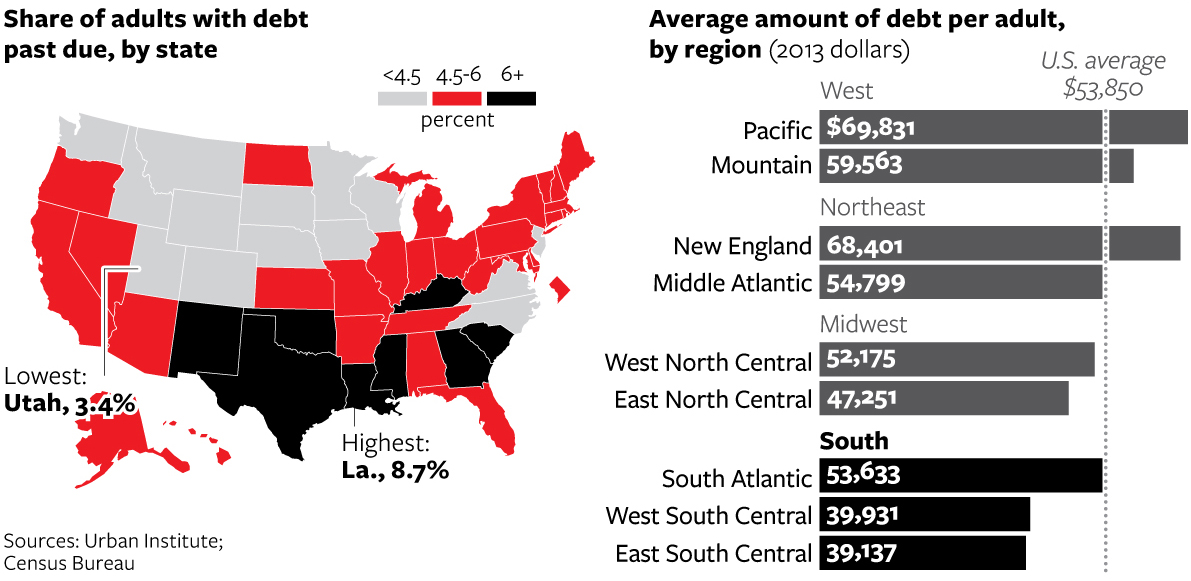
Credit for the piece goes to Nancy Cook and Stephanie Stamm.