Everybody Wants to Rule the (Top of the) World

To the victors go the spoils of war. Often unheralded of course is the spoil of drawing the new map. But, in and among the Himalayas, the territory of Jammu and Kashmir is yet to be won decisively by any side. Look at 1947, 1965, and 1999, we still have the territory contested and different parts controlled by different countries.
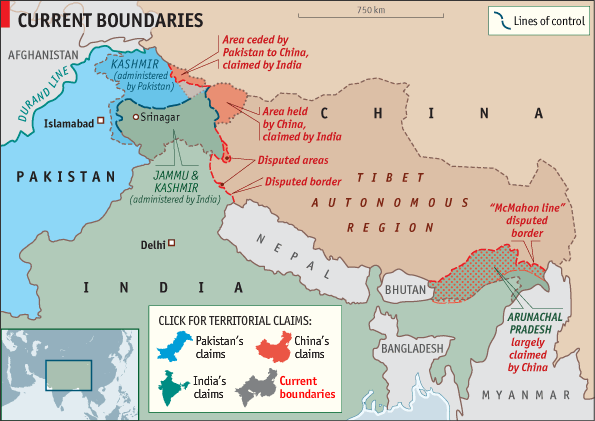
The current boundaries in Kashmir

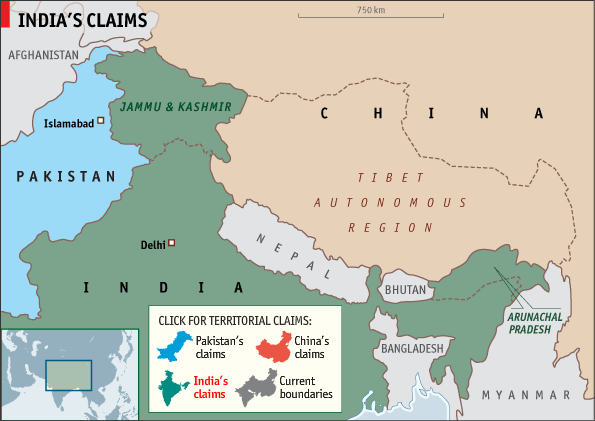
The Economist, noting the potential flashpoint, created an interactive map to highlight the region and the situation, wherein one can view the different claims and how they overlap. Nothing particularly fancy, but it need not be to clearly communicate the fact that Jammu and Kashmir is mess of the most sovereign order.

However, the interesting bit of the story is how in India the government, which claims the entirety of the territory, censored the print-edition of the Economist wherein the conflicting claims and current lines-of-control were drawn with a sticker because the map was incorrect, to use the BBC’s word, as it showed the region divided between India, Pakistan, and China.

Note here the Pakistani claim versus the Indian claim—I shall leave you, the reader, to investigate the differences between the Chinese claim.
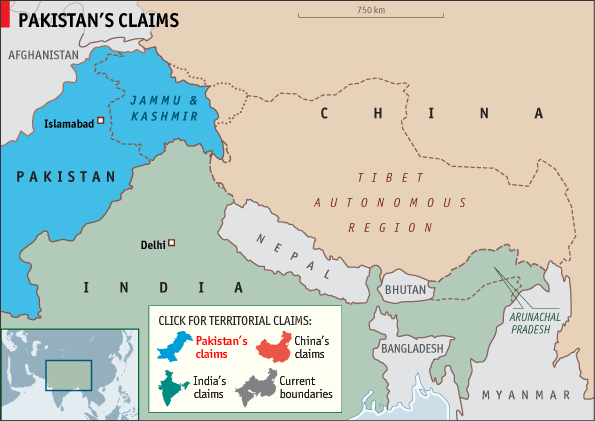
The Pakistani claim
The Pakistani claim
The Indian claim
The Indian claim

Year of the Tornado

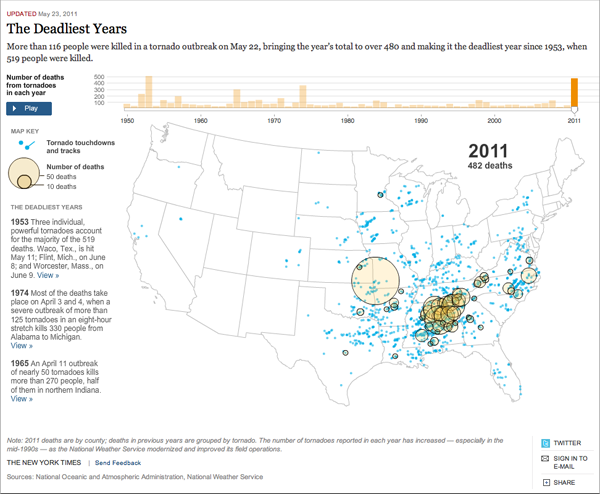
2011 appears to be the year of the tornado, with killer tornados roaming from Birmingham, Tuscaloosa, and small towns in the deep South now to Joplin, Missouri. The latter now holds the record for being the most deadly, 117 confirmed deaths, in US-recorded history.

The New York Times, in its coverage of the aftermath—and the potential for more destruction with the forecasted weather—has mapped, charted, and animated data from the National Weather Service (NWS) and the National Oceanic and Atmospheric Administration (NOAA) to illustrate the totality of the devastation witnessed this year.

The piece makes use of a map to illustrate where tornados struck and then their subsequent track, relevant geographic data, and that matches that with known fatalities using the always popular area of a circle datapoints. I am less keen on these for their cross-comparable nature, but here, in this instance, that is less the focus than the overall number of deaths and their locations. Then we also have the dataset over time with the noted caveats that, one, only in 2011 are deaths linked to counties rather than tornados as in all years past and, two, that as our ability to detect and record tornados has increased, we have more data with which to work. In short, it is not necessarily true that 1953 had less tornados than 2011.

Screenshot Detailing 2011 Tornados

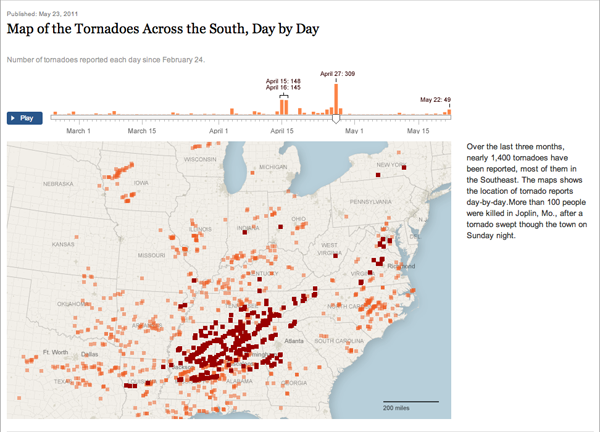
Given the severity of the current year, and this outbreak in particular, the New York Times also created a smaller, but by no means lesser, piece to highlight just those tornados striking the Southeast. This piece maps the tornados by touchdown, date, and time. Omitted is data on fatalities or damage. However, this piece complements the larger, broader view of the above by breaking down the 2011 year, thus far, into increments of days. This is a great complementary piece that, by being separate from the first piece, allows each to shine in its own respective area.

The Outbreak of 27 April

Credit to this second piece goes to Archie Tse, Matt Ericson, and Alan McLean.

Obama and His Irishness

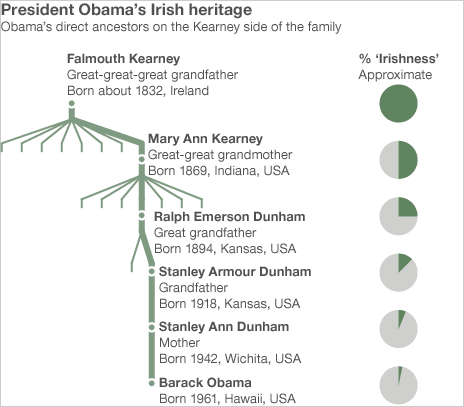
Ireland, the ancestral land of many Americans, can also be claimed by President Obama. His maternal great-great-great-grandfather was a shoemaker. The BBC created this graphic to complement their news article. And I must admit to being quietly amused at the % ‘Irishness’; Approximate label.

The Irishness of Obama

(Insert 1/1000 Airplane Jokes Here)

Airlines merge. (As do many other companies, but those companies are not the focus of this post.) And often the mergers are complex. Lamentably, one cannot simply merge logos and be done. Here is looking at you, UAL Corporation (United Air Lines) + Continental Airlines Inc.= United Continental Holdings Co.—not that I particularly care for the United Continental logo mashup, I miss the Saul Bass logo for United.

Unfortunately there are things to worry about like getting planes to fly, not crash into each other, not to mention ticketing, unions, general technology…one hopefully gets the idea.

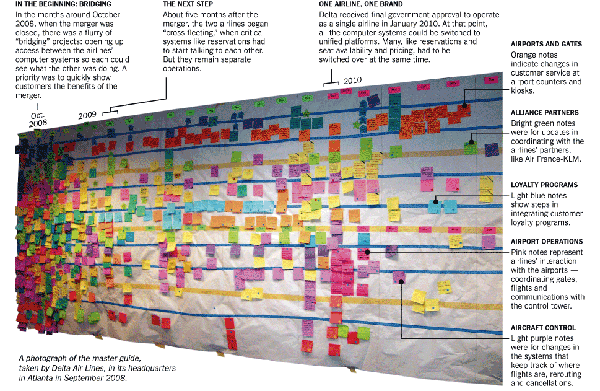
But for those of you who do not, an article in the New York Times about the merger of Delta and Northwest includes a graphic about the master guide to the whole process. Note the use of sticky pad paper. Each piece represents one project, with projects containing as many as a thousand separate tasks.

Merger Process Wall
Merger Process Wall

Updating Minard

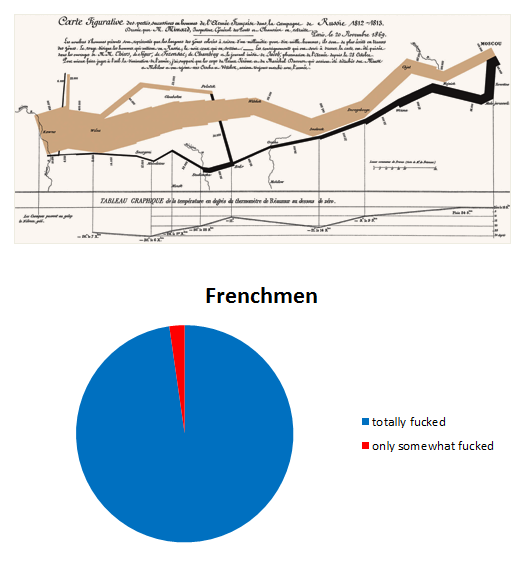
Yesterday, Chartporn posted a link to an OkCupid post about sex, specifically charts of sex. And yes, they are quite interesting and worth checking out. But, I enjoyed the humour at the outset, where they noted the brilliance of the pie chart as a modern chart form that can replace the classic Minard chart about Napoleon’s invasion of Russia.

Minard’s original at top, the modern simplification at bottom.

Minard's Infographic Redrawn

Credit for the work to OkCupid.

Royal Wedding Genealogy

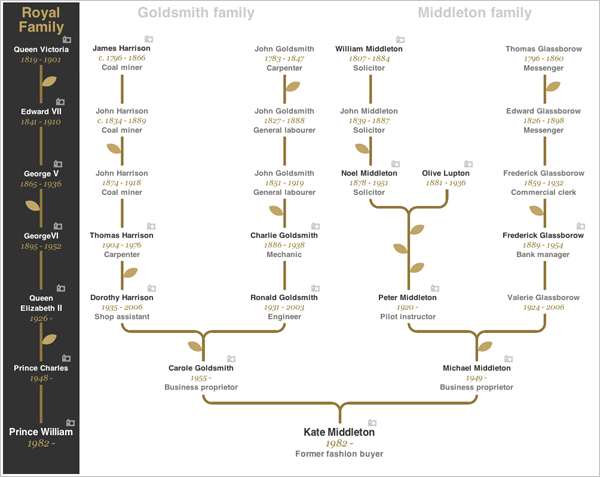
If you have not heard, somebody in Britain is getting married…and of course that means explorations of royal blood lines and, well, non-royal bloodlines. So the BBC put together a small piece on Kate Middleton’s ancestry. So for those of you with any interest in charting family lines, here you go. The piece has some interactive features, clicking on the folks with little cameras provides a brief bio or story and a photo—though not necessarily of the individual.

Kate Middleton Ancestry

Credit to the BBC.

Finnish Election Results

Finland held an election that was worth watching because of the rise of a nationalist party whose name translates to True Finns. The leader of the True Finns was interviewed and at the end he reassured all watching that they “are not extremists. So you can sleep safely.” For Europe, the issue is their opposition to the bailouts of the various European economies, such as Ireland and Greece. And now that Portugal is in the midst of bailout negotiations, the True Finns could complicate matters if they manage to make it into government.

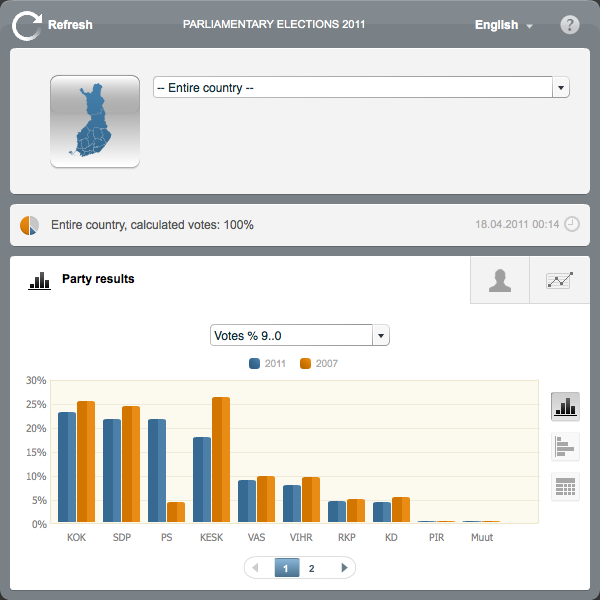
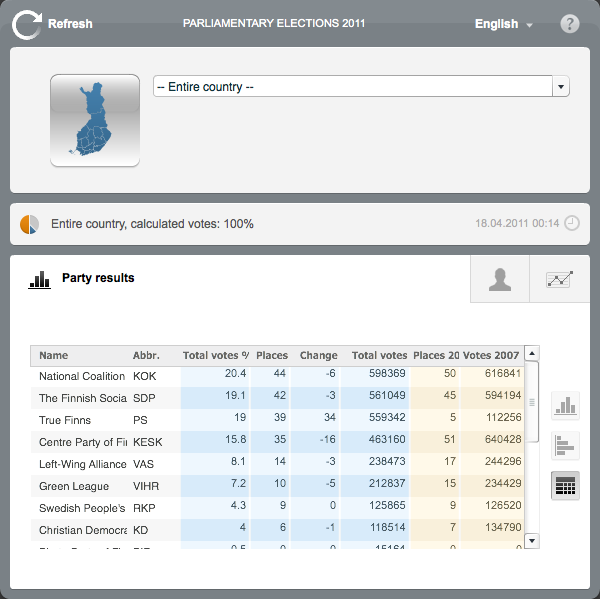
The Finnish Ministry of Justice released a small, interactive piece detailing the results. The parties are represented by acronyms, with PS for the True Finns. And here one can see that they performed third-best with about 19% of the vote. The True Finns actually beat the Centre Party, which was the leading party in the last coalition government. In short, a remarkable rise whose impact is yet unknown.

Overall Vote in Chart Form

The interactive piece, however, is a tad confusing. While one story is certainly the improvement of the True Finns from the last election to the current one, does that need to be shown in the default view as we have here? And what I perceive to be shading or some sort of split colouration in the bars lends itself to the idea of having two separate sets of data encoded in the bar. Although I can see no such data and am thus confused.

But, fortunately, one can also change one’s views of the data, from column to bar to table. And I daresay that the table, in this instance, I find best. Not because the data could not be visualised in an interesting, compelling and comprehensible fashion, but because it was not.

Overall Vote in Table Form

Certainly, the election results provide interesting data sets. And in this case we clearly have an interesting story, the rise of the True Finns from a small, rural party of 5 seats in the Finnish parliament (200 total seats) to the third-largest party with 39 seats. Alas, this piece leads does not make it easy to tell that story—let alone the results of the election.

RMS Titanic, 99 Years Ago

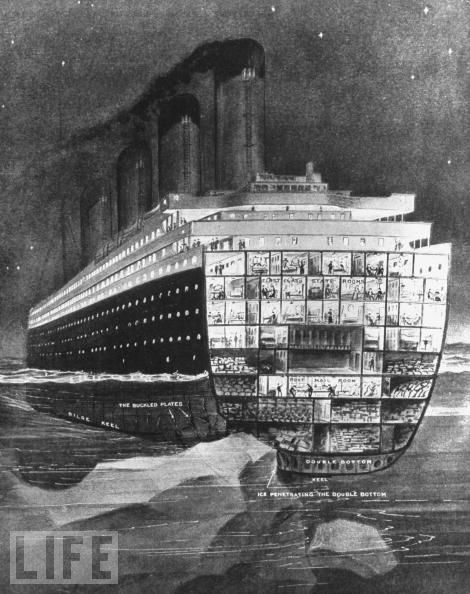
99 years ago today, the RMS Titanic sank in the North Atlantic with more than 2/3 of the over 2200 passengers losing their lives. The ship was rather state-of-the-art and was considered remarkably safe with more lifeboats than was legally required for the passengers and crew. She also had a number of watertight bulkheads that could contain flooding and keep the ship afloat even if a remarkable total of four such compartments were flooded.

TItanic Cut Away Where the Berg Hit

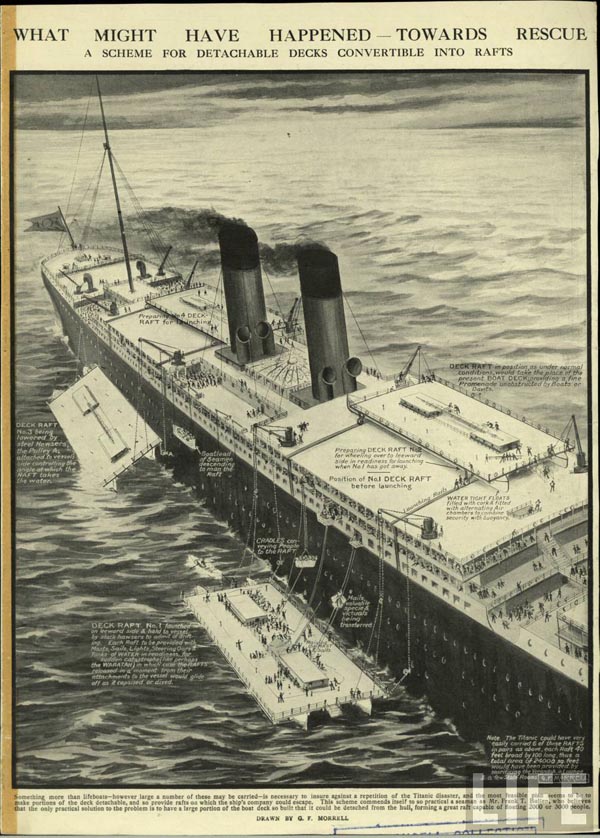
But as we all know, the iceberg, frigid water, and brittle steel combined to flood not four, but six compartments. And while more than legally sufficient, the number of lifeboats and passenger space was insufficient to save all the passengers. This illustration, by G.F. Morrell details how floating catamaran deck rafts could have saved lives.

Proposed Change to Ship Design

All photos from Life.