What Will the Next Recovery Look Like?

Earlier this morning, the Bureau of Economic Analysis released its US 2nd quarter GDP figures and the news…isn’t great. On an annualised basis, we saw -32.9% growth. That’s pretty bad. Like Great Depression level bad. I’ve posted on the social media how bad this current recession is and how nobody in the workforce today worked or didn’t through the Great Depression to really relate to the numbers we are seeing.

But that’s all today. The sun will come out tomorrow. (And scorch the Earth as climate change renders certain parts of the globe uninhabitable to mankind. But we’ll get to those posts in later weeks.) And when it does come out, eventually, what will the recovery look like? I’ve seen a few mentions recently in the media of a V-shaped recovery. What is this mysterious V-shape?

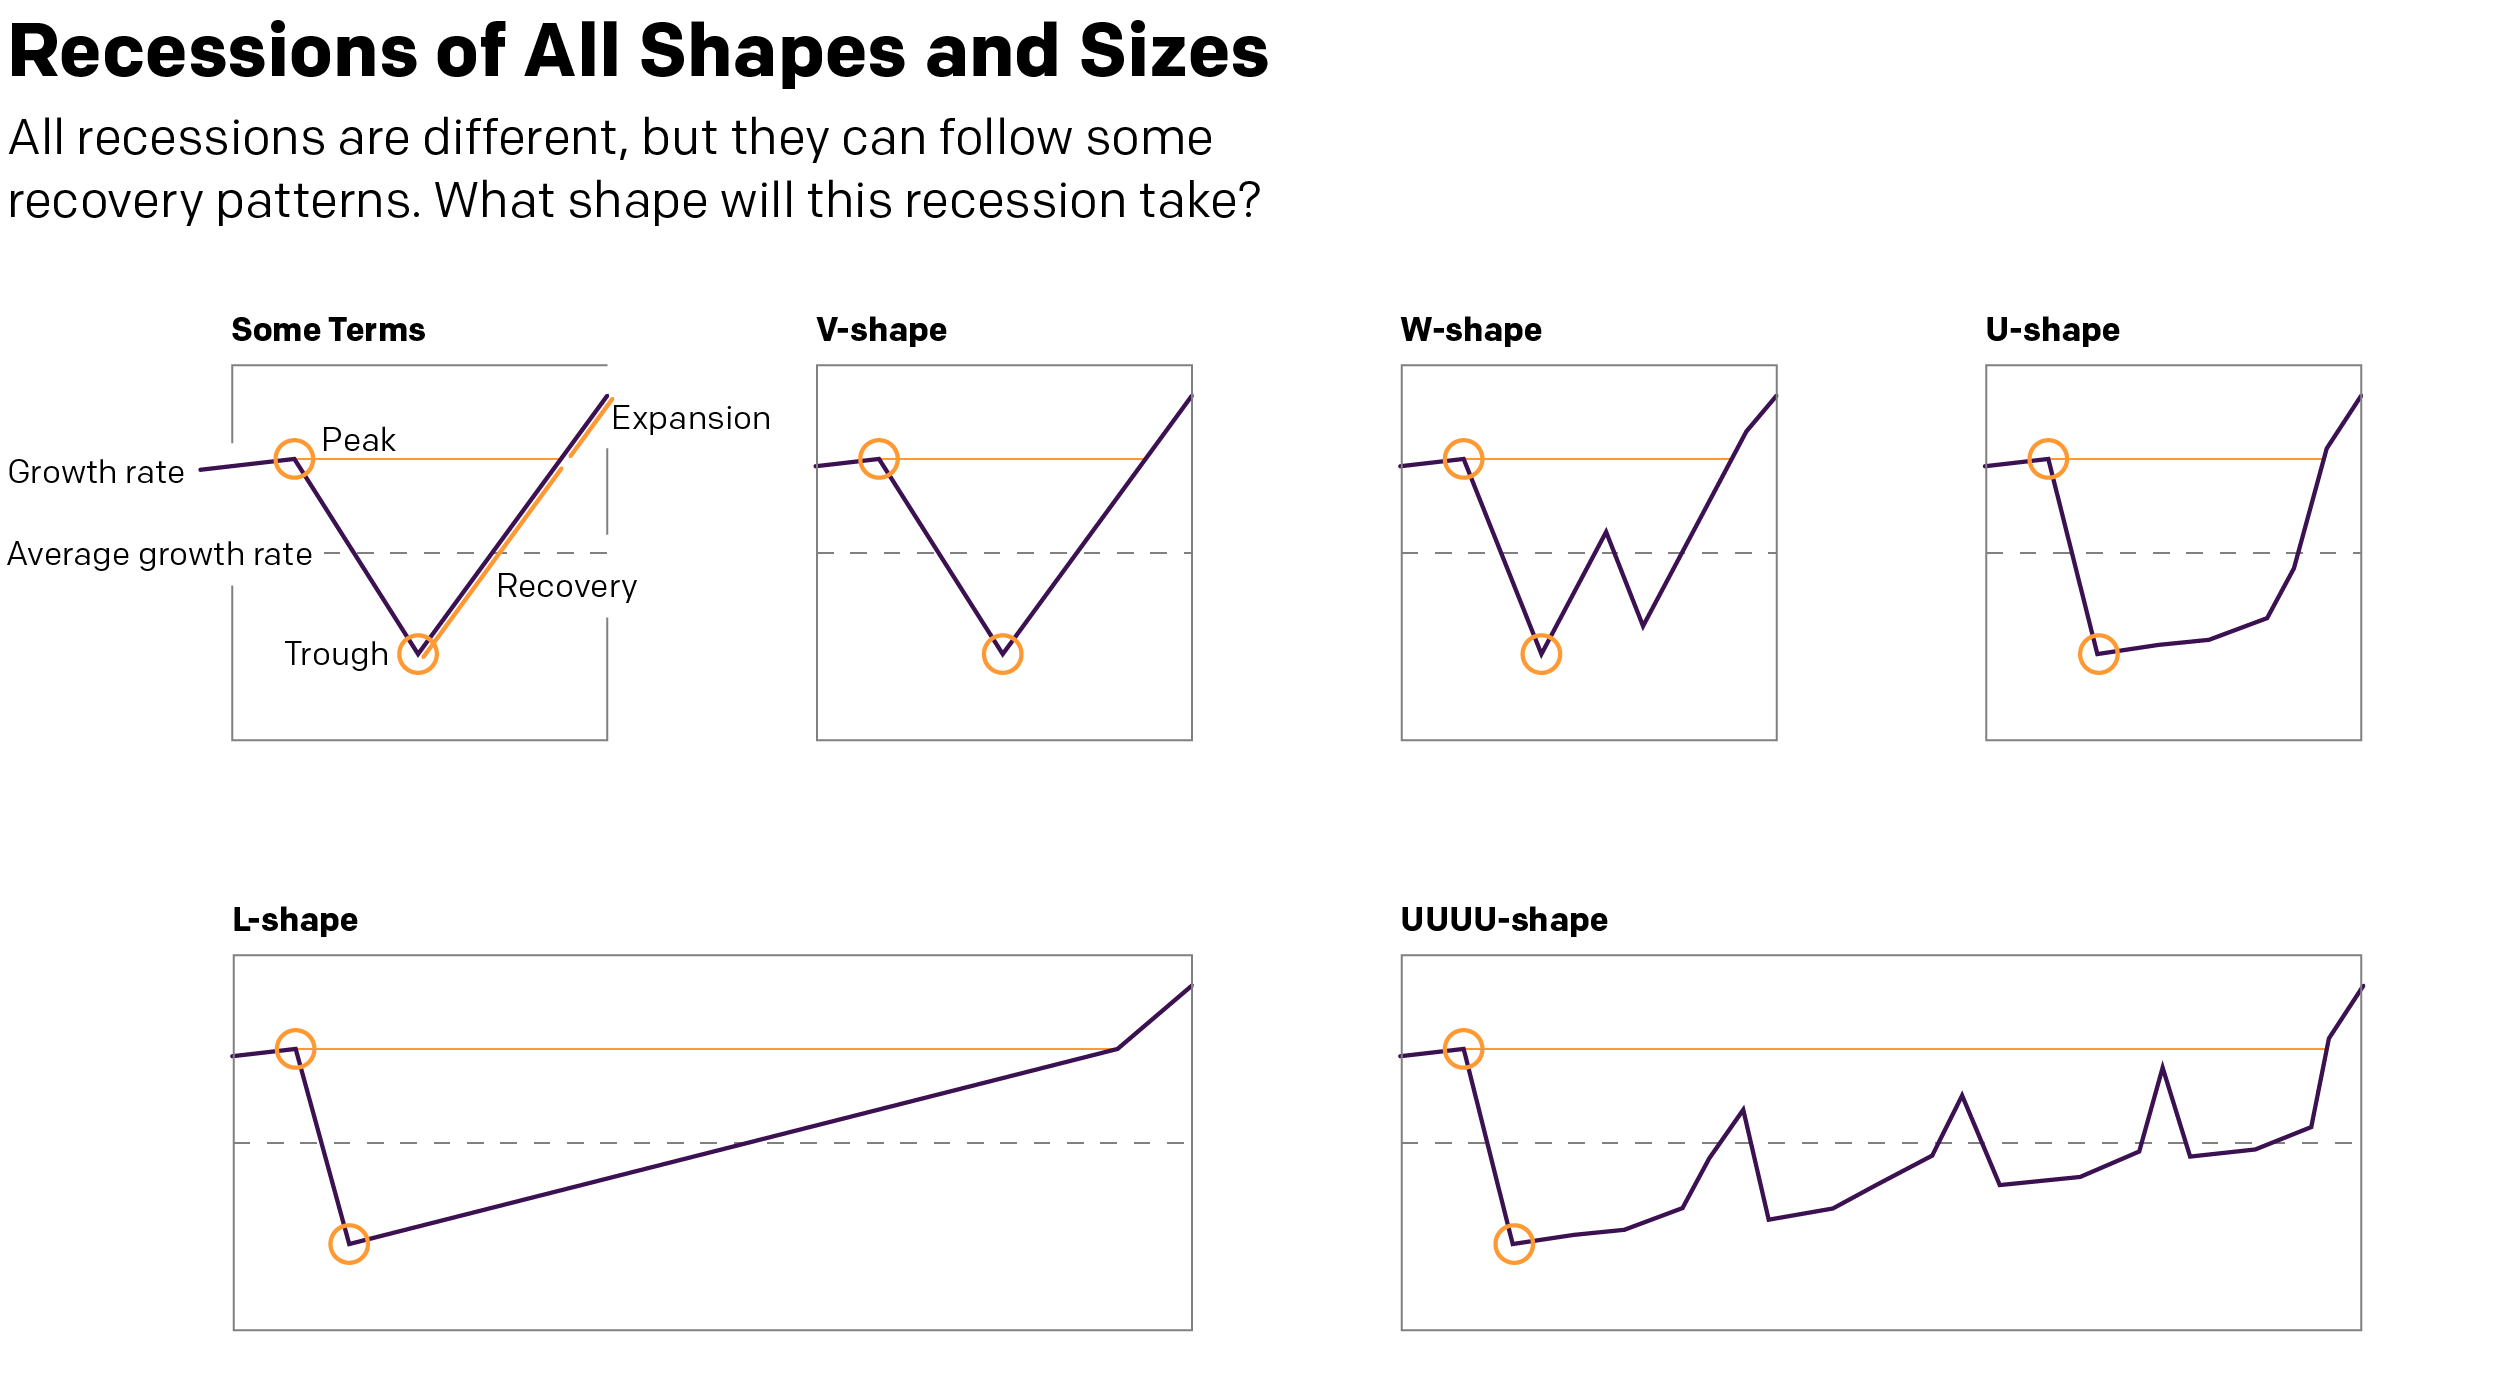
A long time ago, in a galaxy far away. Or during the last recession in Chicago, I worked with some really smart people in some of my professional projects and we covered the exact same question. There are a couple key “shapes” to an economic recovery. And when we say recovery, we mean just to return to pre-recession peak levels of growth. Anything above that is an expansion. That’s what we want to get back to.

What kind of shape will the recovery take?
Who knew typographers loved economics?

The V-shape we hear a lot about is a sharp recovery after the economy bottoms out (the trough). Broadly speaking, if a recession has to last two consecutive quarters (it doesn’t, but that’s a pretty common definition so let’s stick with it), then in a V-shape, we are talking about a recovery one or two quarters later.

Similar to the V is the W-shape, where things start to improve rapidly, but some kind of shock to the economic system and things go back negative once again before finally picking up quickly. It’s not hard to imagine something going horribly wrong with the Covid-19 pandemic to be just that external shock that could push the economy back down again.

Similar still is the U-shape. Here, after hitting rock bottom, growth isn’t quite as quick to pick up as we linger in the depths of the valley of recession. But after a bit of time, we again see a rapid recovery to pre-recession levels of growth.

These are all pretty short term recoveries, the W being a little bit longer because two sharp downturns. But they are nothing compared to what’s also possible.

First we have the L-shape. Here, after hitting bottom, things start to recover quickly. But that recovery is slow and takes a long time. Growth remains slower than average, creeping up to average, and then still takes its time to reach pre-recession levels. Is something like this possible? Well, if vaccines fail and if some countries still can’t get their act together (cough, US, cough), the willingness of consumers to go out, eat, drink, buy things, travel, and generally make merry could be suppressed for a long time. So it’s certainly not out of the question.

And then lastly we have the UUUU-shape. Though you could probably add or subtract a U or two. This features more drawn out stays at the bottom of the valley with quick and sharp upticks in growth. But those growths, never reaching pre-recession levels, also collapse quickly back into declines, though also never really reaching the same depths as earlier. Essentially, the recovery faces multiple setbacks knocking the economy back down as it sputters to life. As with the L-shape, it’s also not hard to imagine a world where a country hasn’t managed to contain its outbreak struggling to get back on its feet.

What do you think? Are we at rock bottom? Did I miss a recovery type?

Credit for the graphic is mine.

All the Little Spacecraft

Early tomorrow morning, weather permitting, NASA’s Perseverance rover will blast off from Cape Canaveral on a six-plus month trip to Mars. There, hopefully it will land successfully and join all the rovers that have come before.

And so this piece from the New York Times feels appropriate. It’s a great illustration of all the spacecraft we have sent into space, including the active and inactive, with some notable exceptions.

What spacecraft are in orbit of Earth and headed to Mars.

I really like how it pays attention not just to the planets and their satellites (like the Moon), but also the comets, asteroids, and even the Lagrange points. And it does this all with small illustrations of the spacecraft.

Credit for the piece goes to Jonathan Corum.

African Descent in African Americans

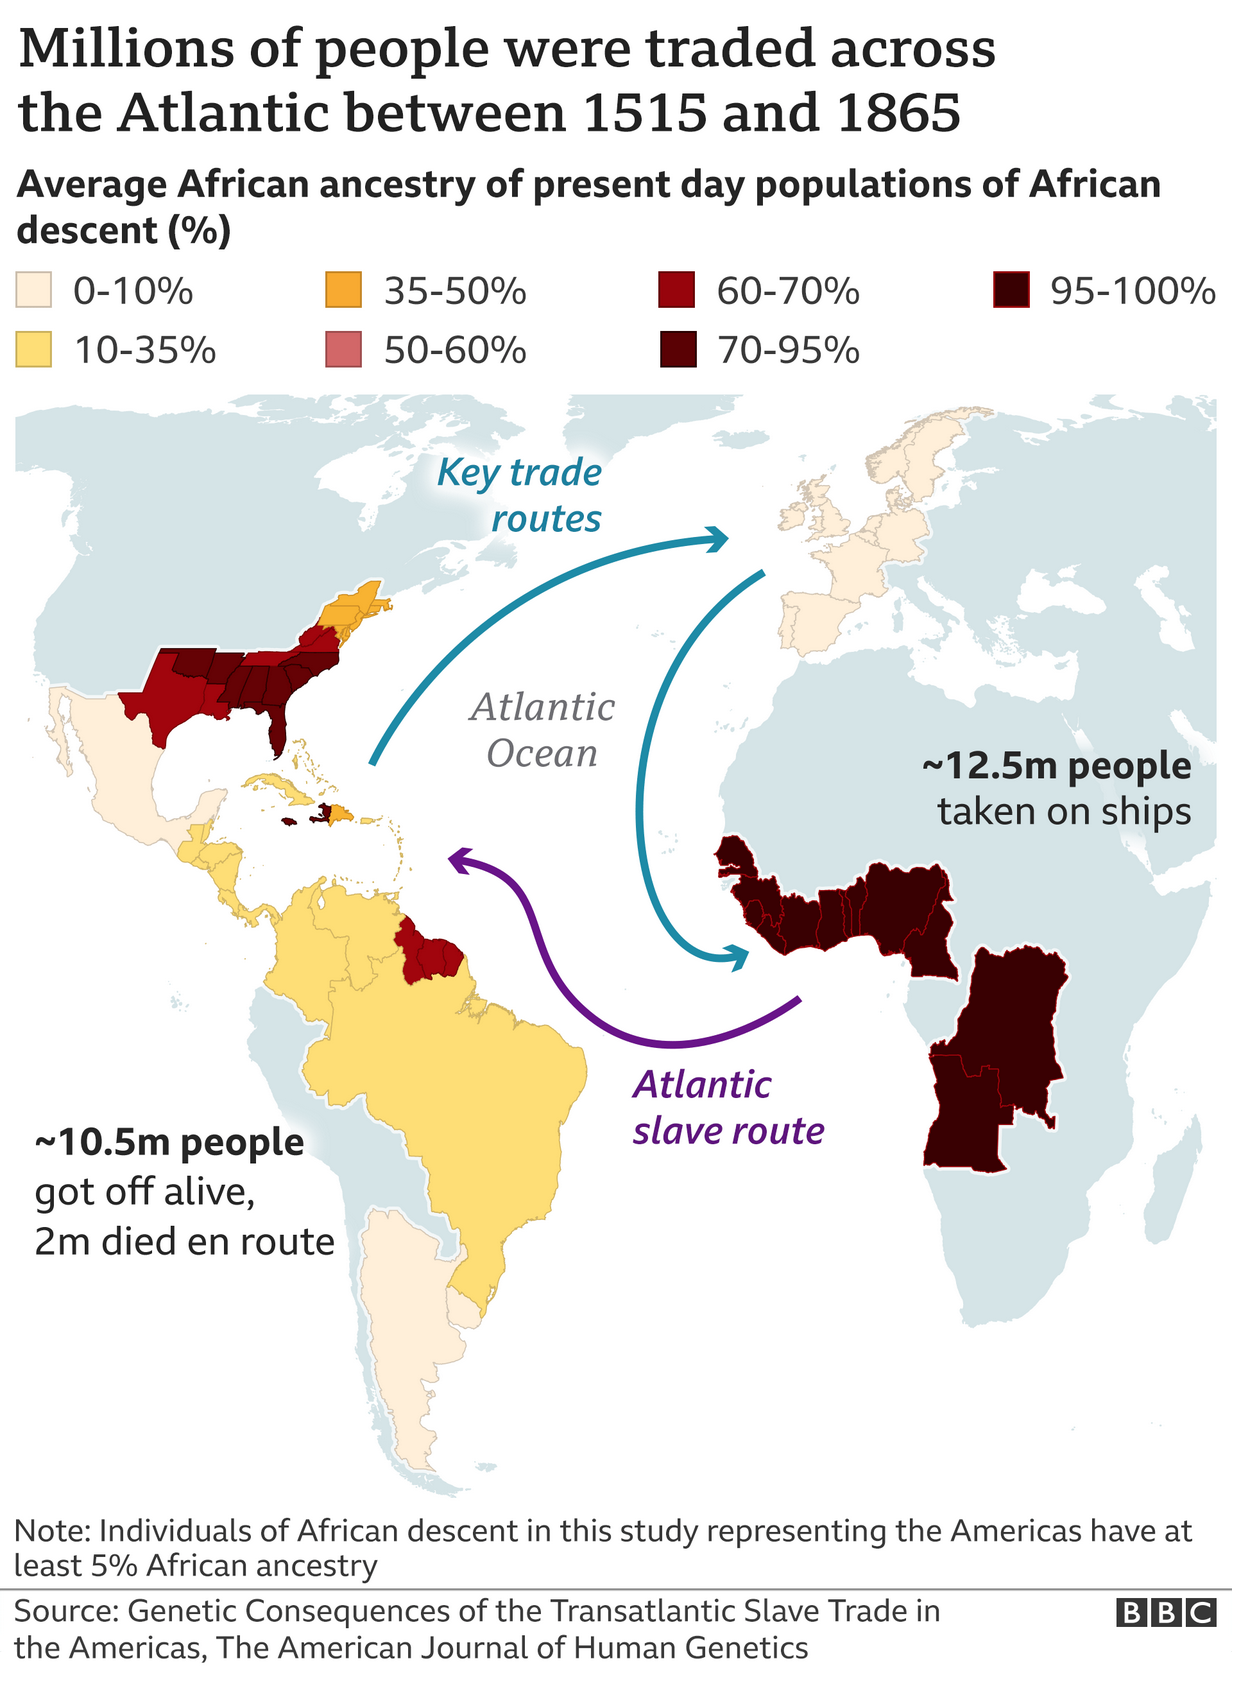
A study published last week explores the long-lasting impact of the Atlantic triangle trade of slaves on the genetic makeup of present day African Americans. Genetic genealogy can break down many of what we genealogists call brick walls, where paper records and official documentation prevent researchers from moving any further back in time. In American research, slavery and its lack of records identifying specific individuals by name, birth, and place of origin prevents many descendants from tracing their ancestry beyond the 1860s or 50s.

But DNA doesn’t lie. And by comparing the source populations of present day African countries to the DNA of present day Americans (and others living in the Western hemisphere), we can glean a bit more insight into at least the rough places of origin for individual’s ancestors. And so the BBC, which wrote an article about the survey, created this map to show the average amount of African ancestry in people today.

Average amount of African genetic ancestry in present day populations of African descent

There is a lot to unpack from the study, and for those interested, you should read the full article. But what this graphic shows is that there is significant variation in the amount of African descent in African-[insert country here] ethnic groups. African-Brazilians, on average, have somewhere between 10–35% African DNA, whereas in Mexico that figures falls to 0–10%, but in parts of the United States it climbs upwards of 70–95%.

In a critique of the graphic itself, when I look at some of the data tables, I’m not sure the map’s borders are the best fit. For example, the data says “northern states” for the United States, but the map clearly shows outlines for individual states like New York, Pennsylvania, and New Jersey. In this case, a more accurate approach would be to lump those states into a single shape that doesn’t break down into the constituent polities. Otherwise, as in this case, it implies the value for that particular state falls within the range, when the data itself does not—and cannot because of the way the study was designed—support that conclusion.

Credit for the piece goes to the BBC graphics department.

Sunday’s Covid Numbers

I do not want this blog to become a permanent Covid-19 data site. So in my push to resume posting last week, I tried to keep to from posting the numbers and instead focused on discussing how the data is displayed.

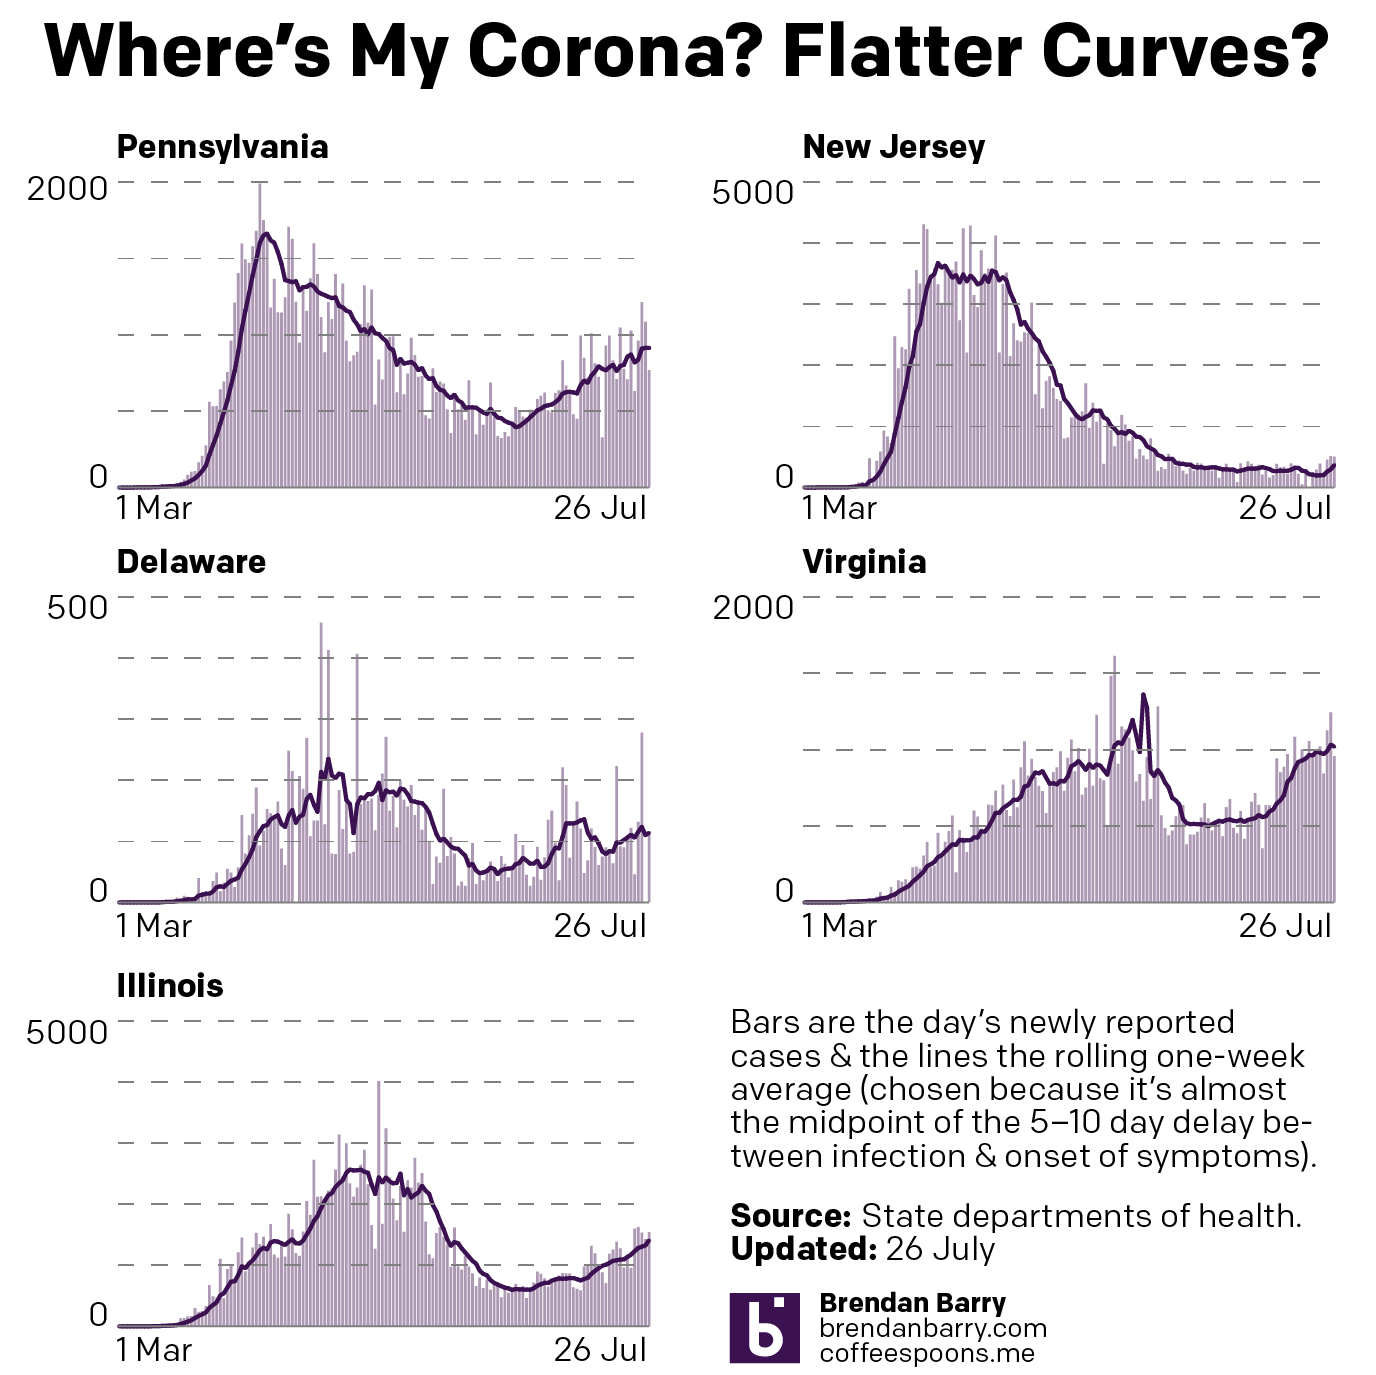
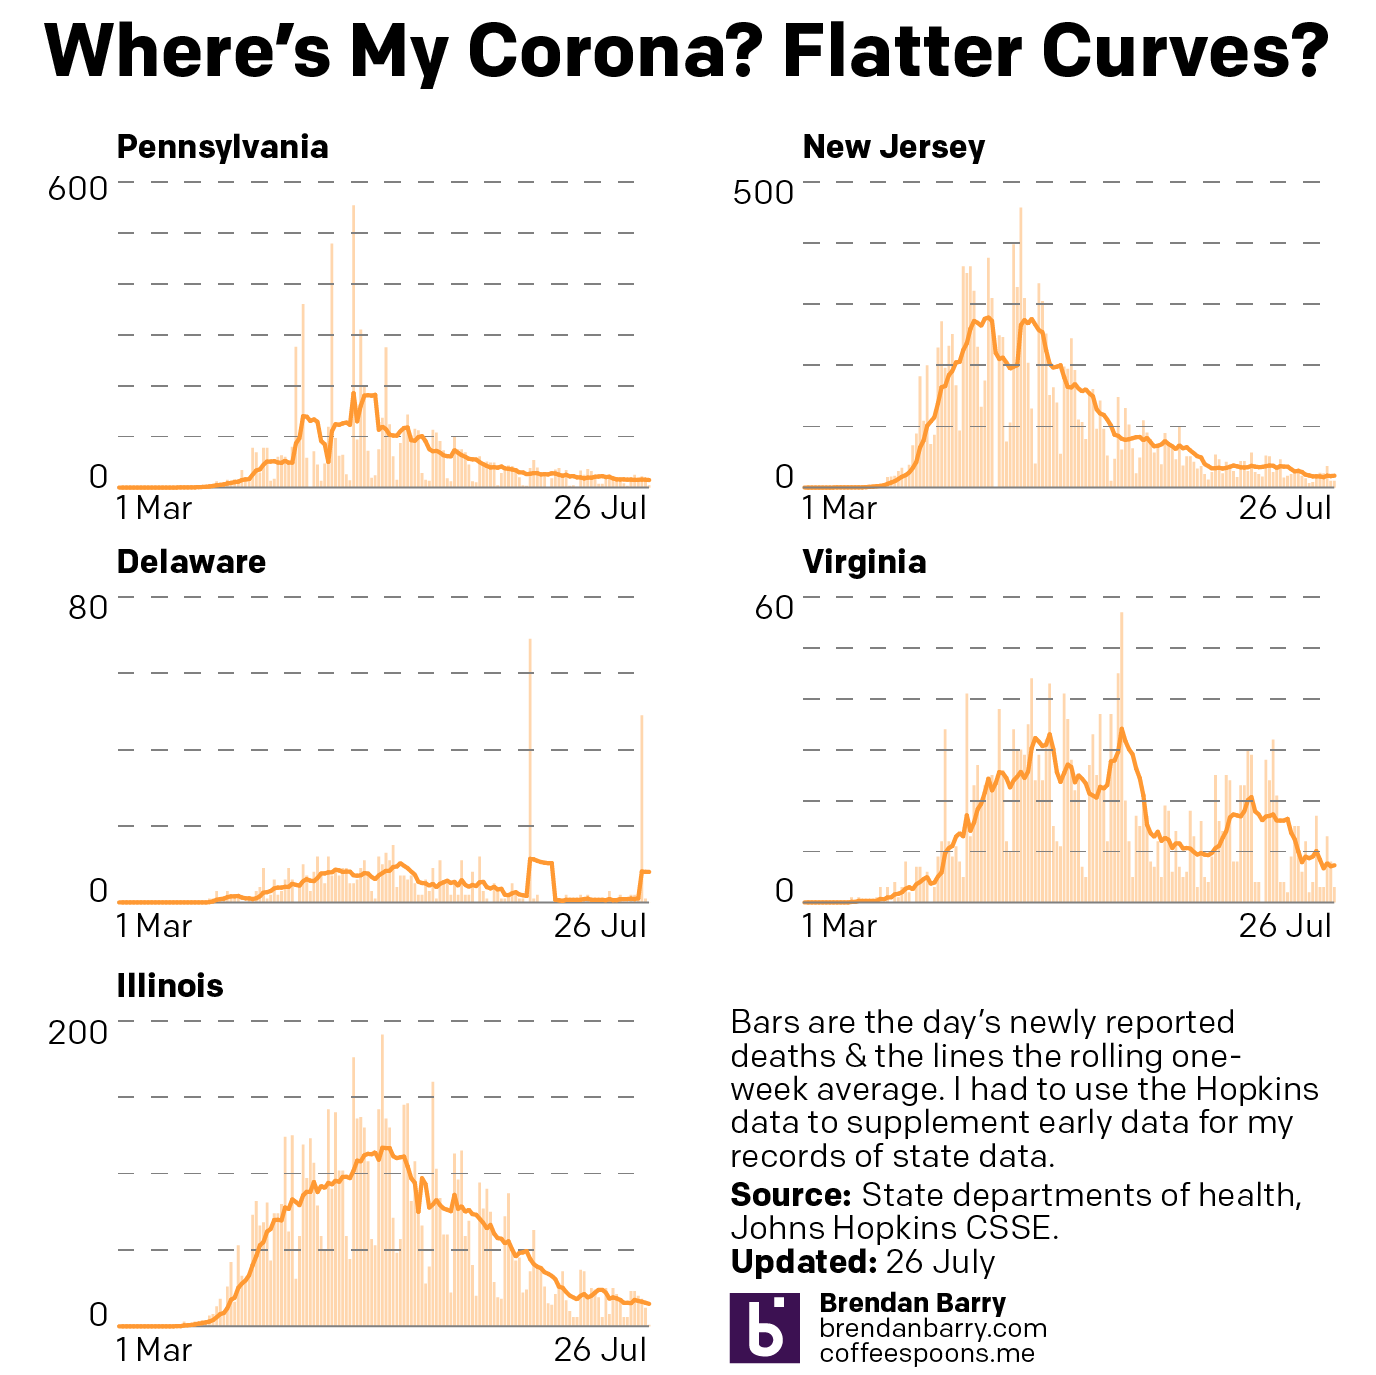
But I hear from quite a few people via comments, DMs, emails, and text messages that they find the graphics I produce helpful. So on the blog, I’m going to try posting just one set of graphics per week. Will it always be Monday? I don’t know. On the one hand, new week, new data. But on the other, weekend numbers tend to be lower than the rest of the week and could make it seem like, yay, the numbers are starting to go down especially if you only come to my blog and only see this data once a week.

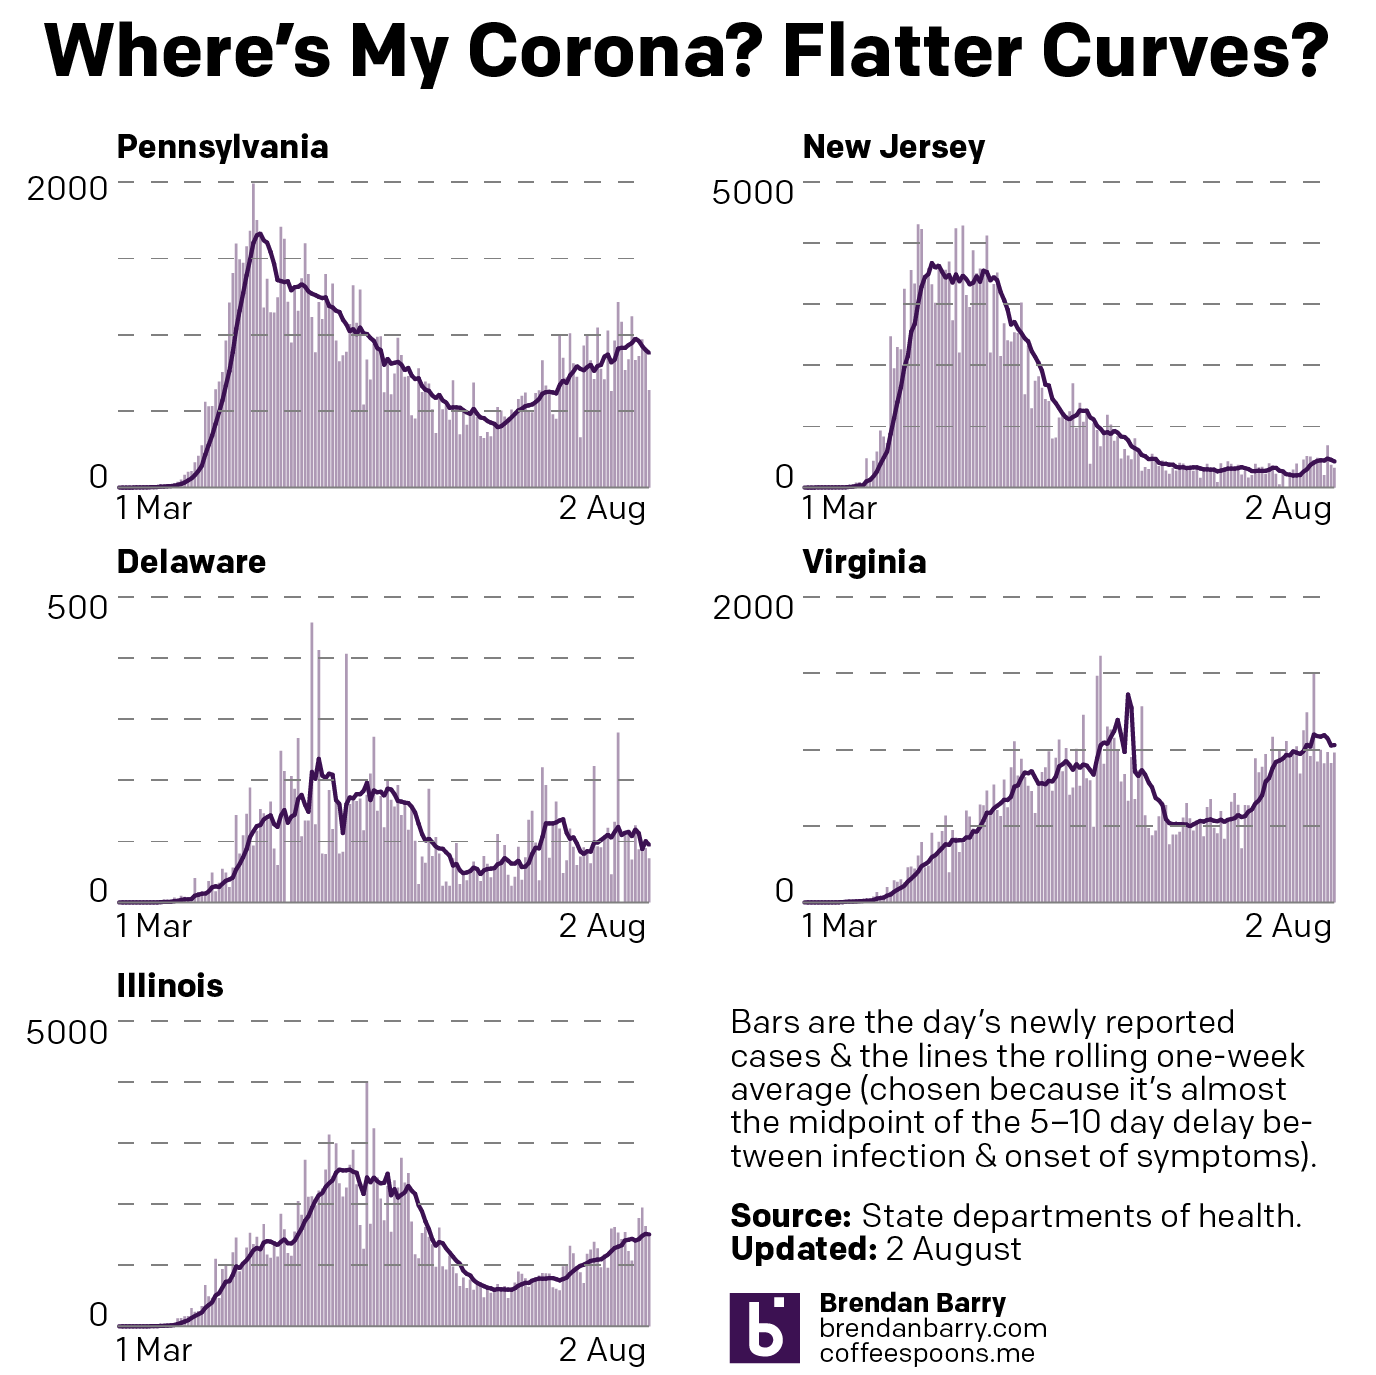
Daily cases and their rolling average for Pennsylvania, New Jersey, Delaware, Virginia, and Illinois
Daily new cases
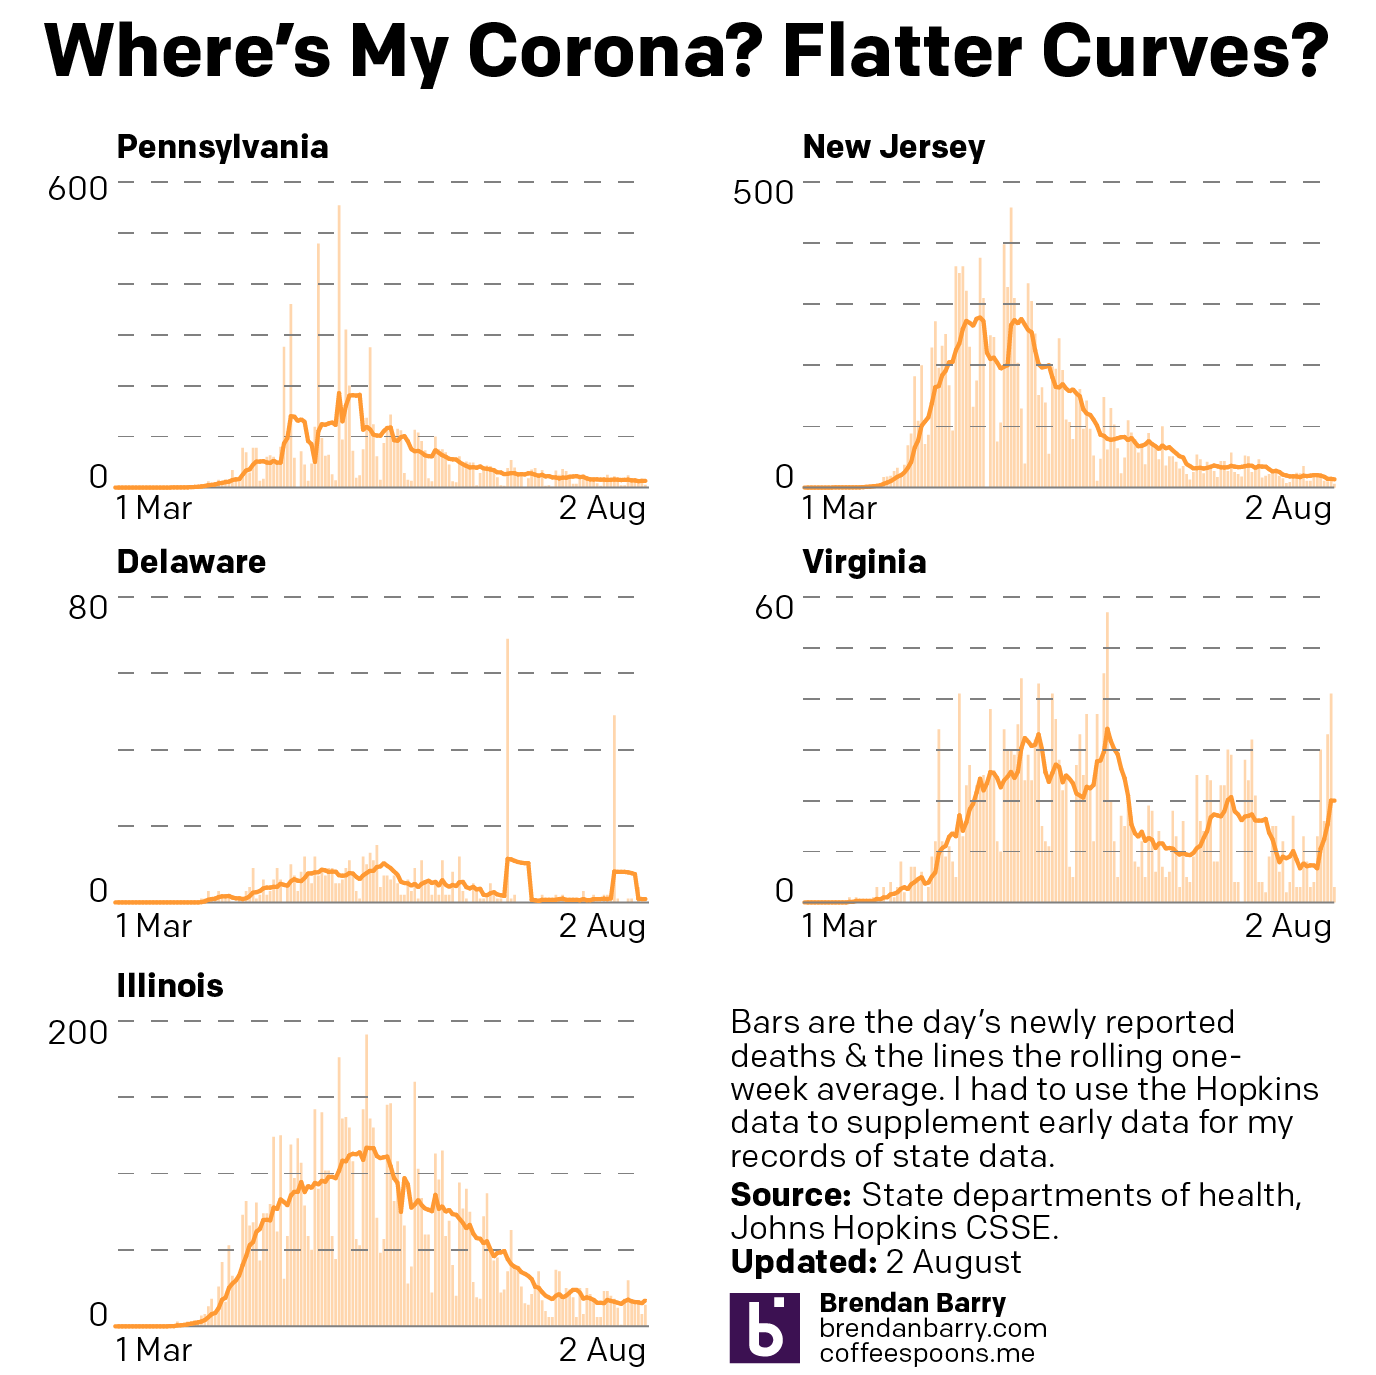
Daily new deaths and their rolling average for Pennsylvania, New Jersey, Delaware, Virginia, and Illinois.
Daily new deaths

So yeah, we’ll see how this goes. And I’ll try to keep Tuesday–Friday to discussing the world of data visualisation, although in these days, a good chunk of it will likely revolve around Covid.

Credit for these graphics is mine.

Corona’s Moment in Your Life

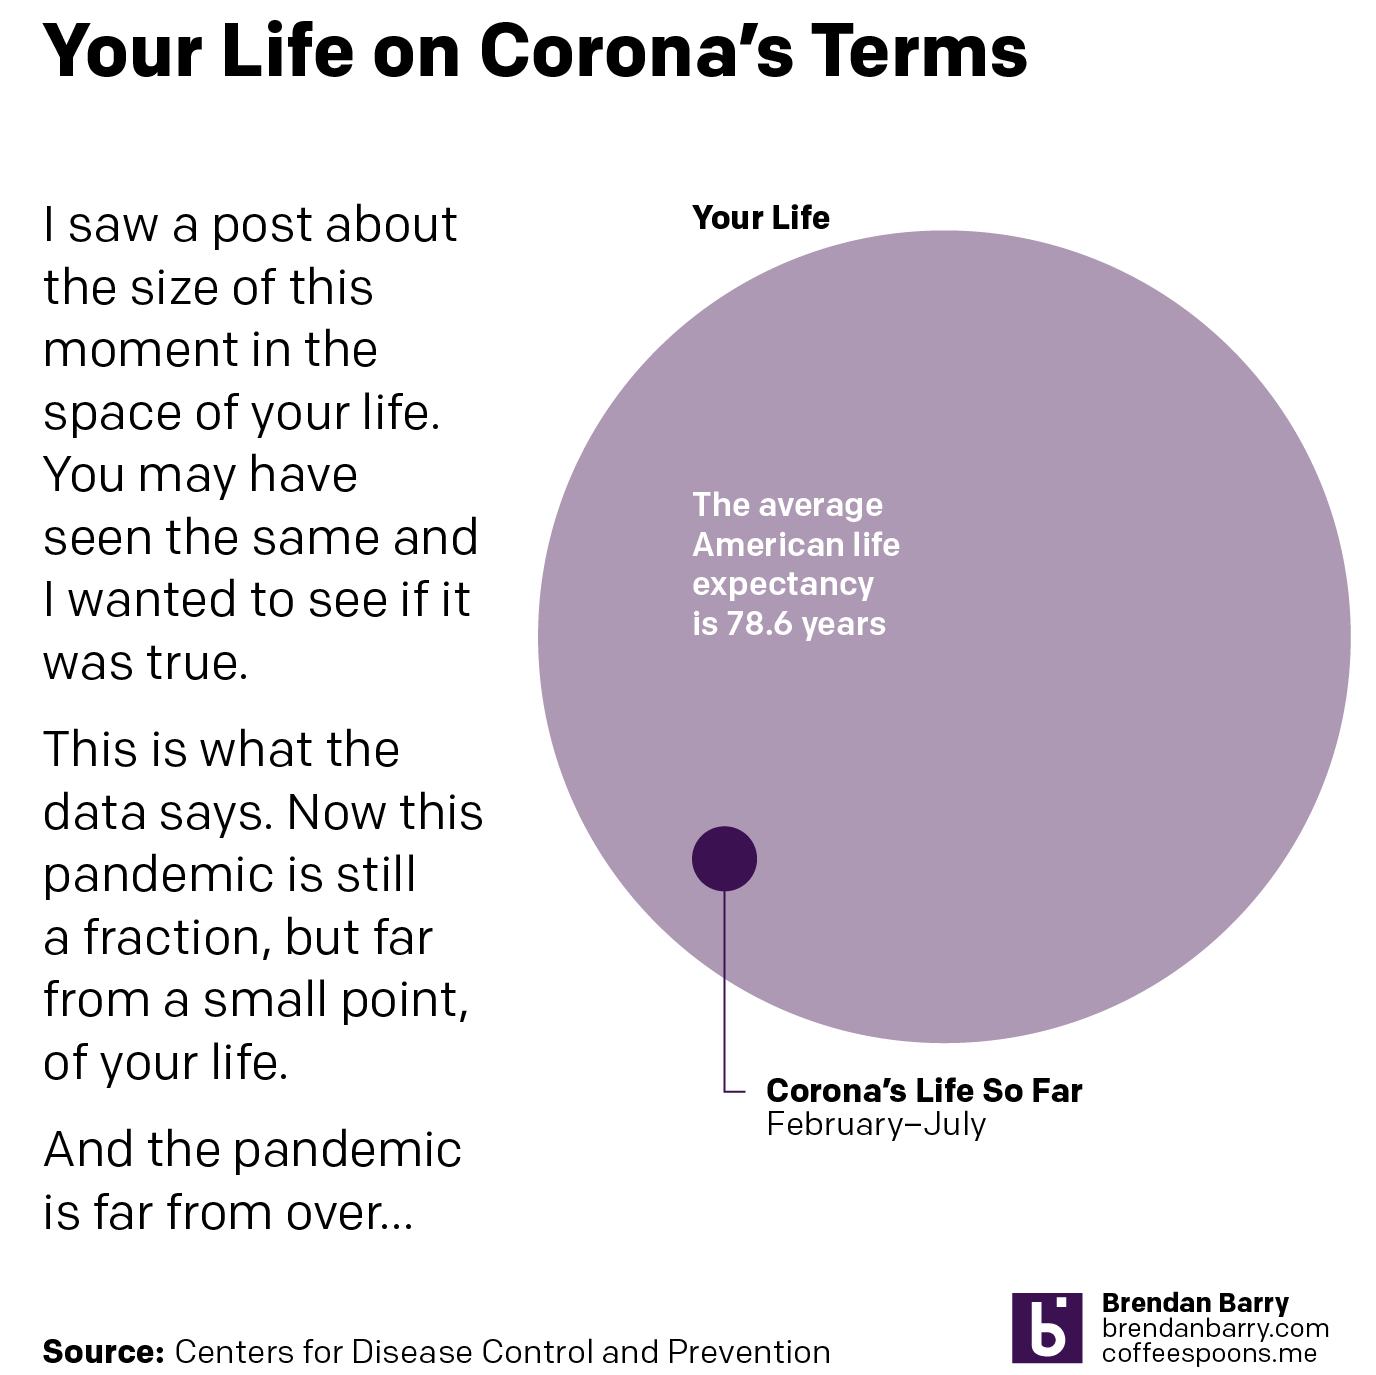
Earlier this week I was on the social medias when I came across a graphic some people were sharing that was meant to be inspirational. It had a giant circle and then a small black pixel that represented “this moment”. Of course, how you define the moment is entirely subjective.

But it made me wonder, if we looked at the coronavirus Covid-19 pandemic as a moment in our lives, how big of a moment is it? Well, I went to the CDC to get a sense of the average life expectancy of an American and then I got the fraction of that lifespan that is the last six months. And, well take a look.

Corona in your lifespan
A not so insignificant span of time

As you can see, the Covid-19 pandemic is more than just a pixel. It’s a significant moment, and of course the pandemic is ongoing. There are new concerns that the 2020 Olympics, now postponed to 2021, may not happen in 2021.

That dot represents graduations, weddings, funerals, birthdays, anniversaries, holidays, opportunities for education, career advancement, life goals all delayed or in some cases missed and never to return.

And while the rest of the world shows some signs of improvement, for my American audience, things are going from bad to worse.

So Happy Friday, everyone.

The Vaxx Path

Today we look at a wee graphic from the BBC examining the current state of Covid-19 vaccines. None have been approved, but 163 are on the path to approval.

The vaxx path

This falls into the category of not everything has to be super complex. Each vaccine is shown as a discrete unit, a small square. For me in this instance this works better than a bar chart showing the total number per each phase. It highlights how each vaccine is a distinct unit and that it can move from one section down to the next. (Although I suppose if it fails a phase it can also be removed entirely.)

And if you want another reason why a nationalist, isolationist foreign policy that bashes foreign countries is not great…none of the Phase 3 candidates, closest to approval, are from an American company or institution.

Credit for the piece goes to the BBC graphics department.

Red Sox Starting Rotation: A Dumpster Fire in a Dumpster Fire Year

Baseball for the Red Sox starts on Friday. Am I glad baseball is back? Yes?

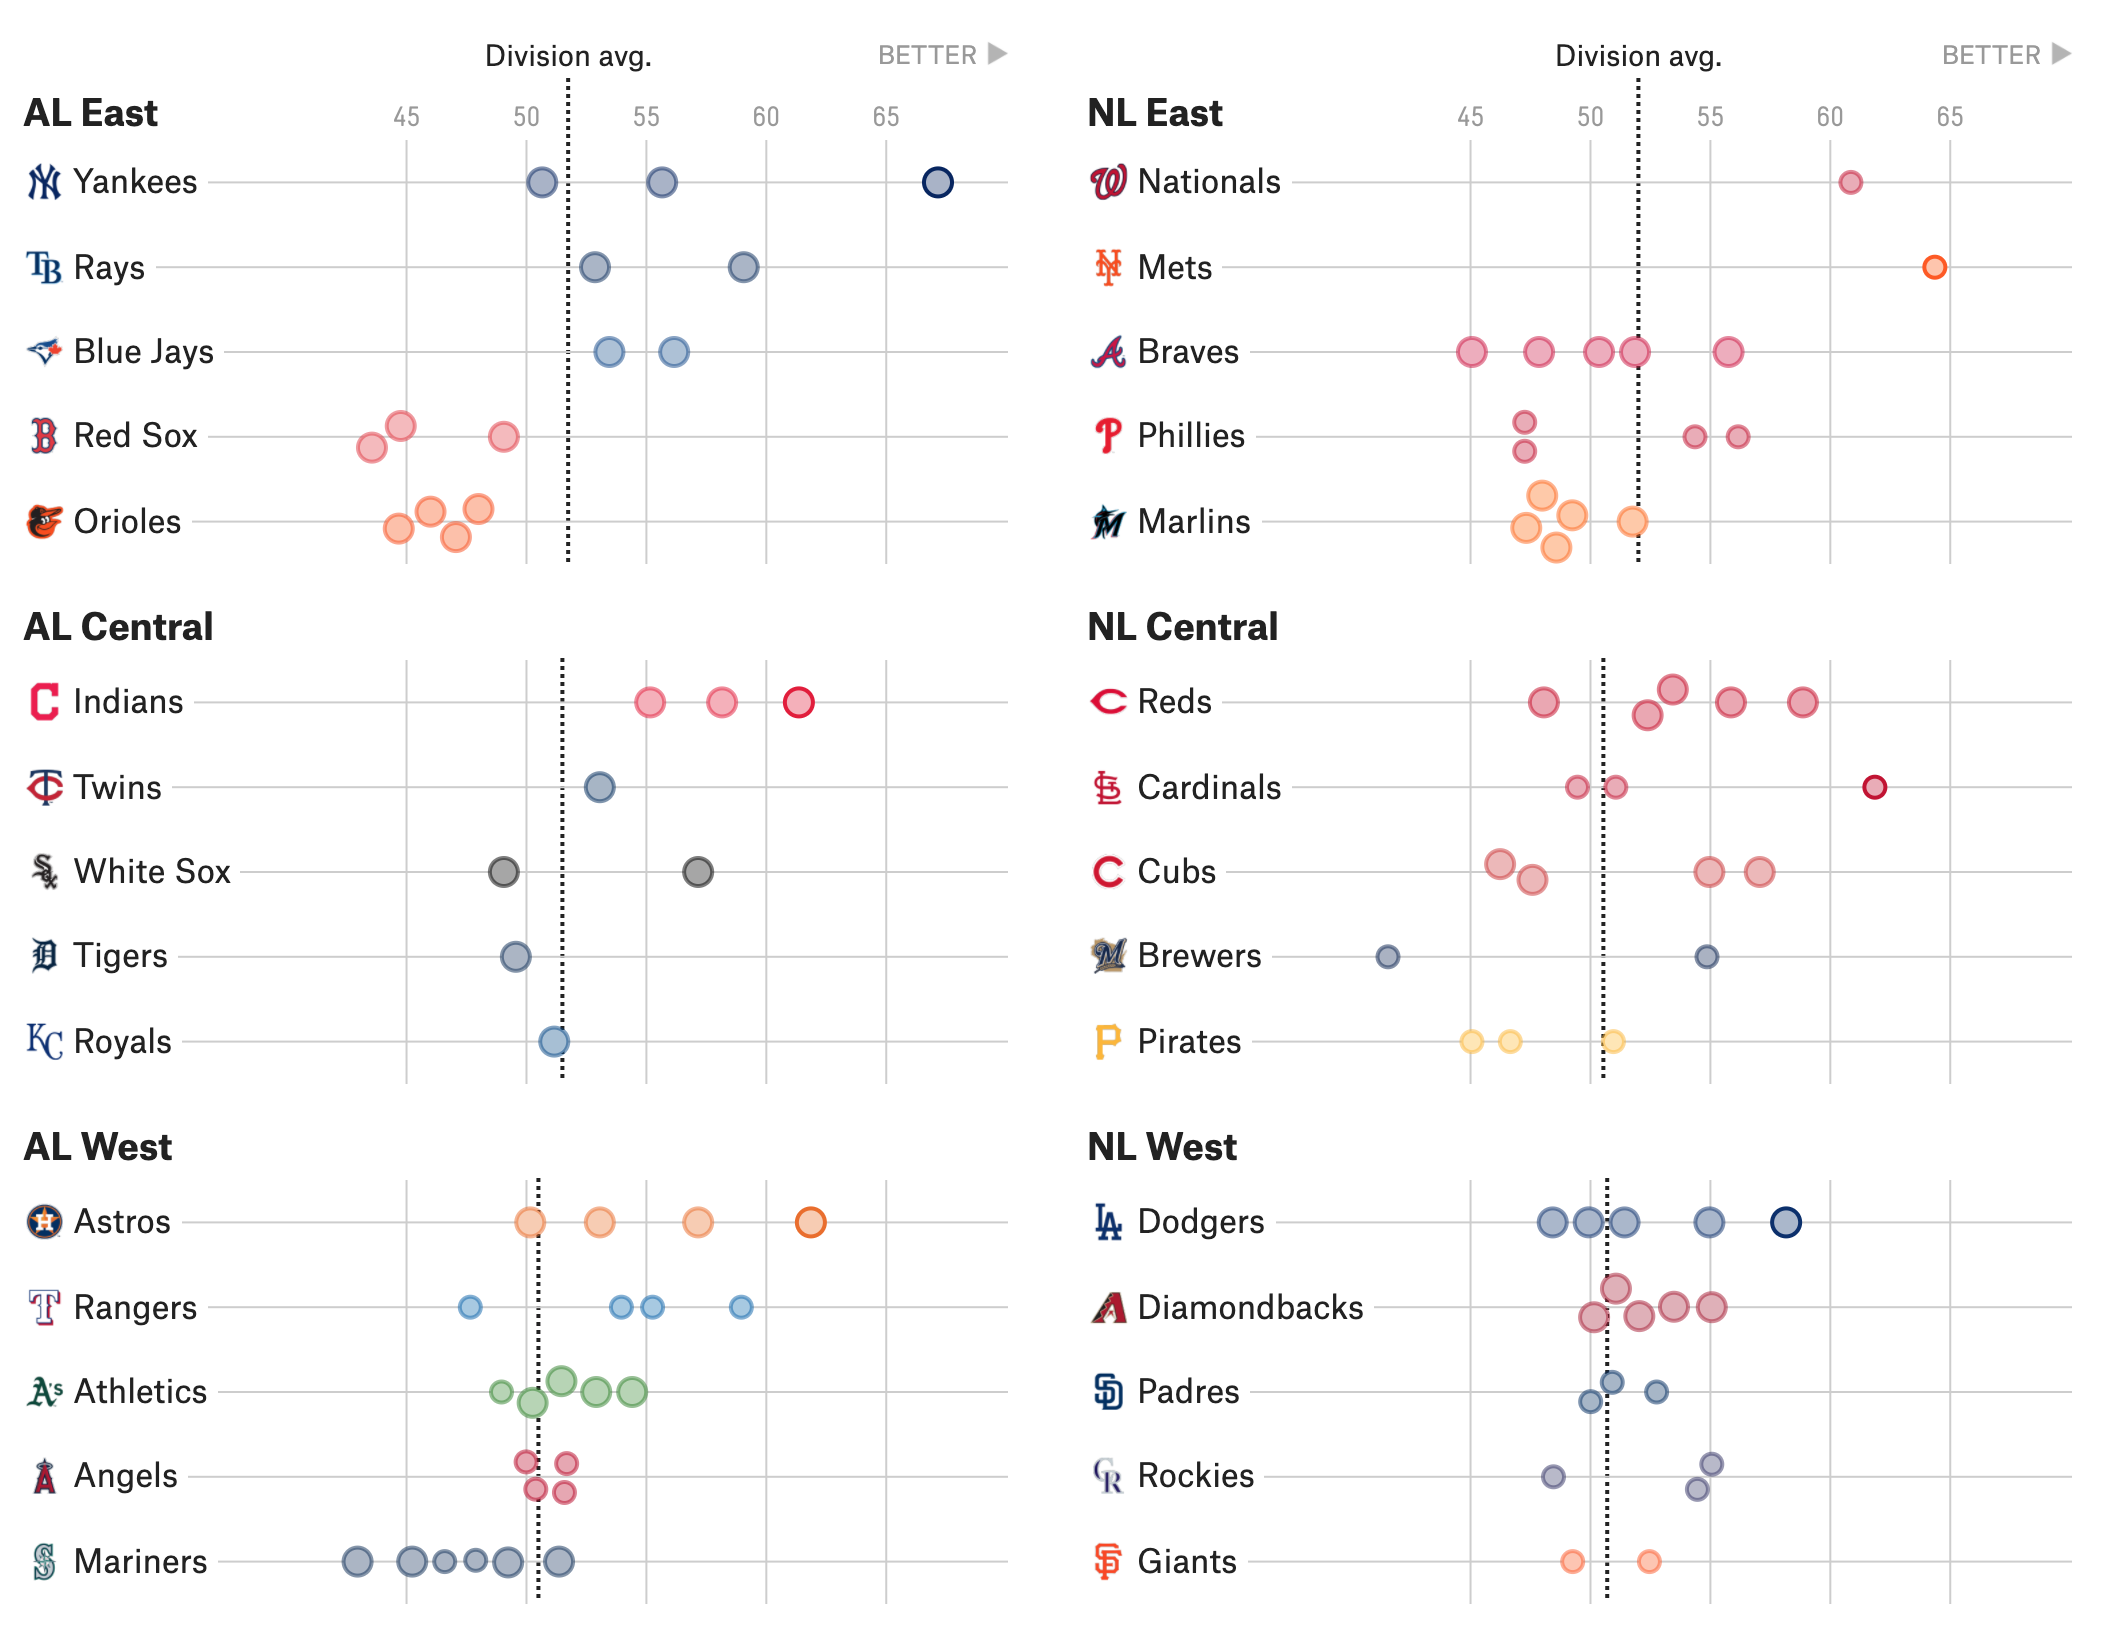
I love the sport and will be glad that it’s back on the air to give me something to watch. But the But the way it’s being done boggles the mind. Here today I don’t want to get into the Covid, health, and labour relations aspect of the game. But, as the title suggests, I want to look at a graphic that looks at just how bad the Red Sox could be this (shortened) year. And over at FiveThirtyEight, they created a model to evaluate teams’ starting rotations on an ongoing basis.

The Red Sox are just bad.
Look at the Red Sox, one of the worst in baseball.

Form wise, this isn’t too difficult than what we looked at yesterday. It’s a dot plot with the dots representing individual pitchers. The size of the dots represents their number of total starts. This is an important metric in their model, but as we all know size is a difficult attribute for people to compare and I’m not entirely convinced it’s working here. Some dots are clearly smaller than others, but for most it’s difficult for me to clearly tell.

Colour is just tied to the colour of the teams. Necessary? Not at all. Because the teams are not compared on the same plot, they could all be the same colour. If, however, an eventual addition were made that plot the day’s matchups on one line, then colour would be very much appropriate.

I like the subtle addition of “Better” at the top of the plots to help the user understand the constructed metric. Otherwise the numbers are just that, numbers that don’t mean anything.

Overall a solid piece. And it does a great job of showing just how awful the Red Sox starting rotation is going to be. Because I know who Nate Eovaldi is. And I’ve heard of Martin Perez. Ryan Weber I only know through largely pitching in relief last year. And after that? Well, not on this graphic, but we have Eduardo Rodriguez who had corona and, while he has recovered, nobody knows how that will impact people in sports. There’s somebody named Hall who I have never heard of. Then we have Brian Johnson, a root for the guy story of beating the odds to reach the Major Leagues but who has been inconsistent. Then…it is literally a list of relief pitchers.

We dumped the salary of Mookie Betts and David Price and all we got was basically a tee-shirt saying “We still need a pitcher or three”.

Credit for the piece goes to Jay Boice.

Consumer Payment Methods During the Corona Times

Okay, so we’re going to post some more of my work today, but it’s not about cases and deaths. Instead, I took some data produced by my colleagues and thought that it could do for a small transformation from a table into a chart. The original table can be found in their report on consumer payment options during the Covid-19 pandemic.

After setting the kettle on for some tea this morning we started on their Table 1. Thirty minutes later and a cup of Irish Breakfast consumed, I had transformed it into this:

Obviously I changed the language/title a little bit. But the original was too long and didn’t fit. Also this is my blog, so my rules. The visualisation improves upon the table in a number of ways, but tables do have their place. Tables are great for organising information. Find a column header and a row header and you can get any specific data point. But, if you want to make a comparison between two data points or several of them, a chart is the way to go. Now, you may lose some precision. For example, do I know to the decimal point or to the tenths even what one of those dots represents? Nope. But at a glance, can I see which dots are below the overall respondents? Yep. It’s abundantly clear that those earning less than $40,000 per year have a greater availability of debit cards than the other groups shown.

And after all, I couldn’t have made this graphic without that table.

Full disclosure, as alluded to above, I work at the Federal Reserve Bank of Philadelphia. But I had nothing to do with the data, report, or presentation thereof.

Credit for the graphic is mine. The data to the folks over at the Consumer Finance Institute.

A Map of Unequal Comparisons

I’ve largely been busy creating and posting content on the Covid pandemic and its impact on the Pennsylvania, New Jersey, and Delaware tristate area along with, by request, both Virginia, and Illinois, my former home. It leaves me very little time for blogging, and I really do not want this site to become a blog of my personal work. That’s why I have a portfolio or my data project sites, after all.

But in posting my Covid datagraphics, I’ve come across variations of this map with all sorts of meme-y, witty captions saying why Canada is doing so much better than the US, why Americans shouldn’t be allowed to travel to Canada, and now why the Blue Jays shouldn’t be allowed to host Major League Baseball games.

Wait just a minute, there…

Well, that map isn’t necessarily wrong, but it’s incredibly misleading.

First, the map comes from the fantastic Johns Hopkins work on Covid-19. (Full disclosure, that’s the data source I use at work to create my work work datagraphics: https://philadelphiafed.org/covid-19/covid-19-research/covid-19-cases-and-deaths#.) And their site has a larger and more comprehensive dashboard (still hate that term but it does have sticking power) of which the map is the focal point.

The numbers as of this posting.

You can see the map there in the centre and some tables to the left, some tables to the right, and even a micro table beneath thundering away at the map’s position. I could get into the overall design—maybe I will one of these days—but again, let’s look at that map.

The crux of the argument is that there are a lot of red dots in the United States and very few in Canada. But look at the table in the dashboard on the left. At the very bottom you see three small tabs, Admin 0, Admin 1, and Admin 2. Admin 0 contains all entities at the sovereign state level, e.g. US, Canada, Sweden, Brazil, &c. Admin 1 is the provincial/state level, e.g. Pennsylvania, Illinois, Ontario, Quebec, &c. Admin 2 is the sub-provincial/sub-state level, e.g. Philadelphia County, Cook County, Chester County, Lake County, &c.

Notice anything about my examples? Not all countries have provinces/states, but Canada certainly does. And then at Admin 2, the examples and indeed the data only have US counties and US data. Everything in Canada has been aggregated up to Admin 1. And that is the problem.

The second part to point out is the dot-ness of the map. And to be fair, this is part of a broader problem I have been seeing in data visualisation the last few months. Dots, circles, or markers imply specificity in location. The centre of that object, after all, has to fall on a specific geographic place, a latitude and longitude coordinate. It utterly fails to capture the dimensions and physical size of the geographic unit, which can be critical.

Because not all geographic units are of the same size. We all know Rhode Island as one of the smallest US states. Let’s compare that to Nunavut or Yukon in Canada, massive provinces that spread across the Canadian Arctic. Rhode Island, according to Google, 1212 square kilometres. Nunavut? 808,200.

So now show both states/provinces on a map with one dot and Rhode Island’s will practically cover the state. And it will also be surrounded by and in close proximity to the states or Massachusetts and Connecticut. Nunavut, on the other hand will be a small dot in a massive empty space on a map. But those dots are equal.

Now, combine that with the fact that the Hopkins map is showing data on the US county level. Every single county in the United States gets a red dot. By default, that means the US is covered with red dots. But there is no county-level equivalent data for Canada. Or for Mexico (also seen in the above graphic). And so given we’re only using dots to relate the data, we see wide swaths of empty space, untouched by red dots. And that’s just not true.

Yes, large parts of the Canadian Arctic are devoid of people, but not southern Ontario and Quebec, not the southwestern coast of British Columbia, not the Maritimes.

The Hopkins map should be showing geographic units at the same admin level. By that I mean that when on Admin 0, the map should reflect geographic units of sovereign state level, allowing us to compare the US to Canada directly. But, and for this argument I’m assuming we’re keeping the dots despite their flaws, we only see Admin 0 level data.

Admin 1 shows only provincial level data. Some countries will begin to disappear, because Hopkins does not have the data at that level. But in North America, we still can compare Pennsylvania and Illinois to Ontario and Quebec.

But then at Admin 2, we only see the numerous dots of the United States counties. It’s neither an accurate nor a helpful comparison to contrast Chester County or Will County to the entire province of Ontario and so the map should not allow it. Instead, as the above graphic shows, it creates misconceptions of the true state of the pandemic in the US and Canada.

Credit for the Hopkins dashboard goes to, well, Hopkins.

The Golden Ratio

Today is a Friday, an important point for those of us still in or largely in quarantine. So let’s try to ease into a more frequent posting with some humourous content from xkcd. It looks at everyone’s favourite golden ratio spiral and designers’ preferred ISO 216 for paper sizes.

I mean I would love if I could consistently get my hands on some A4. It just looks nicer than US Letter. But I digress, enjoy.

I mean graphic design is everywhere.

Credit for the piece goes to Randall Munroe.