The Great British Baking

Recently the United Kingdom baked in a significant heatwave. With climate change being a real thing, an extreme heat event in the summer is not terribly surprising. Also not surprisingly, the BBC posted an article about the impact of climate change.

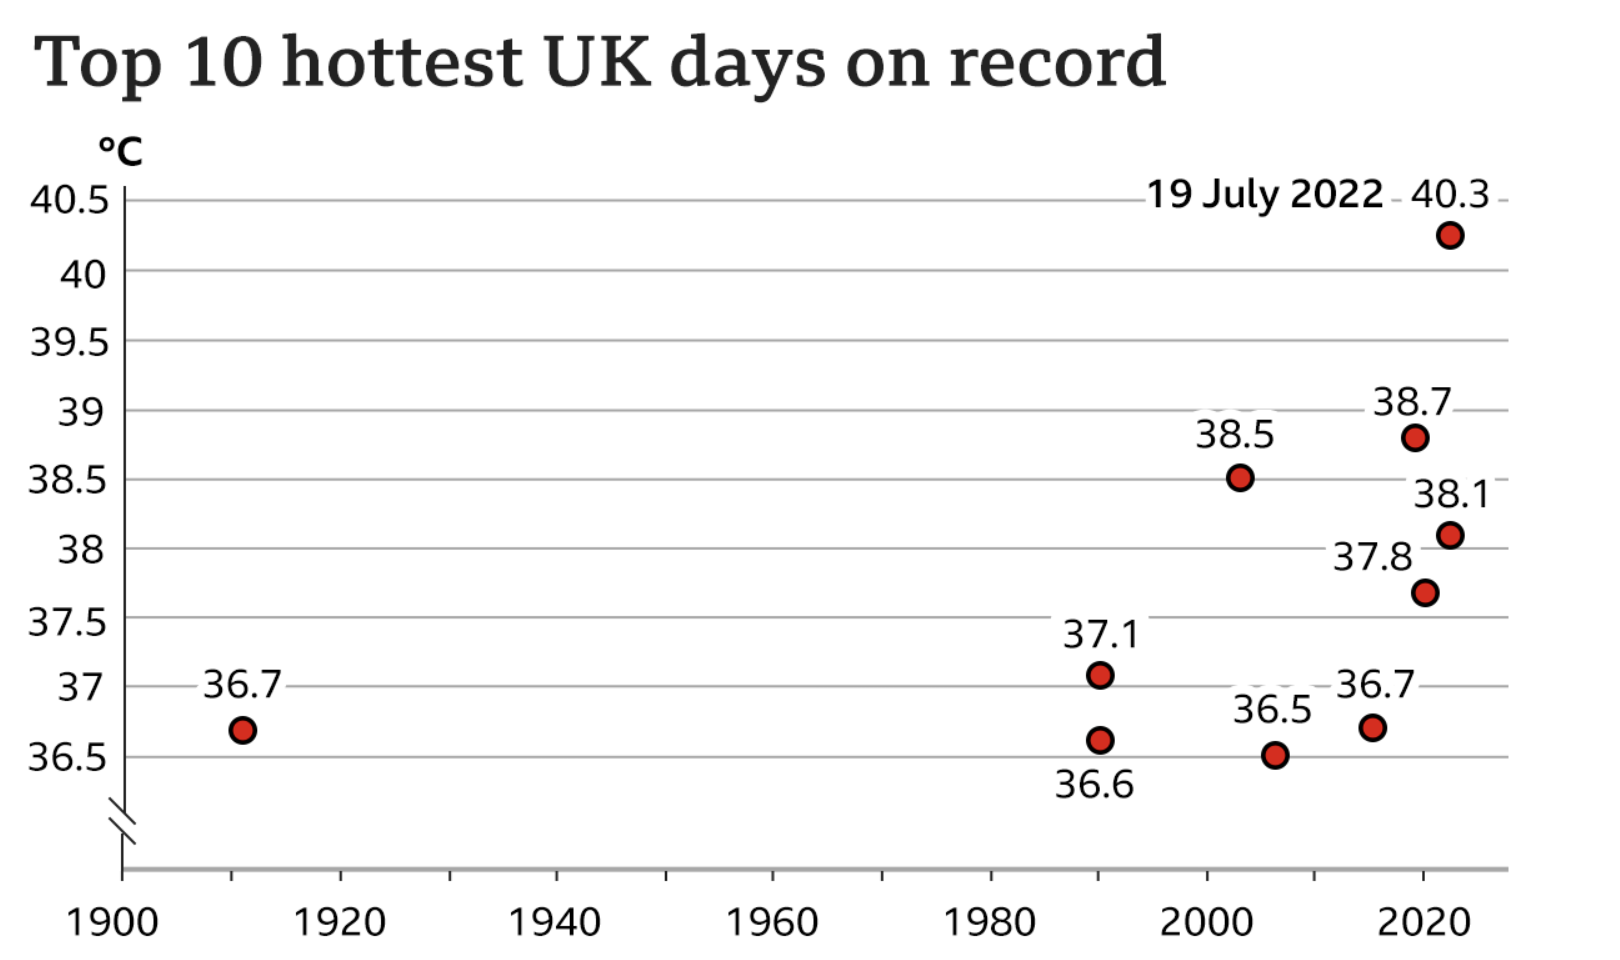
The article itself was not about the heatwave, but rather the increasing rate of sea level rise in response to climate change. But about halfway down the article the author included this graphic.
It’s getting hotter…

As graphics go, it is not particularly fancy—a dot plot with ten points labelled. But what this piece does well is using a dot plot instead of the more common bar chart. I most typically see two types of charts when plotting “hottest days” or something similar. The first is usually a simple timeline with a dot or tick indicating when the event occurred. Second, I will sometimes see a bar chart with the hottest days presented all as bars, usually not in the proper time sequence, i.e. clustered bar next to bar next to bar.

My issue with the the latter is always where is the designer placing the bottom of the bar? When we look at the best temperature graphics, we usually refer to box plots wherein the bar is aligned to the day and then top of the bar is the daily high and the bottom of the bar the daily low. It does not make sense to plot temperatures starting at, say 0º.

In this particular case, however, the dates would appear to overlap too closely to allow a proper box plot. Though I suspect—and would be curious to see—if the daily minimum temperatures on each of those ten hottest days have also increased in temperature.

As to the timeline option, this does a better job of showing not just the increasing frequency of the hottest days, but also the rising maximum value. In the early 20th century the hottest day was 36.7ºC, and you can see a definite trend towards the hottest days nearing and finally surpassing 40ºC.

I do wonder if a benchmark line could have been added to the chart, e.g. the summertime average daily high or something similar. Or perhaps a line showing each day’s temperature faintly in the background.

Finally, I want to point out the labelling. Here the designers do a nice job of adding a white stroke or outline to the outside of the text labels. This allows the text to sit atop the y-axis lines and not have the lines interfere with the text’s legibility. That’s always a nice feature to see.

Credit for the piece goes to the BBC graphics department.

Small Dog Days of Summer

For my readers in the northern hemisphere, which is the vast majority of you, we are in the middle of meteorological summer, the dog days. And whilst my UK and Europe readers continue to bake under temperatures greater than 40ºC (104ºF), the northeast United States and Philadelphia in particular is looking at a heatwave starting today that’s forecast to peak at a temperature of 38ºC (100ºF) this weekend and a heat index reaching 41ºC (106ºF) tomorrow.

Not cool.

Yesterday we examined a completely different topic, property tax increases in Philadelphia, but we contrasted that work with a heat index map from the New York Times. With the heatwave beginning this afternoon, however, it seemed apropos to revisit that contrasting article.

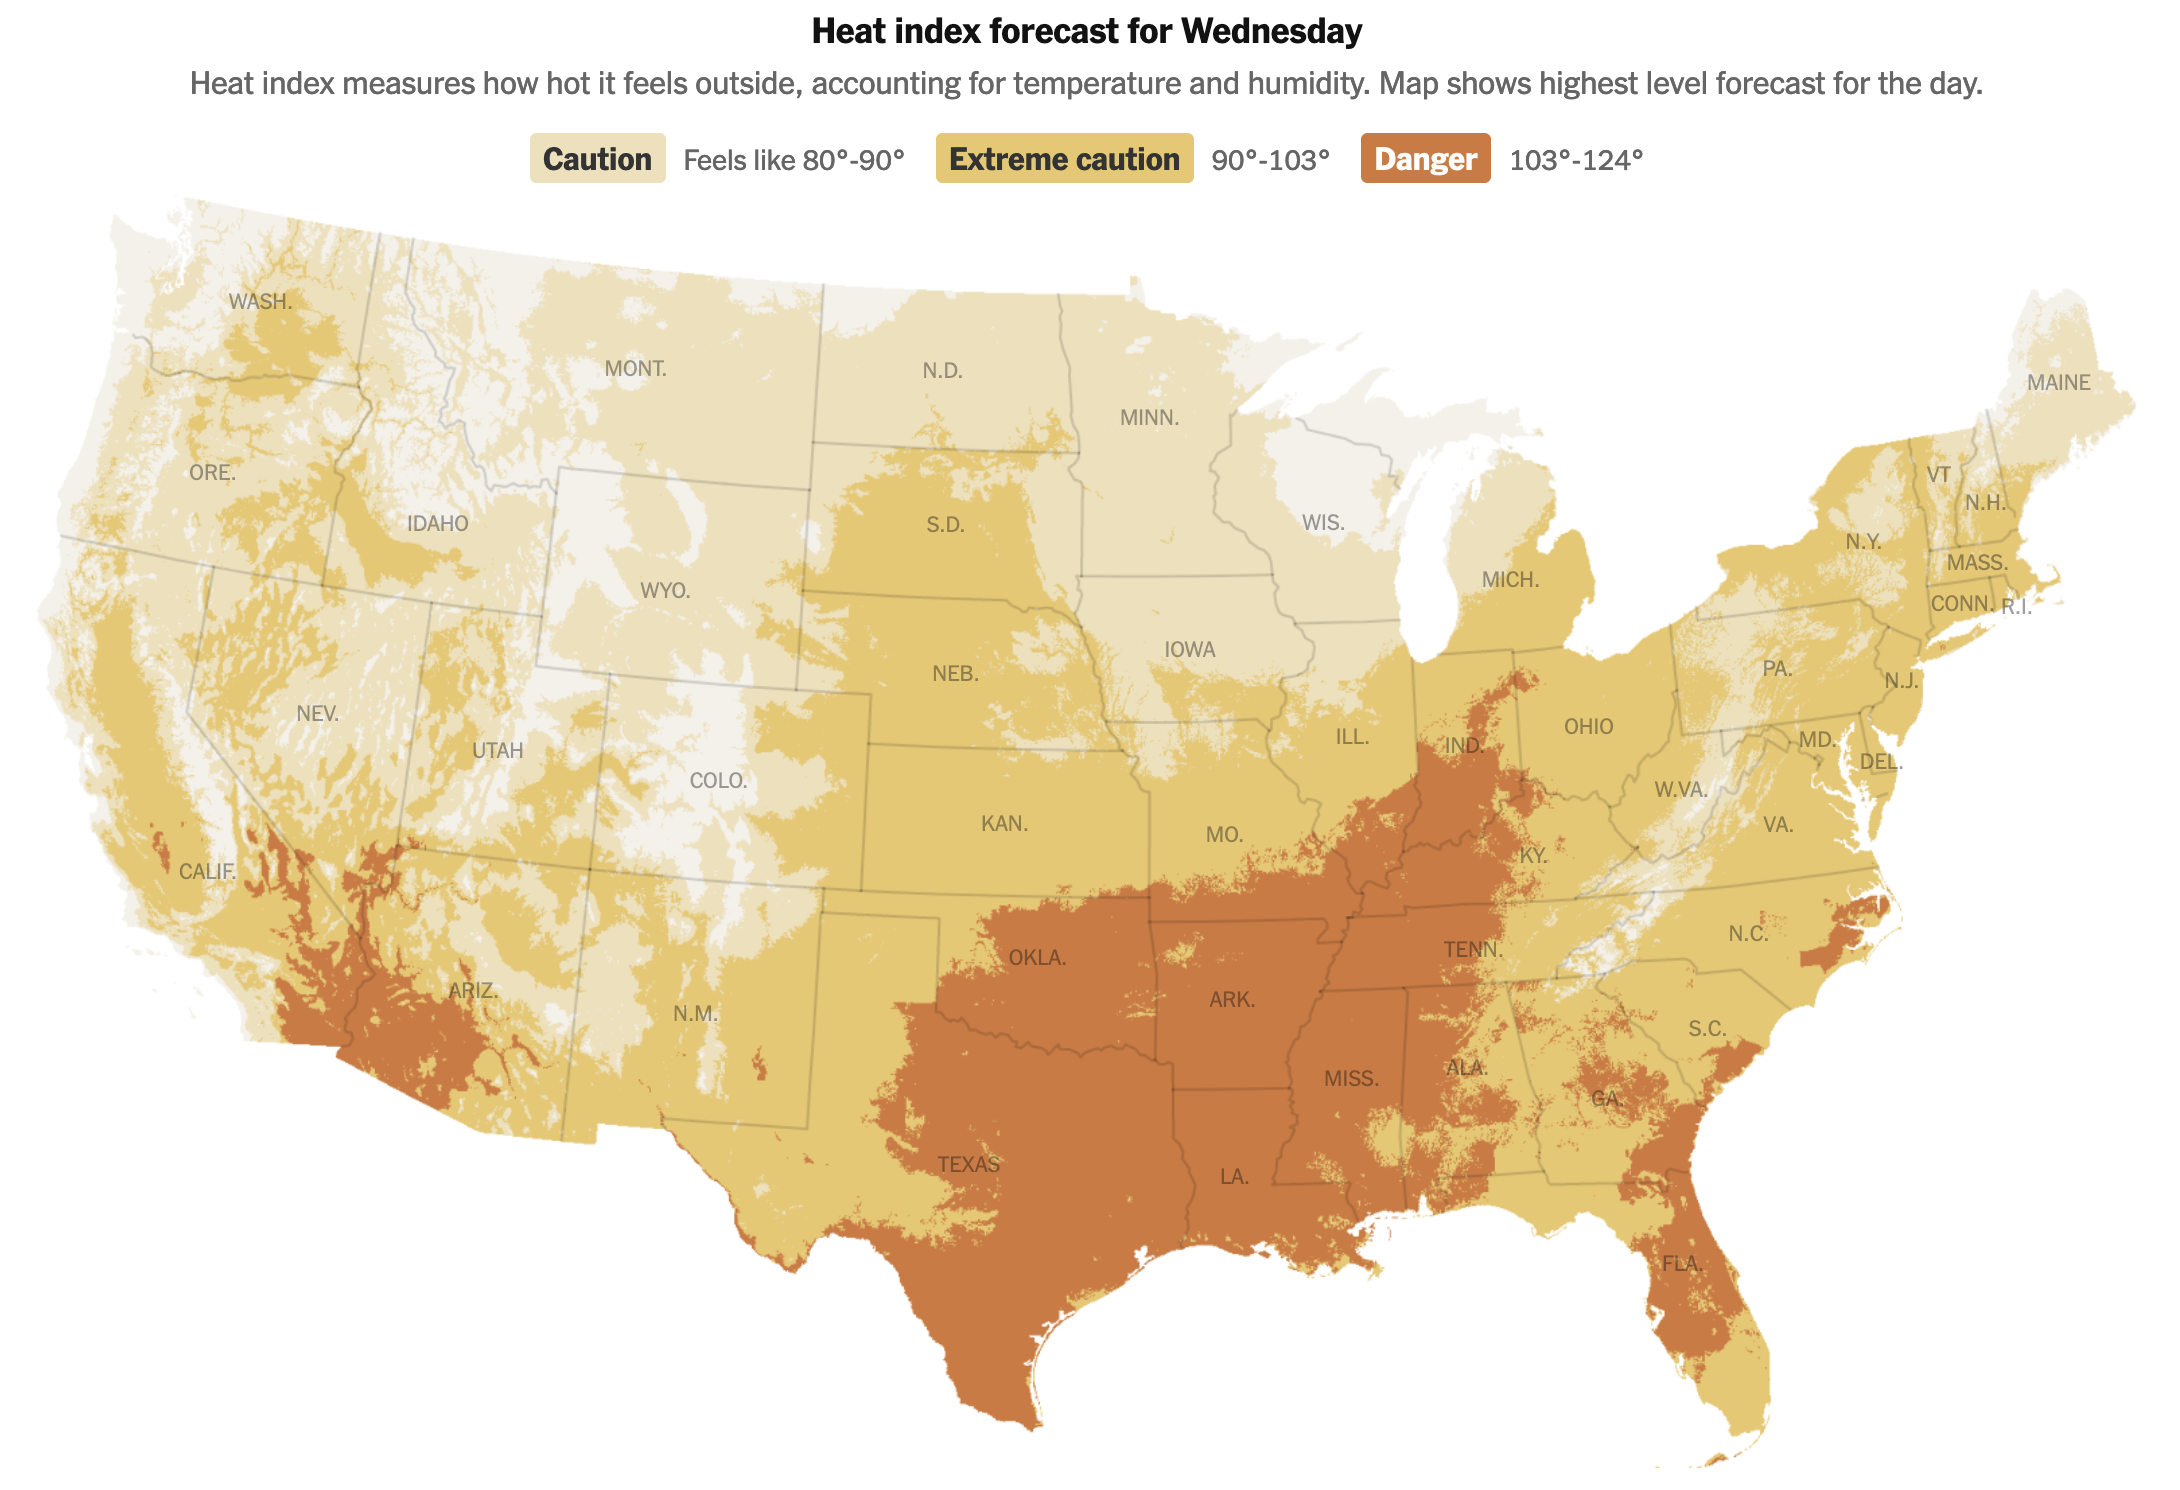
It begins with the map that we looked at yesterday. Of course yesterday was Tuesday. Today is Wednesday, and so you can already compare these two maps to see how and where the heat has shifted. Spoiler: the Southeast and Midwest.

Definitely not cooler.

It does so with a nice simple three-colour unidirectional spectrum from a light yellow to a burnt orange. And you can see the orange spreading up from the Gulf Coast and along the southeastern Atlantic Seaboard.

For those not familiar, the heat index is basically what the air “feels like” taking into consideration the actual temperature and the relative humidity in the air. Humans cool themselves via perspiration and when the air is excessively humid our ability to perspire decreases and thus the body begins to run hotter. Warmer temperatures allow the atmosphere to increase the amount of moisture it can contain and you can see all that Gulf and subtropical moisture carrying itself into the hot air moving up from the south.

Very not cool.

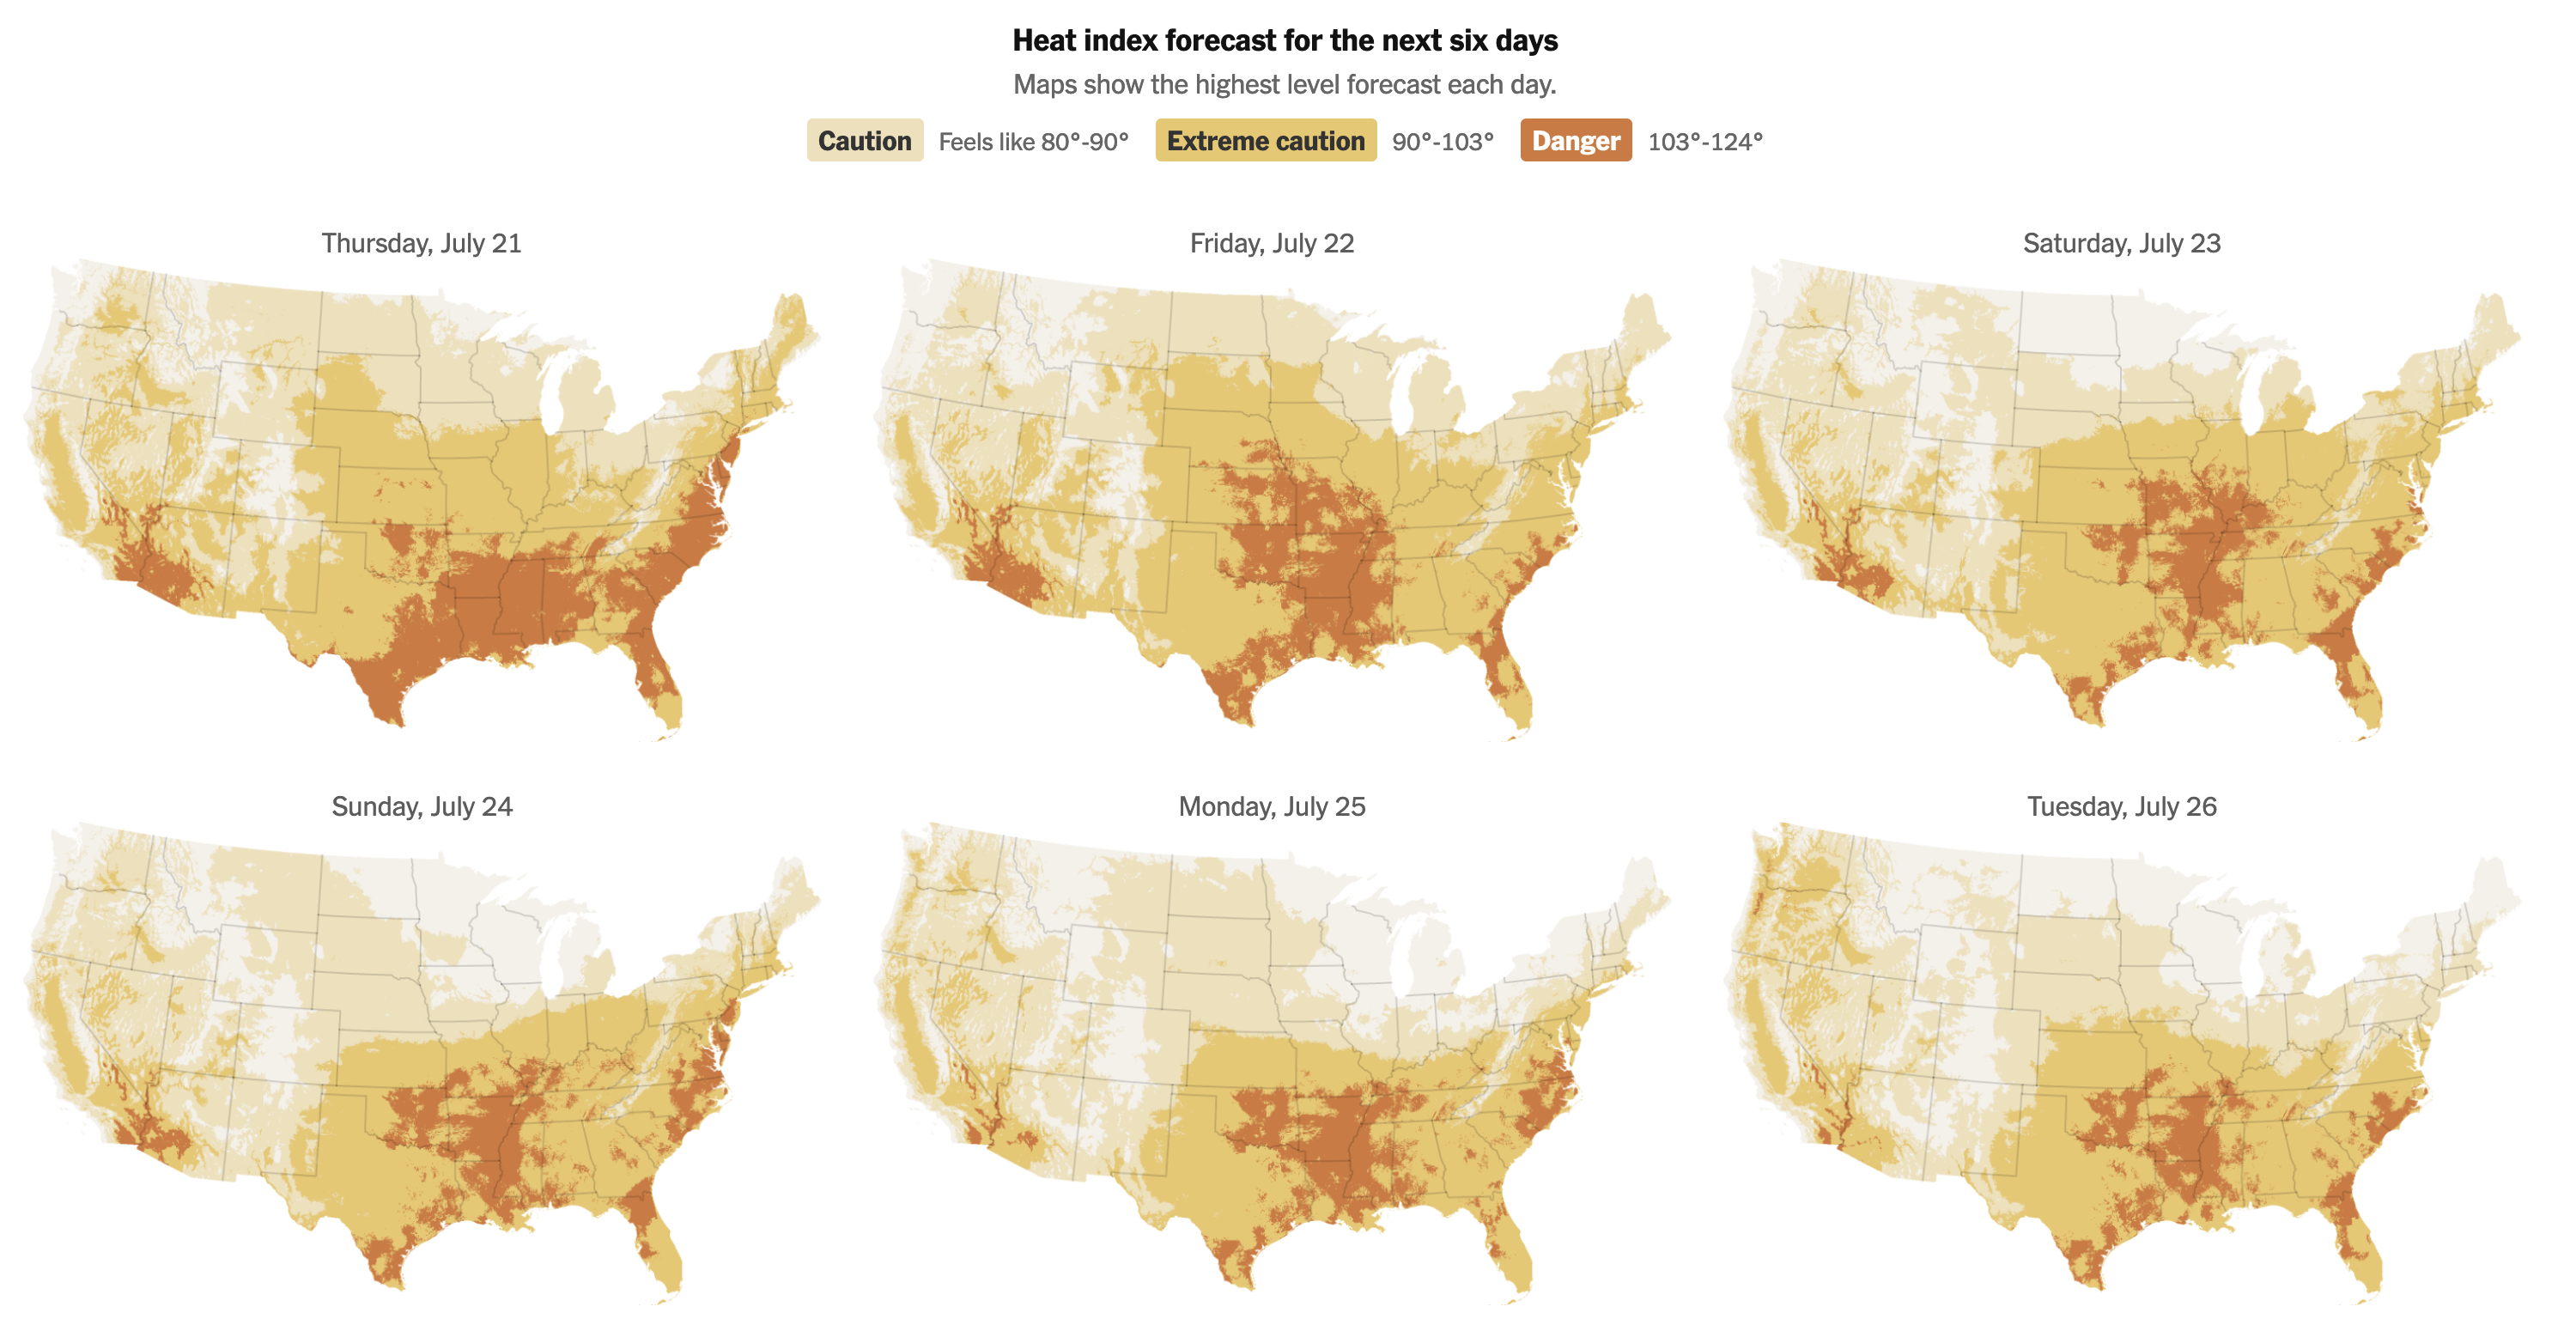
The piece also offers a look at the forecast for the heat index, showing the next six days. These small multiples allow the reader to see the geographic progression of the heat. Whereas today will be particularly for parts of the Midwest in southern Illinois and Indiana, tomorrow will see the worst for the Eastern Seaboard. Luckily the heat index retreats a bit, though as I noted above, the temperatures will continue to rise until Sunday, meaning higher temperatures, but lower relative humidity. For Philadelphia in particular we talking about 50% relative humidity tomorrow and only 35% on Sunday. That makes a big difference.

The not coolest.

Overall this is a great piece despite the content.

Personally, I just can’t wait until summer.

Credit for the piece goes to Matthew Bloch, Lazaro Gamio, Zach Levitt, Eleanor Lutz, and John-Michael Murphy.

Baby, It’ Hot Outside Pt 2

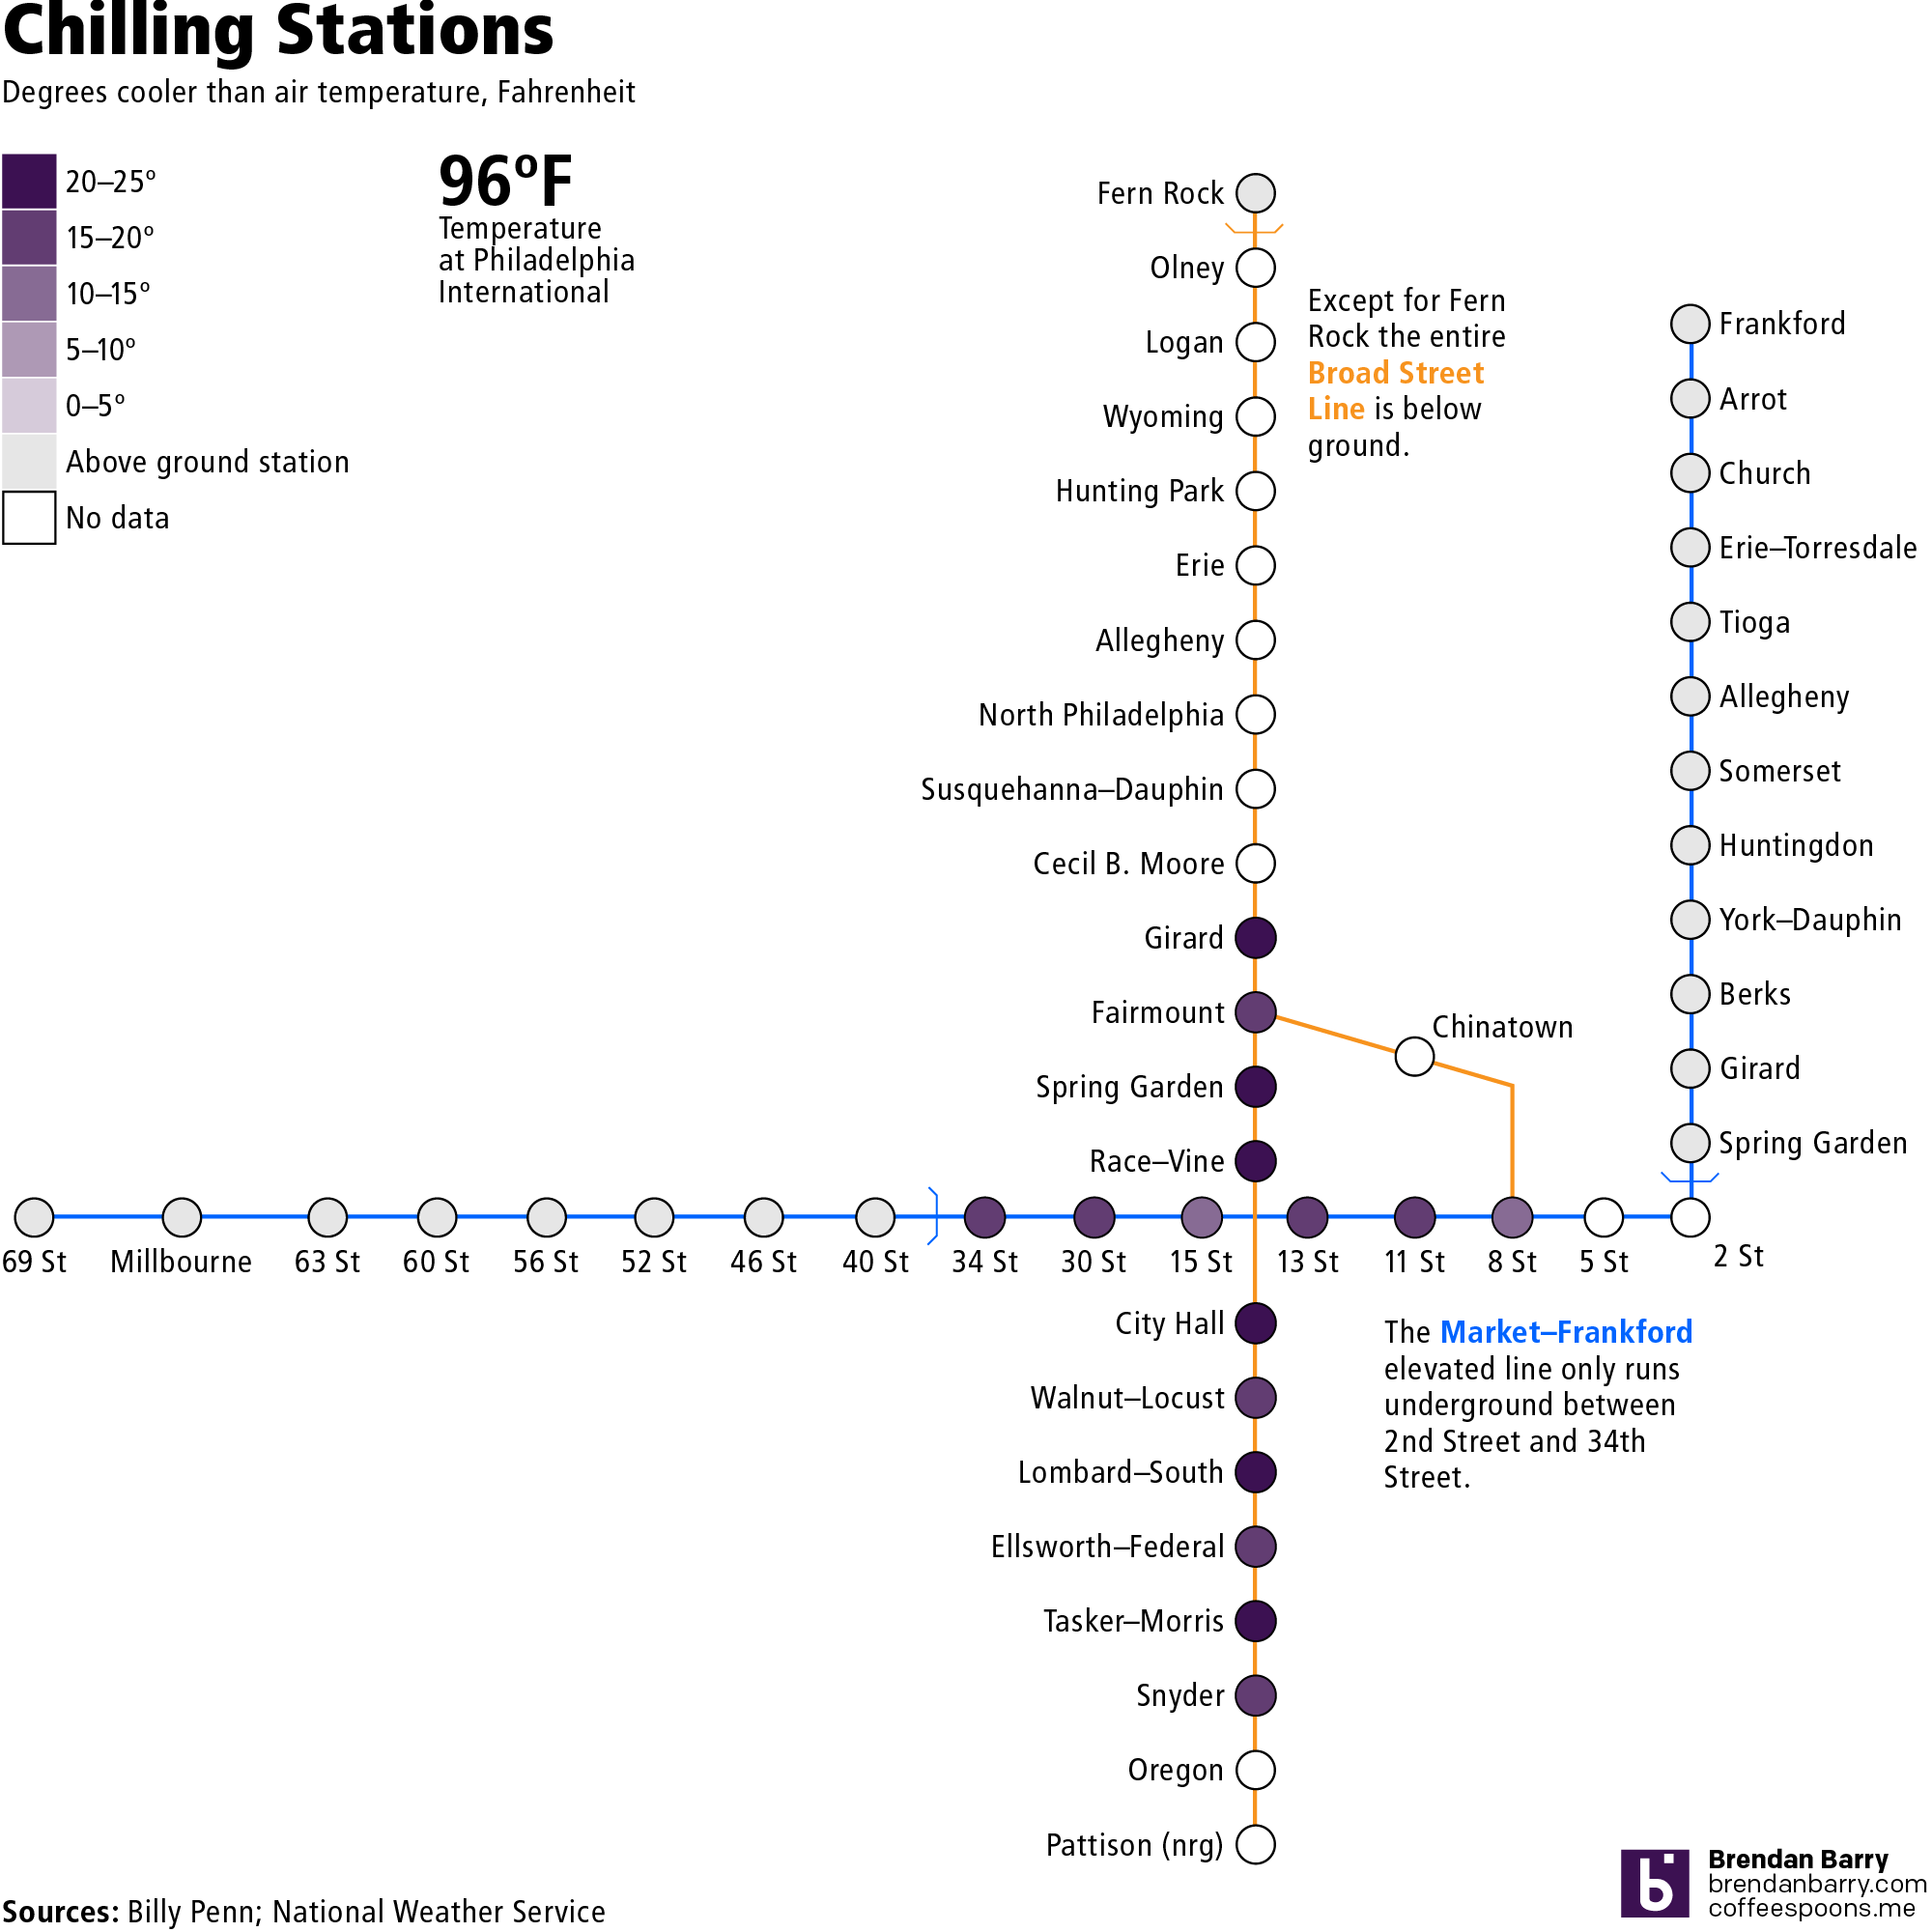
Yesterday we looked at Billy Penn’s graphics about the cooler stations and I mentioned a few ways the graphic could be improved. So last night I created a graphic where I explored the limited scope of the data, but also showing how low the temperatures were, relative to the air temperature outside, using weather data from the National Weather Service, admittedly from Philadelphia International Airport, not quite Centre City, which I would expect to be warmer due to the urban heat bubble effect.

I'd be curious to see data for North Philly
I’d be curious to see data for North Philly

I opted to exclude the Patco Line since the original dataset did not include it either. However a section of it does run through Centre City and could be relevant.

Credit for the piece goes to me, though the data is all from Billy Penn and the National Weather Service.

Baby, It’s Hot Outside

Those of you living on the East Coast, specifically the Mid-Atlantic, know that presently the weather is quite warm outside. As in levels of dangerous heat and humidity. Personally, your author has not left his flat in a few days now because it is so bad.

Alas, not everyone has access to air conditioning in his or her abode. Consequently, they need to look to public spaces with air conditioning. Usually that means libraries or public buildings. But here in Philadelphia, have people considered the subway?

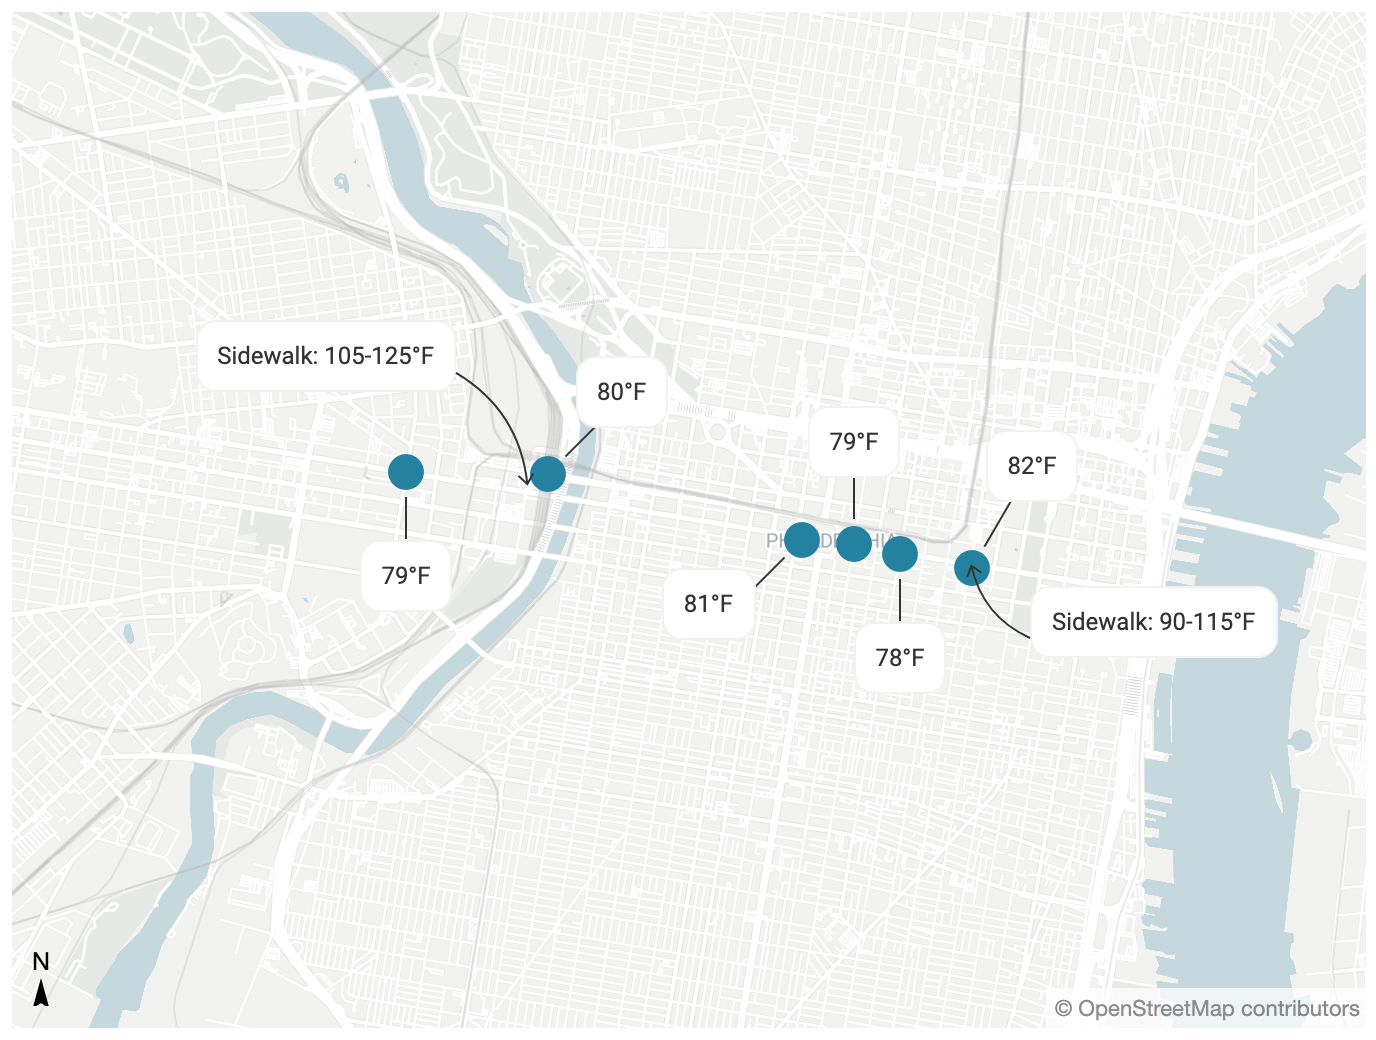
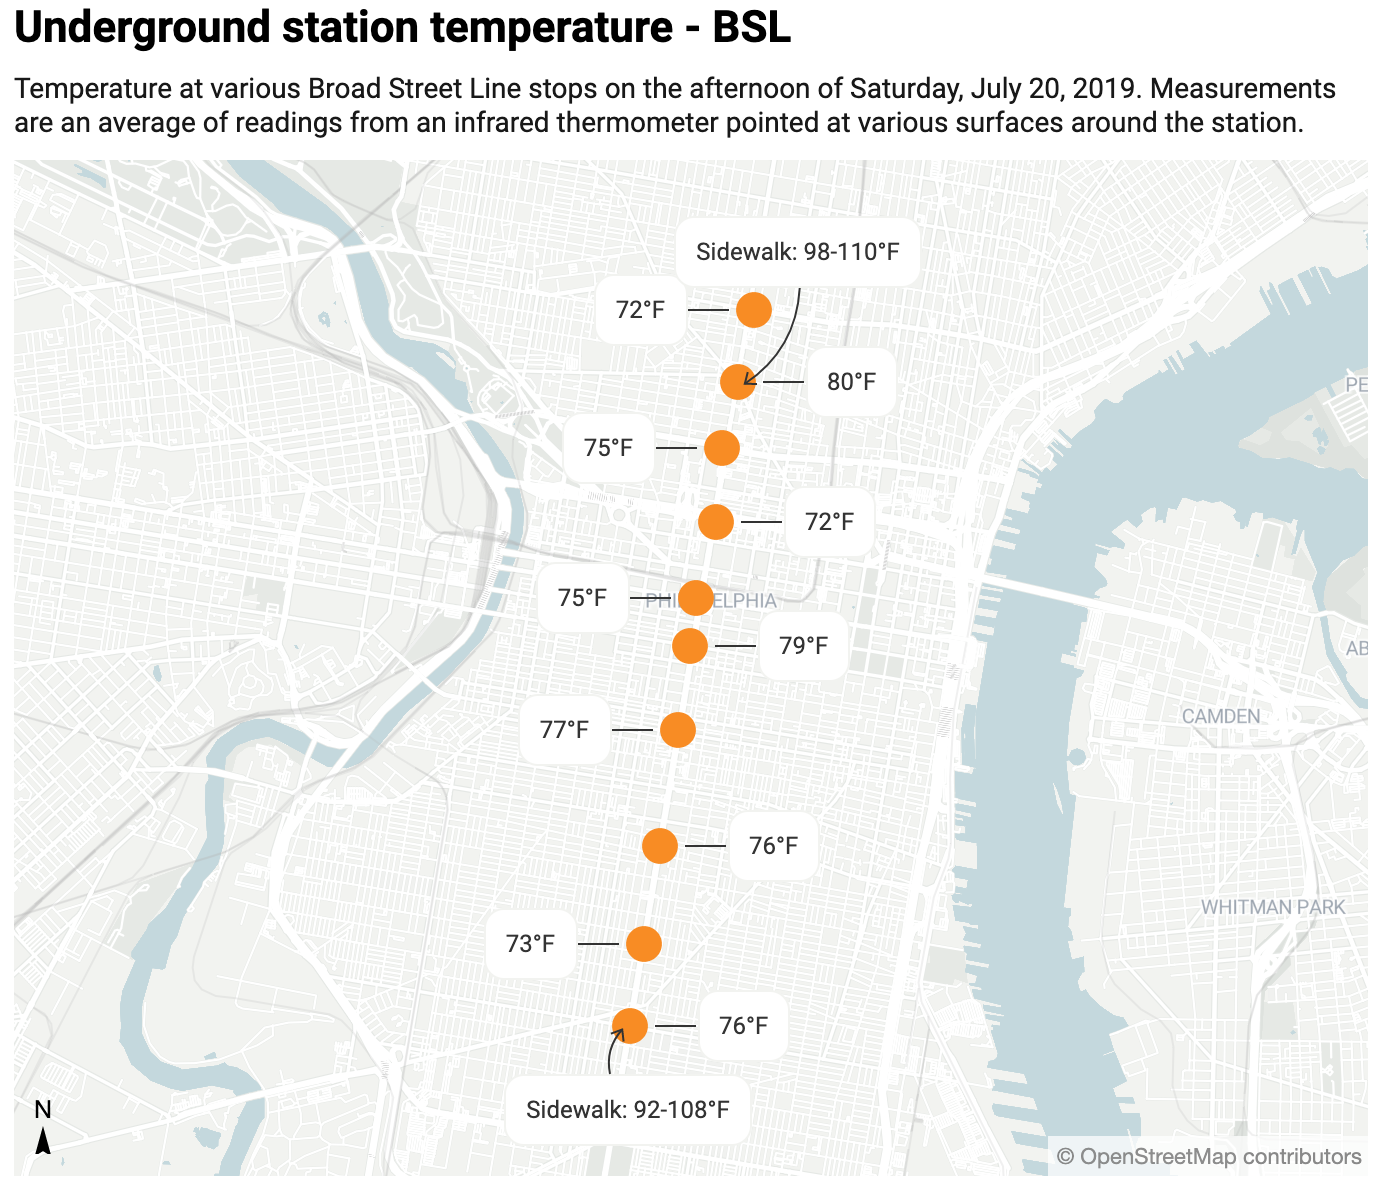
Billy Penn investigated the temperatures in Philadelphia’s subsurface stations along the Broad Street and Market–Frankford Lines—Philadelphia’s third and oft-forgot line, the Patco, was untested. What they found is that temperatures in the stations were significantly below the temperatures above ground. The Market–Frankford stations, for example, were less than 100ºF.

Just explore the rails…

Of course that misses the 2nd Street station in Old City, but otherwise picks up all the Market–Frankford stations situated underground.

Then there is the Broad Street Line.

More rail riding…
More rail riding…

Here, I do have a question about why the line wasn’t investigated from north to south. It ran only as far north as Girard, stopping well short of north Philadelphia neighbourhoods, and then as far south as Snyder, missing both Oregon and Pattison (sorry, corporately branded AT&T) stations. The robustness of the dataset is a bit worrying.

The colours here too mean nothing. Instead blue is used for the blue-coloured Market–Frankford line and orange for the orange-coloured Broad Street line. (The Patco line would have been red.) Here was a missed opportunity to encode temperature data along the route.

Finally, if the sidewalk temperatures were measured at each station, I would want to see that data alongside and perhaps run some comparisons.

This is an interesting story, but some more exploration and visualisation of the data could have taken it to the next level.

Credit for the piece goes to Danya Henninger.

Hot Summer Days

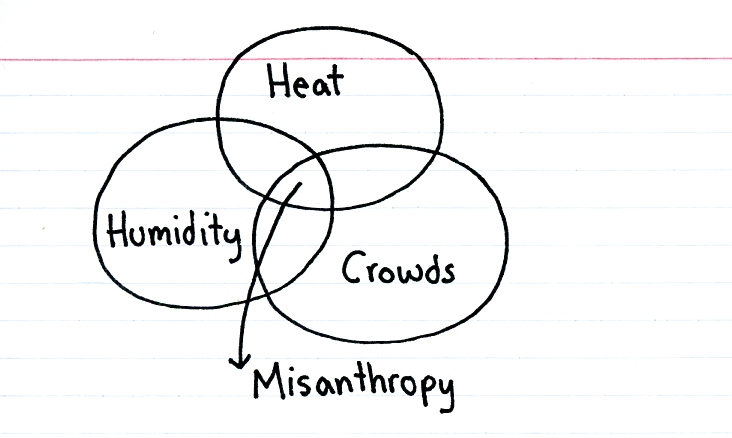
We made it to Friday, folks. So here in Philly it is, of course,  hot and disgusting. (Please refer to Tuesday’s post about the increasingly hot weather in summers.) Thankfully we have ThisIsIndexed to explain what happens in hot weather.

To be fair, I'm not sure misanthropy couldn't be in any other overlap…
To be fair, I’m not sure misanthropy couldn’t be in any other overlap…

Credit for the piece goes to Jessica Hagy.