Show Europe the Money

The Guardian has an interactive piece that details payments to and from European Union member states to institutions, determining whether each state is a giver or receiver.

Comparing payments and receipts in EU member states

The concept sounds all well and good. However, the piece itself feels clumsy with too much scrolling and whipping about to pan across the whole EU. The charts look a tad heavy—which could have been remedied for a more concise piece—and the callouts beg for a level of interactivity that is otherwise lacking.

Lastly, I have concerns about the list of countries at the top, although these may stem only from the point of view of an American not too familiar with Europe. Flags are not circles, they are, in most cases, rectangular in shape. Does cropping a symbol or icon of a country make it more or less useful of a symbol or icon? Furthermore, do the British recognise the flags of their fellow EU member states?

The country icons/flags call for some type of sorting function, to compare payments and receipts and their balance. But, instead, they sit there in unalterable silence, providing only an economic overview when clicked. An overview that through its staid design feels more like an afterthought.


Killed in Action in Iraq, State by State

The Iraq War is over. And now it is time to reflect on what we have gained and what we have lost. This map by the Guardian details the number of soldiers killed in action in Iraq. (Other options include total wounded, killed by non-hostile, &c.)

Killed in Action in Iraq by State

Unfortunately, I call it a ‘no kidding’ type of map. The data, accessible via the Guardian here, corresponds nicely with a list of states by total population. Of the top ten countries in KIA, only Virginia is not among the top ten in population; it is 12th. The country thus not in the top ten in KIA, but in population is North Carolina. It’s rank in terms of KIA? 11th.

The data is interesting and worth depicting if we are to reflect. But, perhaps a more suitable visualisation could have been chosen.

On a personal note, these Google Maps overlays are annoying when, in the cases of, e.g., Wisconsin and Massachusetts, the shapes are incorrect. Perhaps coastlines are not as easy as states with ‘straight lines’ for boders, but we would do well to try and make irregular coasts at least somewhat correct.

Exporting the Sun

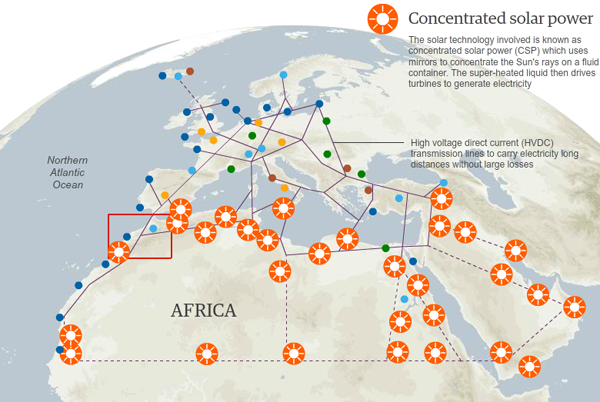
Plans are afoot to harness the power of the sun in the deserts across northern Africa. The electricity generated in Morocco is planned to turn on light switches in Madrid and throughout the rest of Europe.

The Guardian created a map to show how the solar facilities could be connected to each other and to other renewable power sources in Europe—from Icelandic geothermal plants to North Sea wind turbines to Alpine hydroelectric plants.

Renewable Power Map
Renewable Power Map

Credit for the piece goes to Christine Oliver.

Campaign Ad Spends

I don’t know about you, but to me, it’s beginning to look a lot like campaign season. At least from what I read on the internet. Because, according to this interactive piece by the Washington Post, there has been little local campaign spending on ads in the Chicago television market.

Mad Spending
Mad Spending

By clicking on the left, you are able to see the spending amounts and spending places of ads by both personal campaigns and interest groups. For national ad campaigns, there is a small outline of the continental US in the bottom left.

Above the map you have some facts about the spending and spending over time and a curious bit about whether the ads are positive or negative. Already if you move from the beginning to now, you can watch the positive ad number slip.

The BRICs a Decade Later

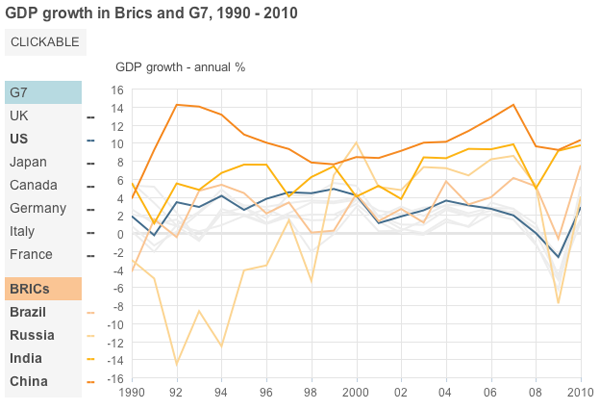
The BRICs are ten years old. Well, not really. But the concept of Brazil, Russia, India, and China becoming some of the world’s largest economies is. Well, not even that necessarily. But the coining of the term BRIC is a decade old. So the BBC has a small interactive piece showing why the BRICs matter.

BRIC GDP Growth compared to that of the US

They do some interesting things with the use of hues and tints to group lines in the line charts and provide consistent groupings throughout the piece. And they have photos of leaders. Just in case you do not know what the finance minister of Italy looked like back in 2001…just do not ask me to remember his name.

Maps of the Democratic Republic of the Congo

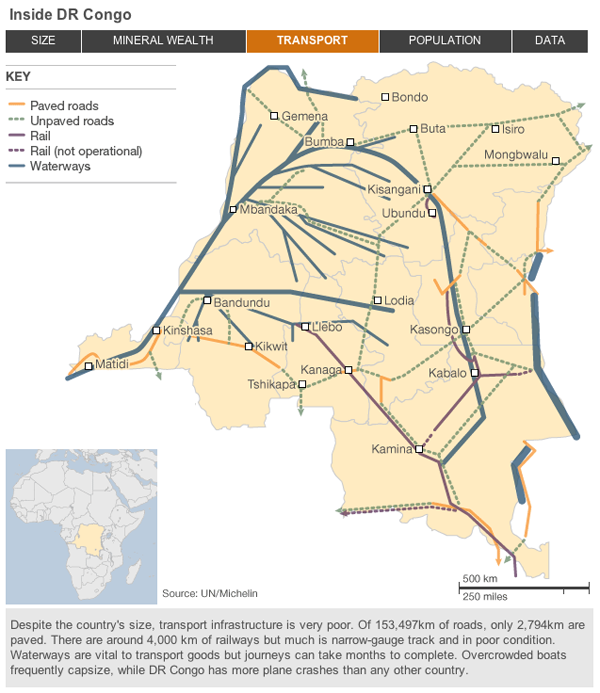
The Democratic Republic of the Congo is preparing for elections at the end of the month. For decades since independence from Belgium, the country has been beset by insurrection and civil war. Eastern portions of the country are all lawless and beyond the control of the government in the capital Kinshasa. Yet, DR Congo, which is almost the size of all of Western Europe, holds vast mineral and energy reserves.

Much like with the independence of South Sudan, the BBC has released a small interactive piece detailing DR Congo through maps. While not as extensive and lacking in visualising anything about the warfare and bloodshed, the piece is useful to gain a brief insight into the complexities of the country and the sheer scale of its problems. But that is not wholly surprising as the title of the piece is Failed State: Can DR Congo Recover?.

Screenshot of a guide to DR Congo

The European Debt Crisis. Again.

Nearly a month ago, the New York Times released an interactive piece along with a printed infographic about the European debt crisis in an attempt to explain just what is going on; I wrote about it here.

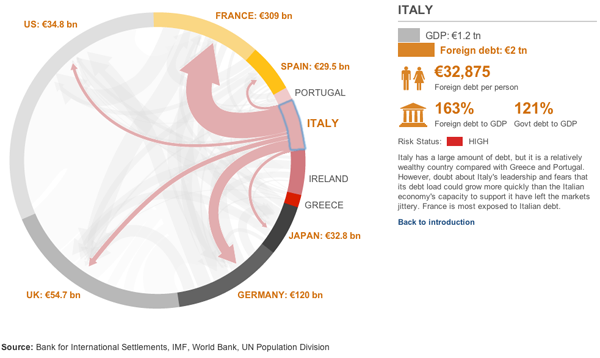
Now, the BBC has an interactive graphic showing how different countries relate to each other. The width of the lines relates to the amount of debt and the colours fall into three groups: red for high risk, yellow for medium risk, and grey for low risk. These are all fairly sensible and are echoed in the New York Times piece.

The BBC's explanation of the European debt crisis

However, one advantage of the diagram used by the BBC is that the arrows emerge from an arc and show the total amount of debt going to the selected European (and US) economies. At least, I hope they do. That is how I read it, but it is not explicitly stated. I hope that I am correct. If so, this is better than the Times version which simply has a proportionally wide line starting from a circle. But without other lines, one cannot see the useful supplemental information about how much total trade the country has.

One element that sticks out is the selected state of the diagram. This uses a blue line that is rather crudely drawn atop the arc. Distractingly so. The colour choice works as blue contrasts with the reds, yellows, and greys, but the execution of the line drawing is simply poor.

Overall, the data is interesting, and if my assumption is correct, and presents a more meaningful picture of trade relations between the chosen countries. However, the execution of the piece’s design does leave me wanting more. And that, given the need to tell this story both completely and correctly, is unfortunate.

Much Improved Mapping of American Migration

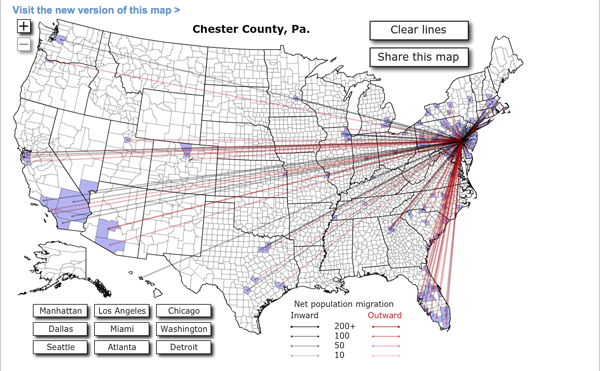
Forbes released Jon Bruner’s latest map of migration in the United States. It uses IRS figures to show inbound and outbound movement from counties across the United States. The work itself is an improvement from his map from last year, which was a bit more difficult to read. Beneath is the new version, and at the end, for comparison, the old.

This year's migration map

Firstly, the colour palette is far more sophisticated. Secondly, and most crucially, the user can hide the lines on the map, which obscures a key part of the story of migration in urban areas—higher income people moving out of the city and into the suburbs. Thirdly, the map data now includes additional years, which are available by clicking the small chart in the upper right—a welcome addition that allows the data from last year’s map to become accessible this year. Fourthly, and to be fair this may have existed previously but not that I can recall, the new map is accompanied by essays.

These essays use the map and its data to tell stories and explain what one sees going on with the data. It is (relatively) easy for one to put together a piece of data visualisation from a data set. But, without knowing where to look, users may not actually find anything valuable in the visualisation. By pointing to these essays, the map—already much improved from a design perspective—takes on a much more rounded and mature character and becomes more about generating information and knowledge than simply figures and statistics.

Last year's migration map

To Compare the Fares of Cabs

If you live in a big city, you’ve probably been running late, missed the bus or the train, needed to get home safely at least once. So you’ve probably taken a cab.

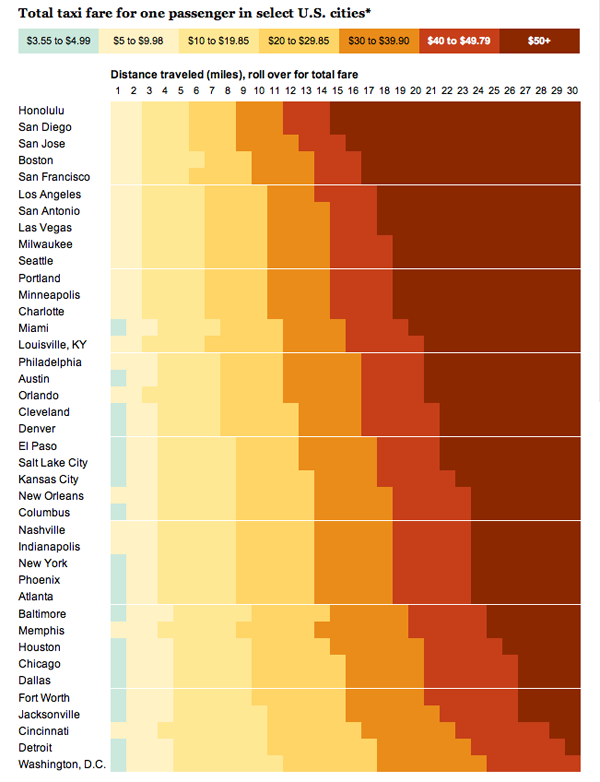
This interactive graphic from the Washington Post compares cab fares across a number of major cities in the United States. The cheapest cab rides are to be found in Washington D.C. The priciest are in Honolulu.

Comparison of Cab Fares Across Major US Cities

Credit for the piece goes to Todd Lindeman and Sisi Wei.

Can a Republican Win the White House?

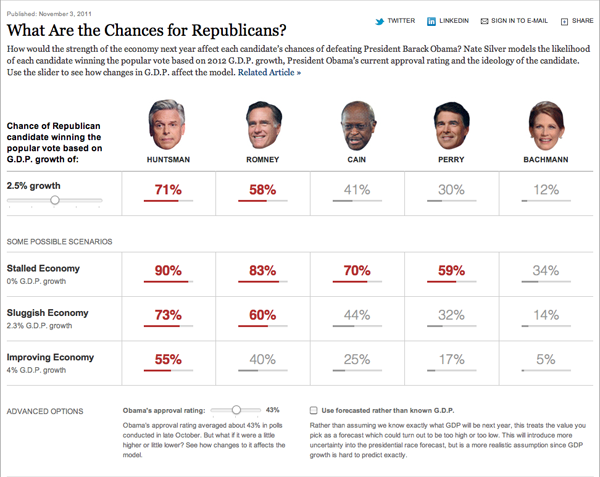
It’s Election Day. Well, not really. But, Nate Silver and the New York Times have come together to release an election simulator, if you will, focused on the chances that a Republican will win the White House.

Chances of Republican Candidates Winning the Election

You play with a few different variables to control the outcome: GDP growth and President Obama’s approval rating. These then are computed along with a few other things (I assume) and, like magic, you get to see your Republican pick’s changes of winning the election.

Keep in mind that these are just possible candidates, not necessarily likely candidates. John Huntsman, after all, is polling in the single digits in some of the early primary states. So while the moderate, centre-right, former ambassador to China, ex-governor of Utah looks almost unbeatable in several scenarios, I think most would agree that the Republican base will not vote for him.

But it is scenarios like that of Huntsman that are worth reminding us that perhaps the current party political system we have in the United States does not yield the best candidates for public office, nor the most broadly electable.