Urban Heat Islands

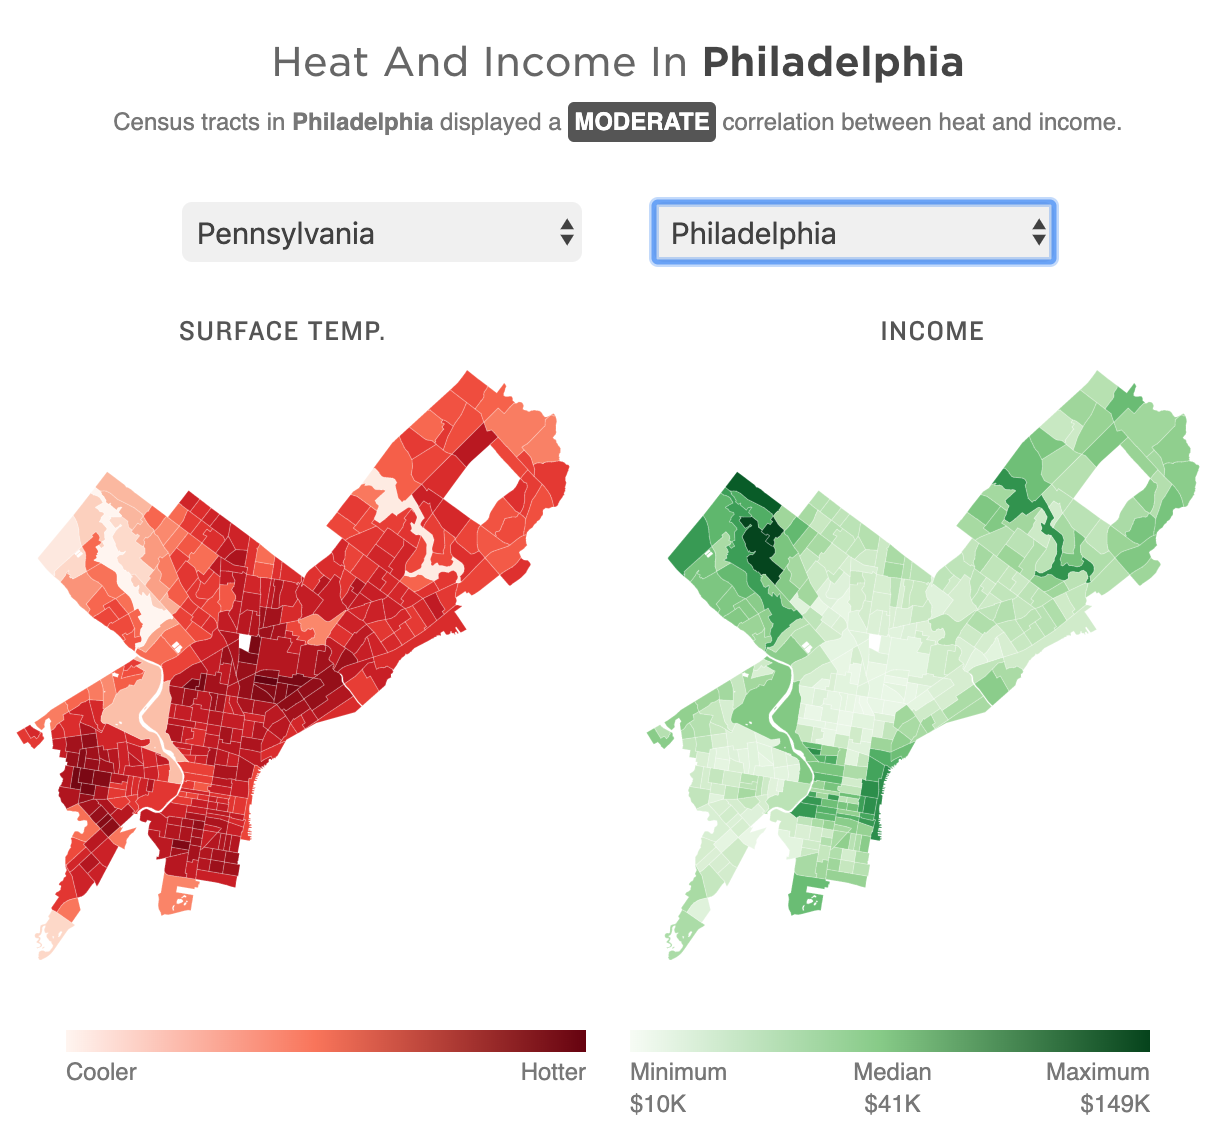
Yesterday was the first day of 32º+C (90º+F) in Philadelphia in October in 78 years. Gross. But it made me remember this piece last month from NPR that looked at the correlation between extreme urban heat islands and areas of urban poverty. In addition to the narrative—well worth the read—the piece makes use of choropleths for various US cities to explore said relationship.
My neighbourhood's not bad, but thankfully I live next to a park.
My neighbourhood’s not bad, but thankfully I live next to a park.

As graphics go, these are effective. I don’t love the pure gradient from minimum to maximum, however, my bigger point is about the use of the choropleth compared to perhaps a scatter plot. In these graphics that are trying to show a correlation between impoverished districts and extreme heat, I wonder if a more technical scatterplot showing correlation would be effective.

Another approach could be to map the actual strength of the correlation. What if the designers had created a metric or value to capture the average relationship between income and heat. In that case, each neighbourhood could be mapped as how far above or below that value they are. Because here, the user is forced to mentally transpose the one map atop the other, which is not easy.

For those of you from Chicago, that city is rated as weak or no correlation to the moderately correlated Philadelphia.

I lived near the lake for eight years, and that does a great deal for mitigating temperature extremes.

Granted, that kind of scatterplot probably requires more explanation, and the user cannot quickly find their local neighbourhood, but the graphics could show the correlation more clearly that way.

Finally, it goes almost without saying that I do not love the red/green colour palette. I would have preferred a more colour-blind friendly red/blue or green/purple. Ultimately though, a clearer top label would obviate the need for any colour differentiation at all. The same colour could be used for each metric since they never directly interact.

Overall this is a strong piece and speaks to an important topic. But the graphics could be a wee bit more effective with just a few tweaks.

Credit for the piece goes to Meg Anderson and Sean McMinn.

The US Abortion Rate

If you have heard enough about the Affordable Care Act, well, you could be listening to the desire to defund Planned Parenthood. Because, while that organisation cannot use any federal funding for abortions, it is the nation’s largest provider of that service. So if you follow that logic, you must strip all federal funds from the organisation.

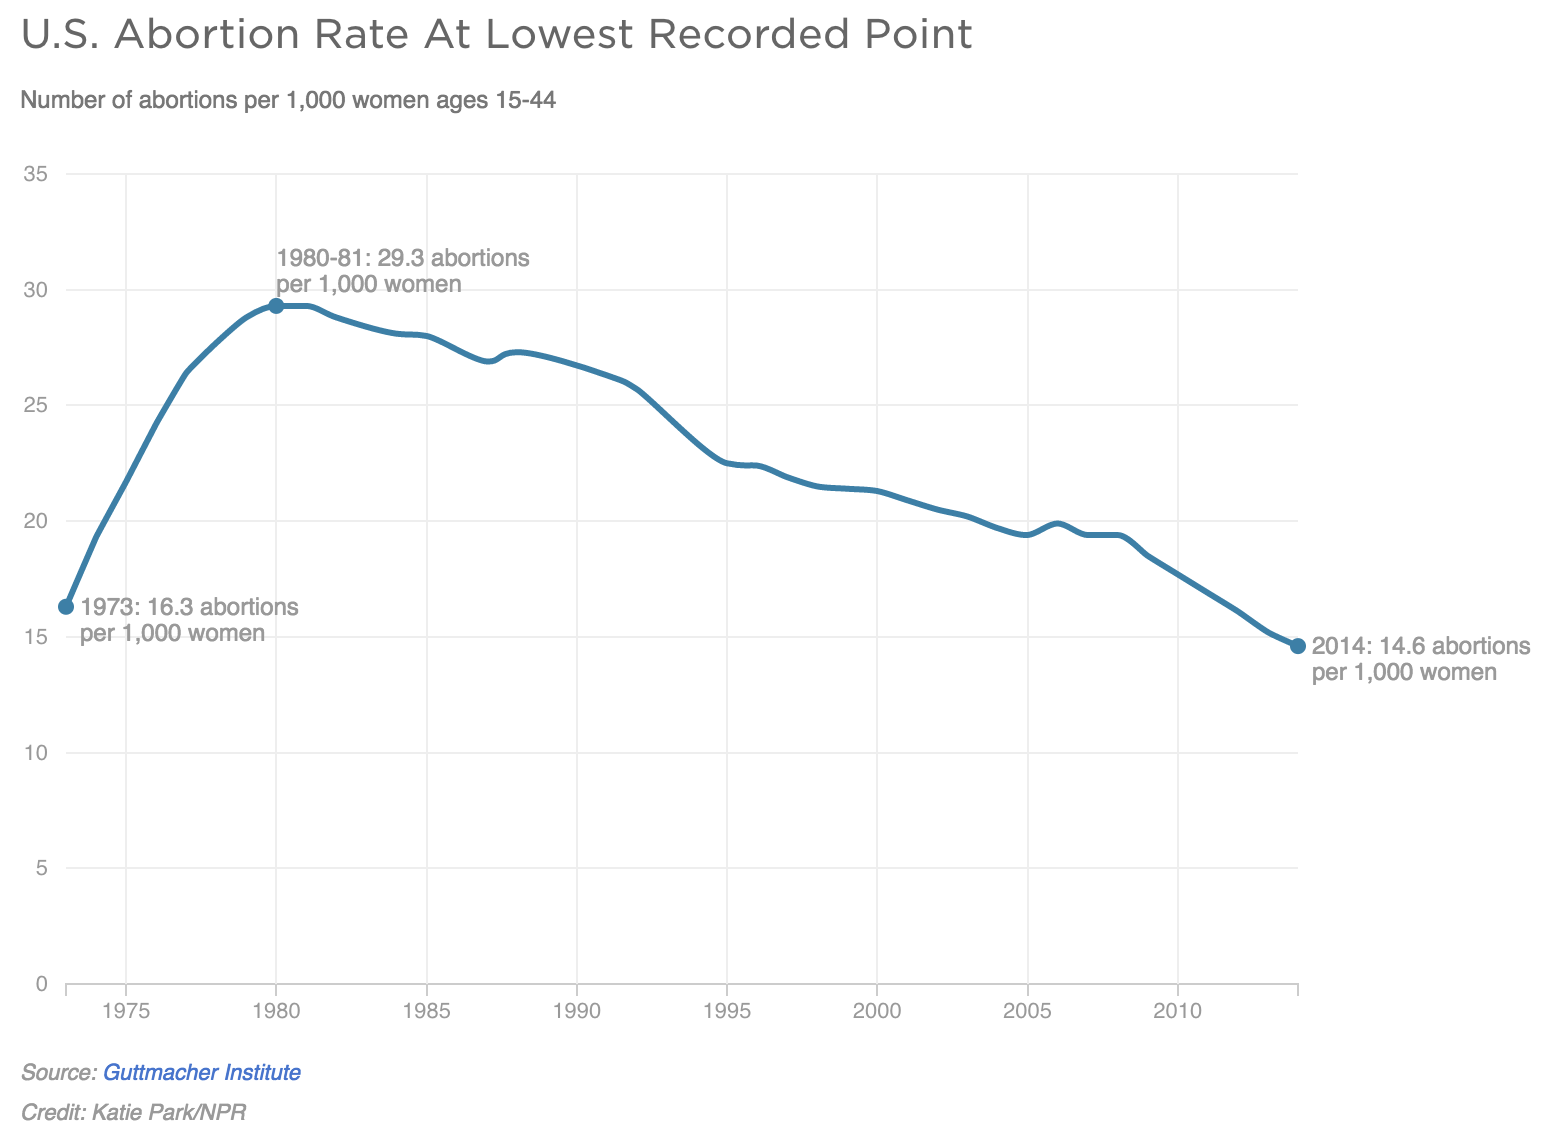
Yeah, it makes no sense. But whatever, those are part of the Republican plans. But, if you look at the data, abortion rates are now at the lowest level since Roe v. Wade in the 1970s.

The US abortion rate is at its lowest rate since Roe v. Wade

Mole hill, meet Mountain.

Credit for the piece goes to Katie Park.

Your State’s Power Sources

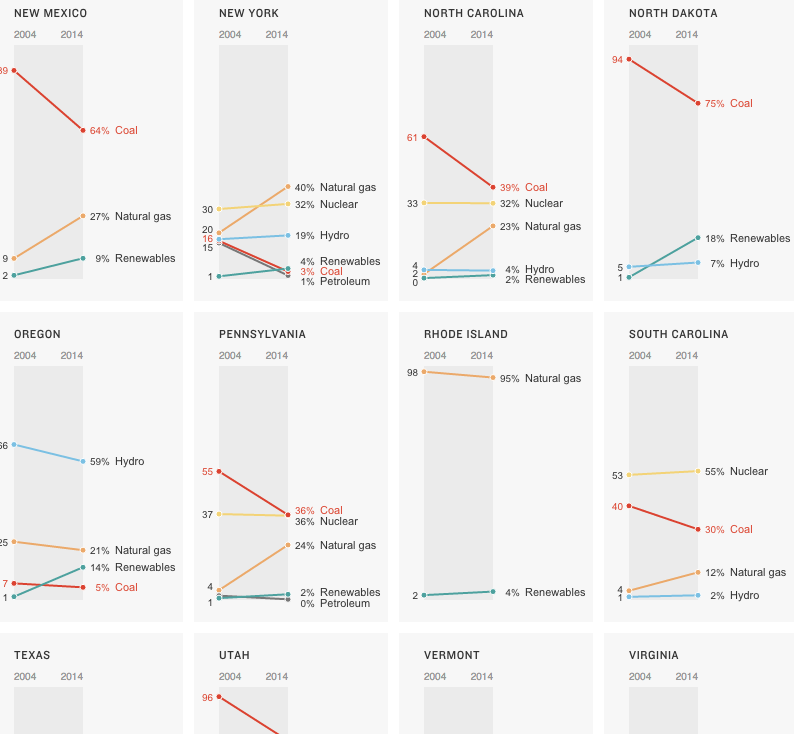
By now you should all know that I am a sucker for small multiples. They are a great way of separating out noise and letting each object be seen for its own. You should also know that I am a sucker for things industrial, e.g. nuclear power. So when you put the two together like NPR did earlier this month, well, I am going to be a huge fan.

All 50 states
All 50 states

Credit for the piece goes to Alyson Hurt.

Post-Katrina New Orleans

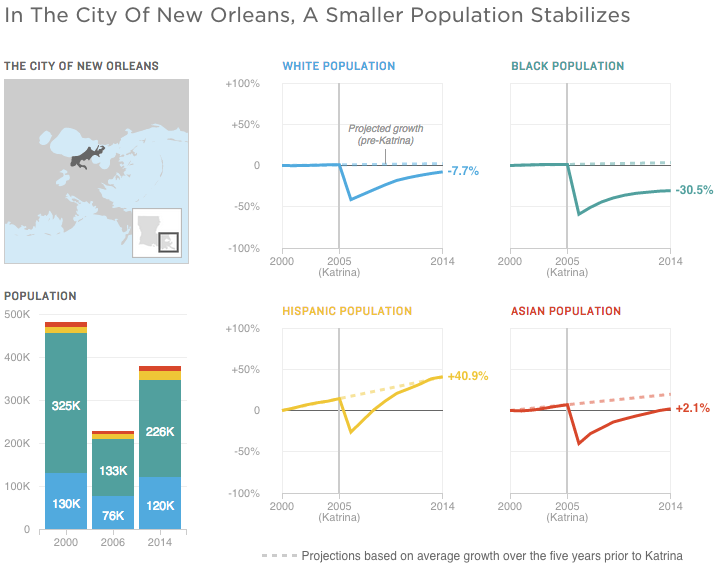
As the 10th anniversary of Hurricane Katrina approaches, NPR looked at how the population of the New Orleans area has changed. The piece is a nice combination of clean, clear, sharp graphics and insightful text.

The population of New Orleans proper

Credit for the piece goes to Paula Martinez, David Eads, and Christopher Groskopf.

It’s All the Hex

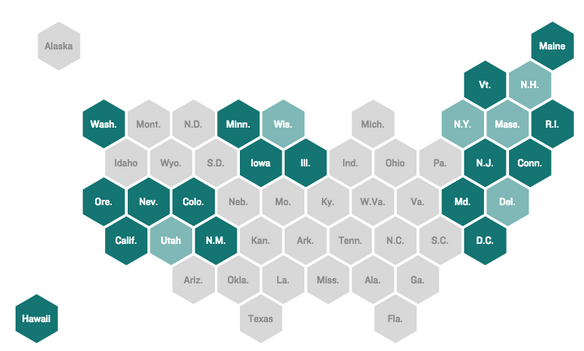
If you have not noticed, lots of news sites are using a variant of the cartogram lately. Basically, the idea is that geographic maps have the limitation of accurately representing landmass. And that means small polities, e.g. Rhode Island or Belgium, that might be quite important are visibly not so much, because they are geographically small. These pseudo-cartograms sort of do the trick by making all polities the same size. The trade off? Geographic fidelity. Anyway, there is an intelligent piece worth reading over at the NPR blogs explaining the thought process going on there about why to use the form. (You may recall I wrote about a similar project for London boroughs back in February.)

Hex map
Hex map

Credit for the piece goes to Danny DeBelius.

The Growth of Urban Walmarts

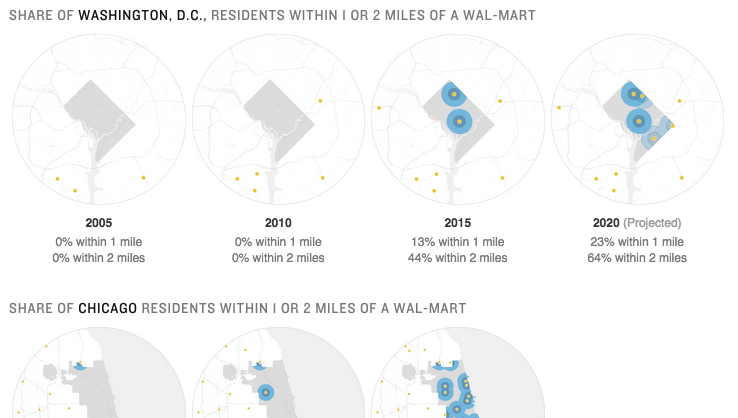
Today’s piece comes via my co-worker and is about the growth of urban Walmart stores. The article is from NPR and includes a nice series of small multiples of store locations in three select cities: Washington, Chicago, and Atlanta. In full disclosure, I live about two blocks from one of the urban Walmarts in Chicago. So go figure.

The growth of urban Walmarts

Credit for the piece goes to April Fehling, Tyler Fisher, Christopher Groskopf, Alyson Hurt, Livia Labate, and Ariel Zambelich.

Nice Work, Bro

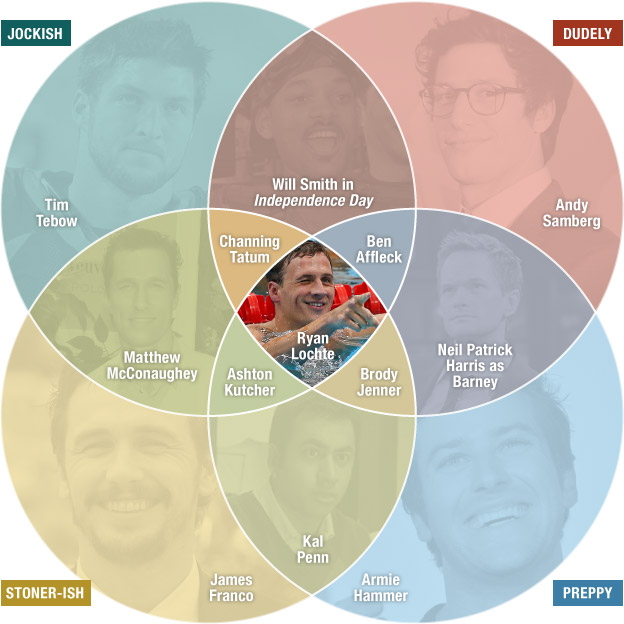
Bro. You have surely heard the term exchanged by young men to each other as a sign of friendship, greeting, &c. If you are like me, you are probably confused as to just what constitutes a bro. Thankfully the folks over an NPR analysed broness and compiled their findings into a Venn diagram that maps out the different types of bros. You should definitely head over to the piece and read up on the methodology, it’s worth the read. (And check out the video that epitomises the essence of bro-ness if for nothing else than a Philly news crew’s reaction to an interview with said essence.)

Bro-ness
Bro-ness

Credit for the piece goes to Alyson Hurt.