Explaining What is Going on in Ukraine

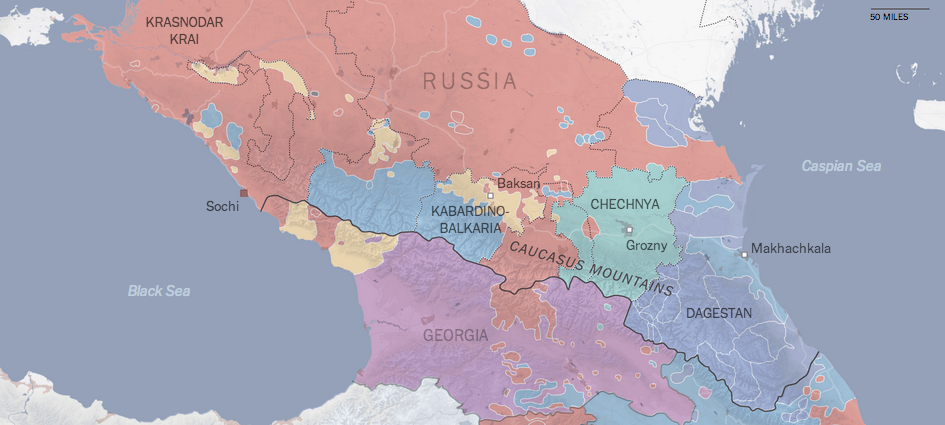
Not “the Ukraine” as it is (admittedly) fun to do in pop-culture references to Seinfeld. This comes from the Washington Post and the article tries to show that the protests in Kiev are not necessarily a vast majority against the government. Certainly the opposition is strong, but there is also a very strong pro-government movement. Why? Because in the broadest of senses, Ukraine is where the West, i.e. the European Union, meets the East, i.e. Russia.

A divided Ukraine
A divided Ukraine

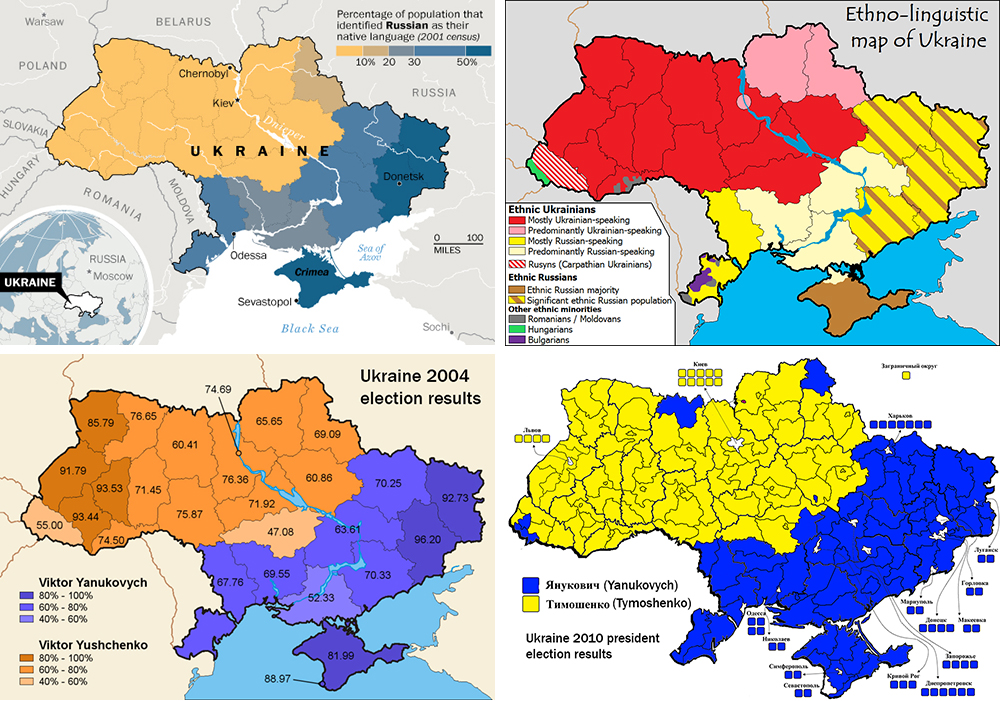
Credit for putting this all together goes to Max Fisher. Credit for each of the original graphics is to their respective designers whom I cannot identify.

Racing for Revenue

As the Winter Olympics continue, the Economist looks at a different kind of race. The race between companies reaching a certain amount of revenue—along with the net profit from said revenue. How long does it take a company to reach $1 million in revenue? When all companies have reached the same amount of revenue, what percentage is net profit? It’s a neat little interactive. Thankfully you can skip the race and get straight to the results, a nice design feature.

Race to $1 million
Race to $1 million

Credit for the piece goes to R.J., G.S. and K.N.C.

Living on the Minimum Wage

Last week the New York Times published a nice interactive about the minimum wage and just how difficult it is to live on it. (We will for now spare the charts that show how the actual purchasing power has declined over the years.) First you pick your state because not every state pays the same minimum wage. Then as you begin to enter figures for your expenses, or a hypothetical person as in this screenshot, you find how quickly a minimum wage earner runs out of money. And then how much debt they owe and how much more they have to work to pay it off.

A fictional person in Pennsylvania

Credit for the piece goes to Jeremy Ashkenas.

Happy Valentine’s Day

To celebrate, here’s a cropping from an infographic about breakups. From a whole series of graphics about breakups. You can thank me with some dead and rotting flowers.

Breaking Up
Breaking Up

Credit for the piece goes to Lee Byron.

Speed Skating

Today’s post comes from a co-worker and looks at the increase of speed in speed skating in the Winter Olympics since 1924. It does a nice job of showing the increase in the speed. Because to a degree, the increase has not been linear. Instead, it really only increased in two spurts and recently has remained fairly constant.

Then to show how slight differences in speed impact an actual race. The times are plotted against the distance in a simulated race. That shows that seemingly incremental increases in speed can have a drastic impact on where one finishes a race.

Race around the rink

Credit for the piece goes to  Andrew Garcia Phillips.

Mapping Economic Mobility

This piece from the Washington Post examines the idea of economic mobility. That is, what is the likelihood that children born and raised in an impoverished family will surpass their parents’ standard of living.

Economic mobility
Economic mobility

Credit for the piece goes to Darla Cameron and Ted Mellnik.

Sochi and the Caucasus

The Olympics opened in Sochi this past weekend. Many of us may well be familiar with photographs of urinals without piping, or unfinished hotel rooms, or many other infrastructure problems, but there is a bigger issue facing Sochi. It exists on what the New York Times terms the edge of a war zone. Their overall piece is more text-heavy than graphic-heavy, but several maps lend context to this complicated region of the Russian Federation. If you’re curious to better understand the region, this is a good primer.

The linguistics of the Caucasus

Credit for the piece goes to the New York Times graphics department.

Drawing the World

The inability of people to understand geography beyond their own borders is not new. But today’s post uses that to create a new map—albeit from a limited sample. The creator of this map merged 30 different, hand-drawn maps into one to reveal the world as imagined by his sample.

Composite map
Composite map

Credit for the piece goes to Zak Ziebell.

Depicting Radiation

Today’s post is more about a means of illustrating radiation, less about quantifying it. Unfortunately the article is in German and I speak none of it. But, the context is that of the Fukushima Disaster. Make sure you click through to see the illustrations in action.

Radiation
Radiation

Credit (I think) goes to Interactive Things and Neue Zürcher Zeitung.