Black and White Maps

Rarely do I have criticism for infographics or pieces published by the New York Times, and admittedly this time I no longer have the original. However, in May, the Times published a map that was printed in black and white in their paper. I could not make heads or tails of what the map was attempting to say. I later found the online (and full-colour) version of the graphic. Because I no longer have the paper on me, I took the image and then discarded the colour information to simulate the effect.
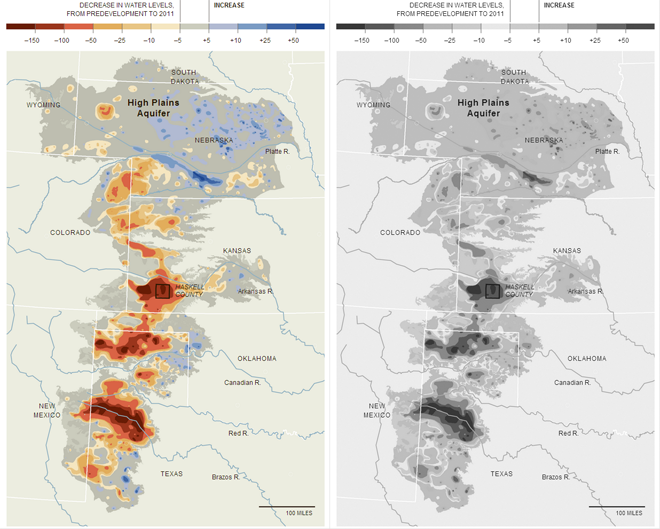
Comparing colour to black-and-white, link to the colour version

One must always beware of the ultimate use of their designed work, be it an infographic or something else entirely. If one designs for digital, online display, he or she can rest relatively assured that colour will be available for their piece. However, in a black and white print environment, the colour here in a divergent palette fails to communicate the split between increases and decreases in aquifer levels. I would have expected a different palette or the use of patterns for the print version of this story.

Credit for the piece goes to the New York Times Graphics Department

Political Pangea

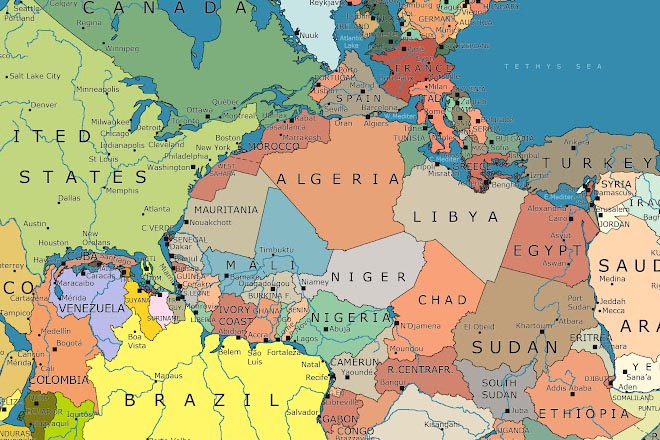
Theoretical/hypothetical maps can be a lot of fun, as well as informative. Today’s post exemplifies both. Pangea was one of those super-continents where all the Earth’s landmass was mashed together into one giant continent. It broke up a few hundred million years ago into the geography with which we are roughly familiar. But I have always been curious which places were where. But thanks to this map, I no longer have to wonder.

Political Pangea
Political Pangea

Credit for the piece goes to Massimo Pietrobon.

On Holiday in Ganister

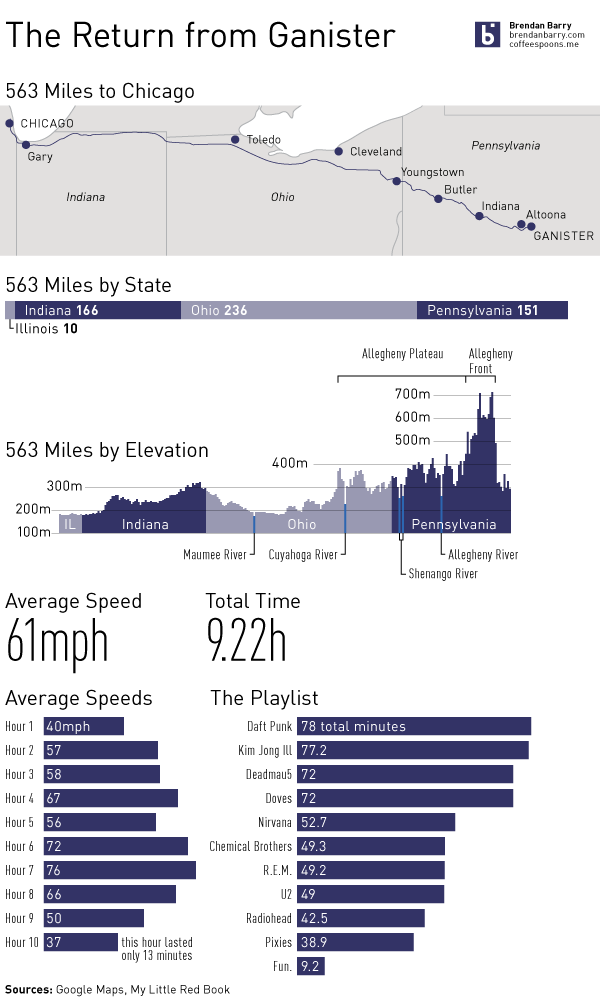
Well, actually, your author is driving back from Ganister today. Unfortunately, while on holiday I was not working (nor was I planning to.) So while I could of run silent today, I wanted to share with all of you again a project I created last year about my return drive from Ganister. For all of who familiar with the piece, I apologise for my re-posting of previous work. For those of you unfamiliar with the work or with Ganister and its distance/remoteness, enjoy. (It’s full-size, so no click-for-higher-resolution.)

My return trip from Ganister from 2012

The United States Compared to the Rest of the World

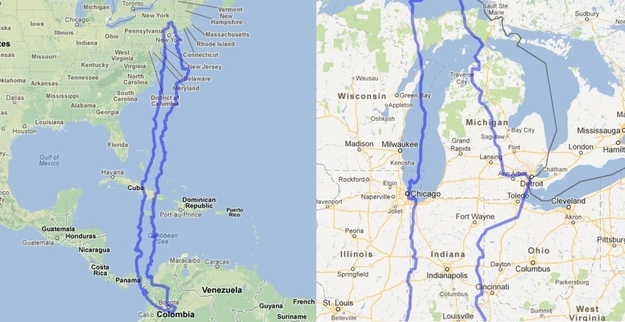
Have you ever wondered how big the United States is? MAPfrappe allows you to compare different geographies in Google Maps.

My employer has an office in Chicago and an office in Santiago, Chile. How big is Chile? North-to-south it is quite large. But east to west, the distance is like that of driving from Chicago to Detroit.

The United States compared to Chile

Via BuzzFeed.

The Threat of Climate Change

We are warming the planet. And like ice cubes in a glass of water on a hot summer’s day, Earth’s ice caps will, over the course of centuries, begin to melt and contribute to a rise in sea level. Unfortunately, most of the world’s population lives close to shorelines or the rivers connecting continental interiors to the sea. The world for the generations of children following us may very well look much different than it does today.

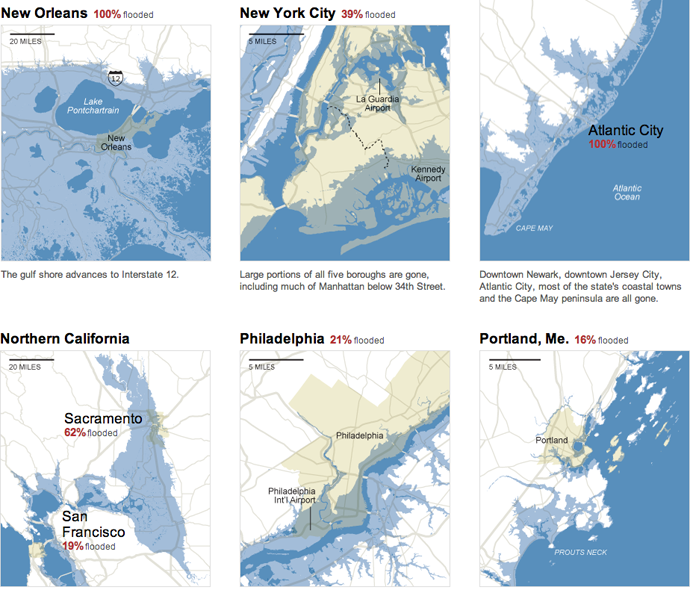
The New York Times uses an interactive piece to show how sea level rises will impact coastlines and inland ports in the United States. Using a slider, the user can investigate sea level changes of the expected five feet over the next one to three centuries, or two longer-term scenarios that are not yet certain but possible. Below are a few of the 24 cities and metropolitan areas.

The impacts of a 25-foot rise in sea level

In Philadelphia, a rise of 25 feet inundates South Philly, Old City, Fishtown, Kensington, Port Richmond and the other neighbourhoods close to the Delaware. The Jersey Shore still exists. It has just moved dozens of miles inland. The Cape May Peninsula is well submerged.

Credit for the piece goes to Baden Copeland, Josh Keller, and Bill Marsh.

Palestine

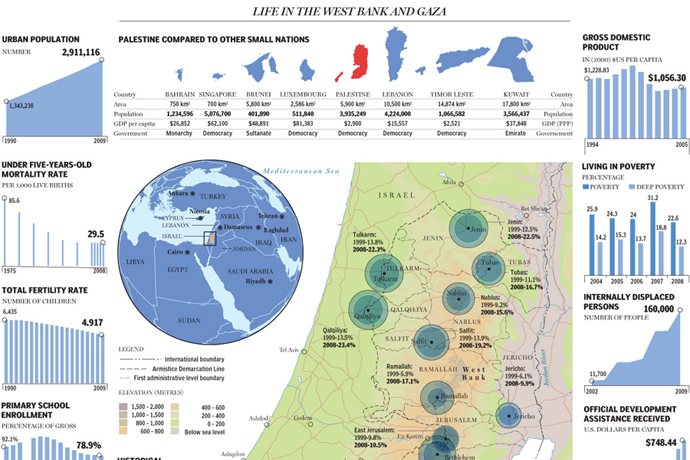
With Palestine admitted to the United Nations as a non-member observer state, the Middle East tensions between Israel and Palestine have reached a new level. Regardless, Palestine may now have access to international institutions and is closer to being a recognised, sovereign state. Toronto’s National Post published a large infographic looking at the state of Palestine and how the two non-contiguous territories of the West Bank and the Gaza Strip compare to each other.

An infographic looking at Palestine

Credit for the piece goes to Richard Johnson.

Climate Change

When I was younger—albeit not by much—I applied my interests in geography, history, and politics to create maps of fictional places. I used knowledge of things like the Hadley cell and the Koppen climate classification system to figure where on the maps I drew people would be able to live in temperate climates and where nobody could live because it would be an arid desert. I also read encyclopedias growing up, so go figure.

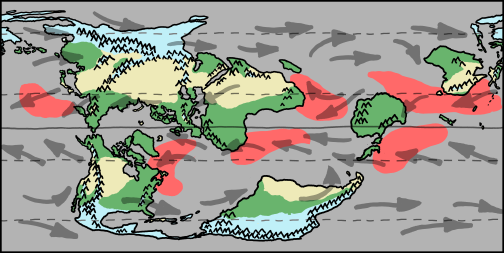
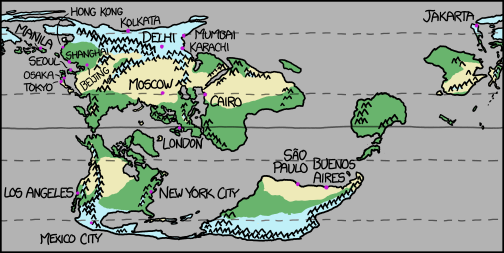
But I never bothered to apply my amateurish interest in geography and climatology to Earth. Rather, to an alternate Earth. But Randall Munroe over at xkcd did take a “what if” about a rotated Earth’s surface and investigated what would be the results. Of course he is also not an expert and even after thousands of years of living on this planet, humanity has yet to figure out all the variables that determine climates. But he gave it a shot. And he explained how it works (in theory). The result is called Cassini.

Climate of Cassini
Climate of Cassini

Blue is cold; think Siberia. Green is temperate; think rain and trees and, well, green things. Yellow is arid; think deserts. Red is hurricane zones—appropriate for summer. Think, well, hurricanes.

Cities on Cassini
Cities on Cassini

Turns out Philadelphia would still be a great place to live. Just saying.

Indo-European Language Origin

Polonius once asked Hamlet what he was reading. Hamlet replied “Words.”

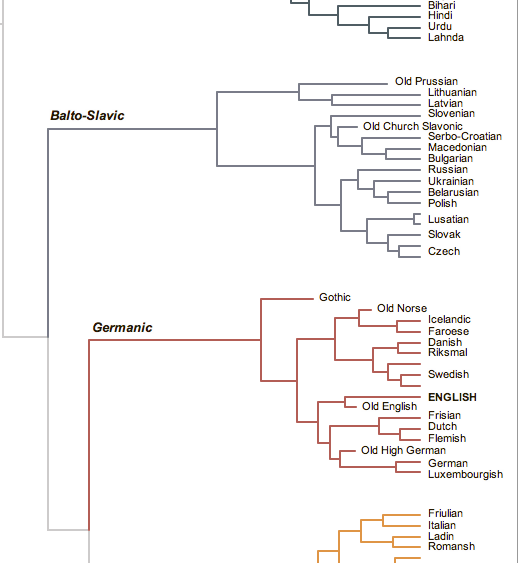
I still love that scene. But, it turns out that we now have an even better idea of where our words came from. It turns out that it is more likely that our shared Indo-European languages originated not in the steppes of Russia but rather Anatolia in Turkey. The New York Times created a graphic that looked at just how the Indo-European family of languages can be broken out.

Branches of our family tree


World Bank—Mobile Phones

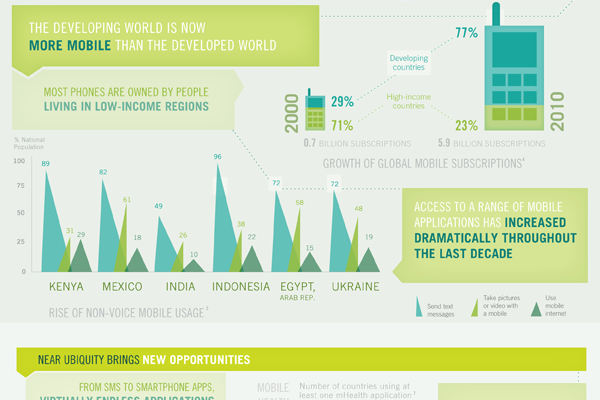
A little while ago the World Bank, generally a rich-country club that doles out loans to the developing world, published an infographic looking at mobile phones and their presence in the developing world.

The piece supplemented a report and is rather large. It actually exists as two separate images. The cropping below focuses just on how people in the developing world use mobile phones. Overall the piece is a bit weak in terms of data visualisation types and some of it is a bit confusing, but the story is clearly worth telling. And fortunately there are more hits than misses.

Developing world usage


Drought Footprint

A lot of people’s minds may be on the Olympics that open up today in London. However, a very important story that was covered a little while ago deserves a post.

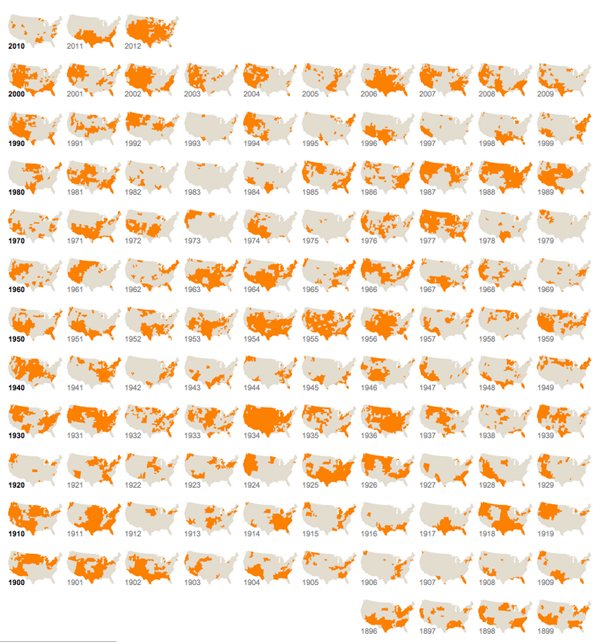
The United States has been suffering from a severe drought across much of the country. Droughts are nothing new, though climate change is likely to increase their intensity in the coming decades. This means more than lawns with dead grass; it means crop failures. Crop failures mean lack of food for humans and cattle. That means lower supply while demand holds steady. That means increasing prices. That means increasing pressure on already straining household budgets. Ergo, severe droughts can be a big deal.

The New York Times charted the geographic spread of droughts over the past century as small multiples. The print version was different, alas I have no photo, but the online version neatly groups maps by decade. Of some interest is how similar the scale of the 2012 coverage is in relation to that of 1934, the year of the Dust Bowl.

Drought
Drought

Credit for the piece goes to Haeyoun Park and Kevin Quealy