Pennsylvania’s Polls

Again, the election is next week. And since I have moved from Chicago to Philadelphia, I now find myself in a contested state. This piece comes from the New York Times and explores the polling results across the blue-leaning-but-still-a-swing-state. I find it particularly interesting just how much red and purple there is in the suburban counties of Delaware, Chester, Montgomery, and Bucks all surrounding Philadelphia. But that will only make my vote matter more than it would have had were I still living in Chicago.

But you should also check out the piece for some updates on the Senate race we have going on here. The Republican Pat Toomey is running for re-election against the Democrat Katie McGinty. The race can be described as a tossup as the polls seem to be flipping back and forth. But there is some interesting polling data to be found in the article.
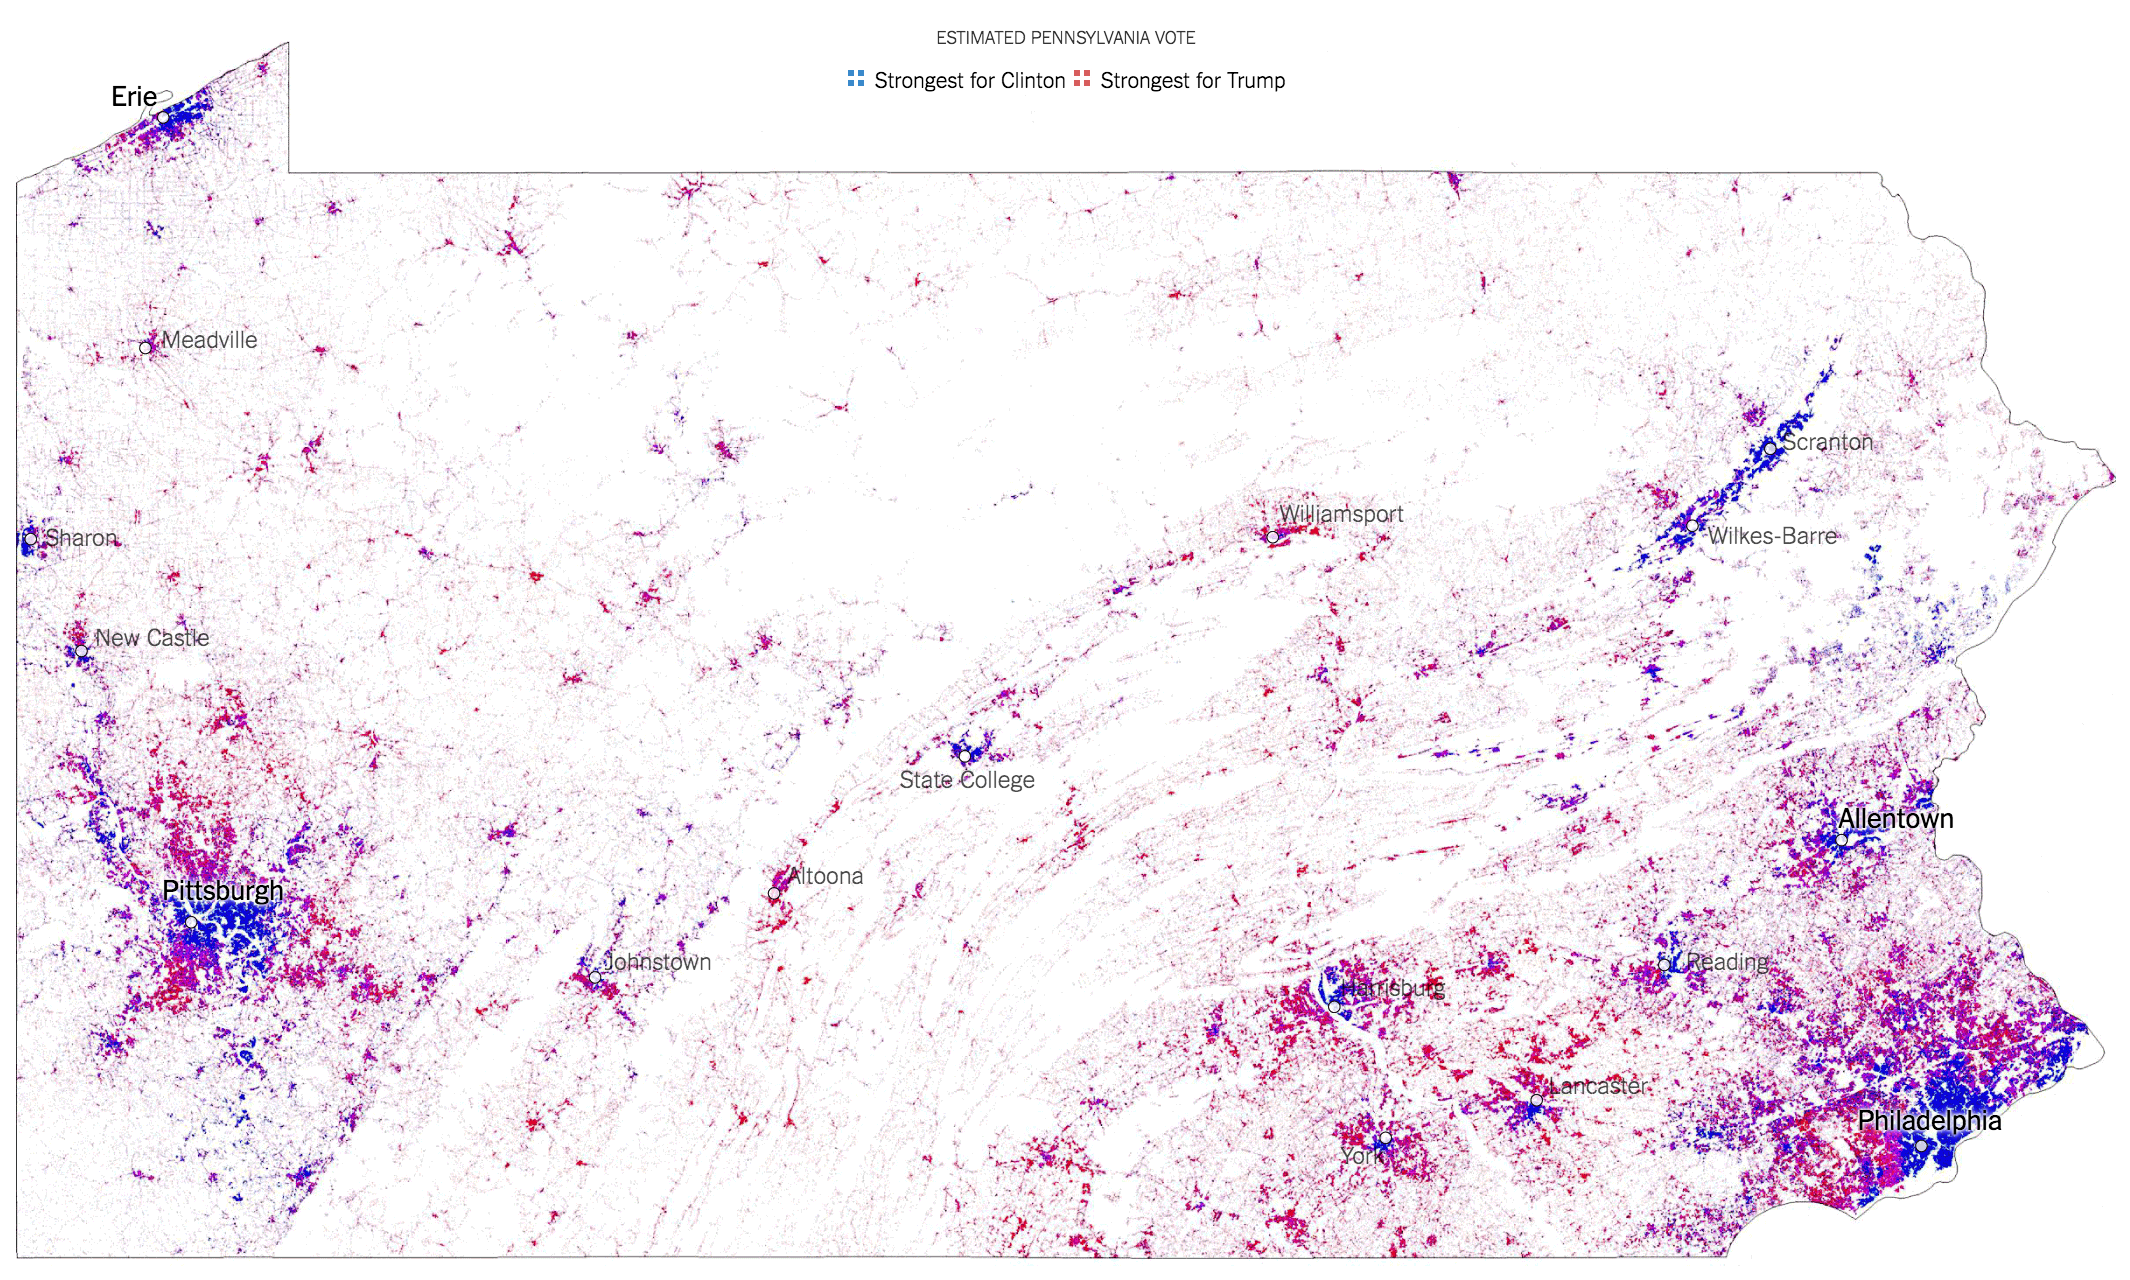
Pennsylvania's pre-election support
Pennsylvania’s pre-election support

In about a week we will see just how Pennsylvania goes for both the presidential election and the Senate election.

Credit for the piece goes to Nate Cohn.

Covering Terrorism

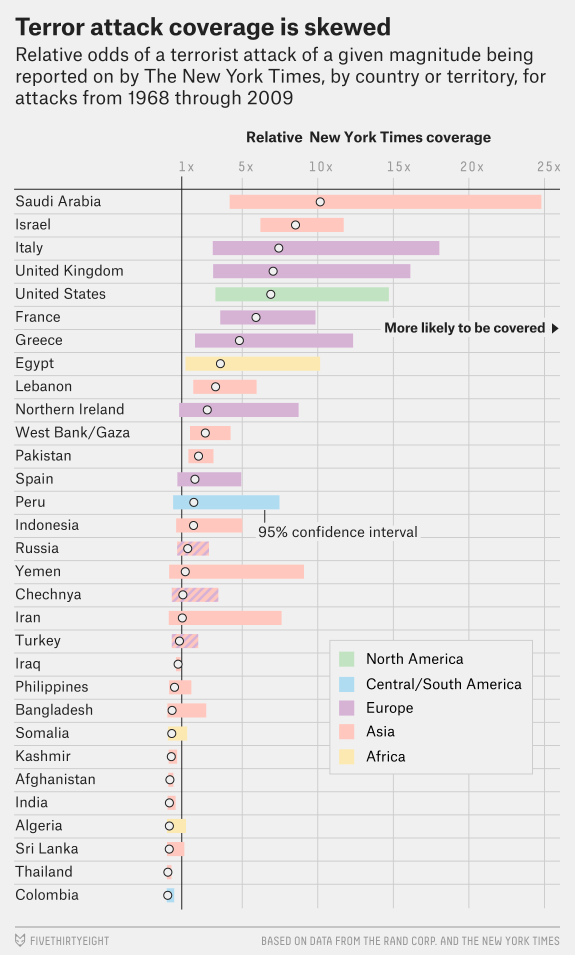
Last week we witnessed the lorry attack in Nice, France. This week we have the axeman attack on a German train. Does anybody note, however, the recent terror attacks in Dhaka, Bangladesh? Probably not, according to this insightful piece from FiveThirtyEight. They took a look at journalism’s coverage of terror attacks and whether there are discrepancies based on geography. Turns out that yes, there are. But, the article does make a point to note some reasons why that might be. One, we have covered it a lot more often since 11 September 2001. Anyway, the whole piece is worth a read.

All countries are equal, but some are more equal than others

Credit for the piece goes to the FiveThirtyEight graphics department.

Mapping a New America

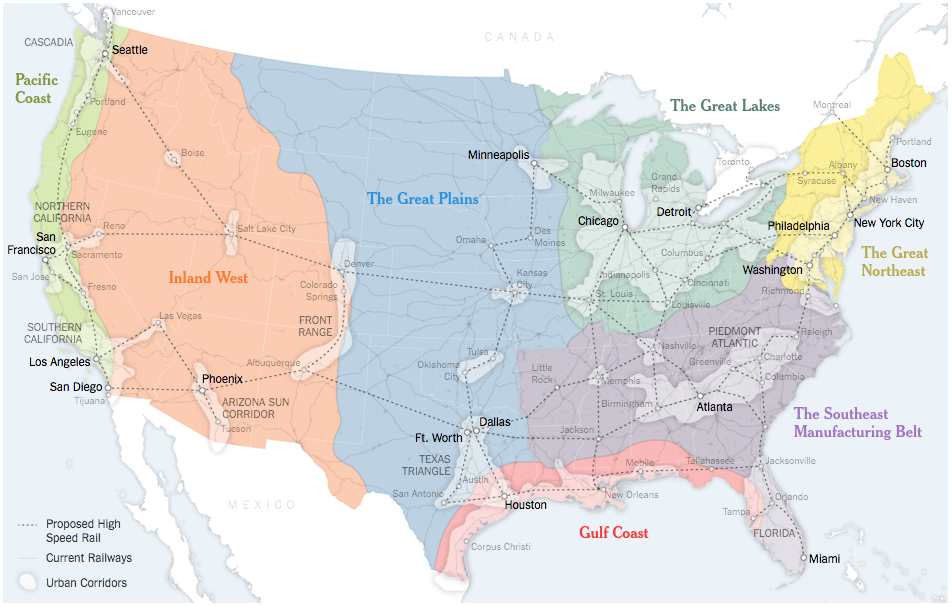
The United States of America consists of 50 states and hundreds of cities. In Sunday’s edition of the New York Times Parag Khanna argued for the switch of priority away from the state-level and to effectively the city-level. We have clusters of cities that dominate and drive the national economy.

The classic case-in-point is Bowash, the megapolis of interconnected cities from Boston to Washington, where there is a plan to extend Baltimore’s MARC public transit train to Wilmington, Delaware. If that were to happen, one could take public transit from the northern suburbs of New York City to Washington through Trenton, Philadelphia, Wilmington, and Baltimore. But today, those decisions must be taken as many as six different states. What if it were handled by a single, regional body?

The Great Northeast
The Great Northeast

The above map looks at what a New America could look like, as grouped into seven different regions and their urban clusters.

Credit for the piece goes to the New York Times graphics department.

Living on the Grid

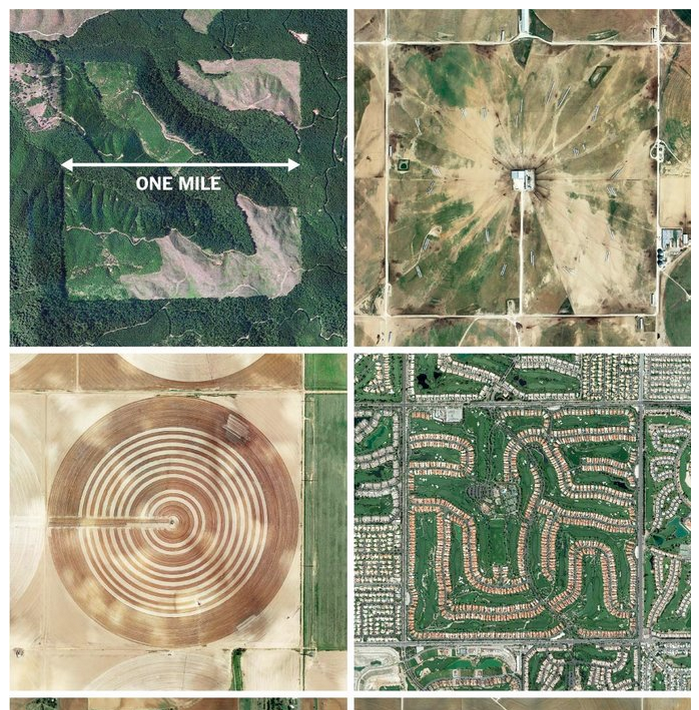
Today’s post relates very much to yesterday’s post. But this one is from the New York Times and uses aerial photography to showcase how the Jefferson grid system works in reality after it was implemented as shown yesterday.

The Jefferson grid
The Jefferson grid

Credit for the piece goes to the person behind the Instagram account @the.jefferson.grid

Organising Western Lands

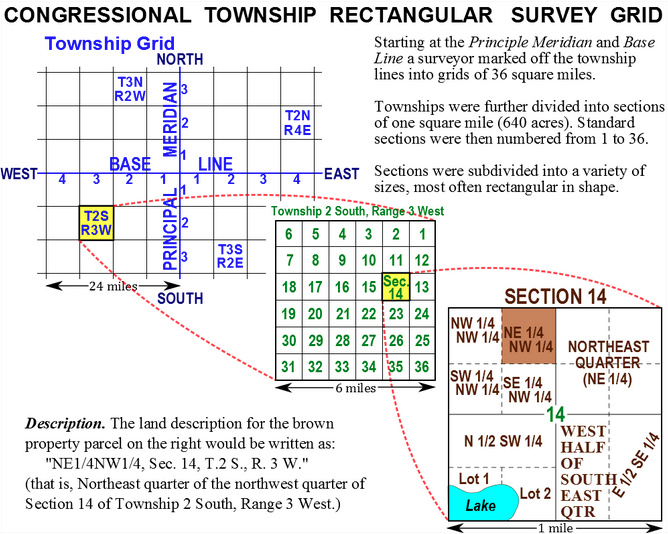
A few weeks back I looked at my ancestral family’s land grant in Wisconsin. Unlike land on the East Coast that was surveyed and organised by pioneers in different colonies using different sets of rules, after the formation of the United States, surveyed land was organised into townships that had subdivisions. In this blog post I found about the subject, there are several diagrams and maps that explain just how this system worked.

How western lands were organised

If you’re curious about how western land was organised, its worth a quick read.

Credit for the piece goes to Living History Farms.

What Time Is It?

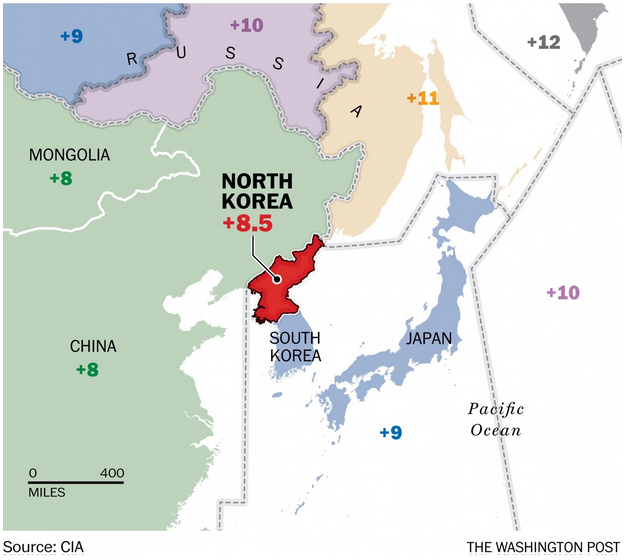
North Korea Time!

But no, seriously, North Korea announced this past Friday that it is placing itself inside a new time zone. This Washington Post piece has a graphic that looks at just how weird the new time zone is in relation to the rest of the region.

North Korea time
North Korea time

Credit for the piece goes to the Washington Post graphics department.

MH370 Found?

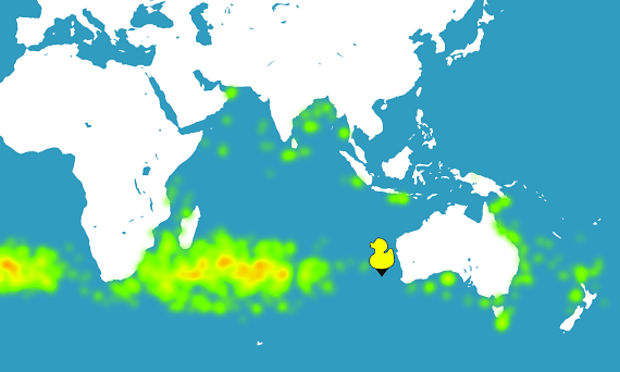
Last night (Central Daylight time), news broke that what might be part of the wing of a Boeing 777, which is the same type of aircraft as the missing Malaysian Flight 370, washed up on the French island of Réunion in the Indian Ocean. The Guardian was following the story last night and one of their reporters used a ocean currents simulator to see if wreckage from a crash off the coast of Perth (western Australia) could make it to Réunion.

Possible debris currents

Yep, it can.

Credit for the piece goes to adrift.org.au.

Your Average Daily Sunshine

(Hint, it’s not me.)

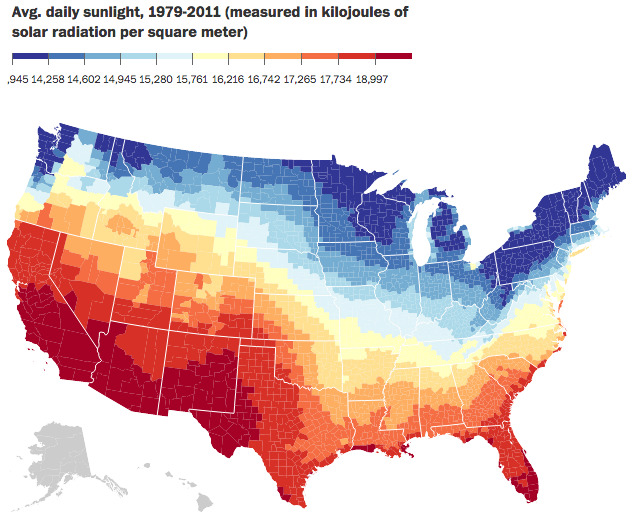
I was talking with someone the other day about how I dislike warm weather. Give me nice, cool, crisp weather any day of the week. And also how I am okay without sunshine—a cool, misty, grey day is lovely. Much of weather, of course, is determined by sunlight, energy, hitting the Earth. Well, just a few weeks ago the Washington Post published a piece looking at daily sunlight. At the end of the piece it has a nice small multiple graphic too.

Average daily sunlight

Credit for the piece goes to the Washington Post graphics department.

Water Level on Lake Michigan

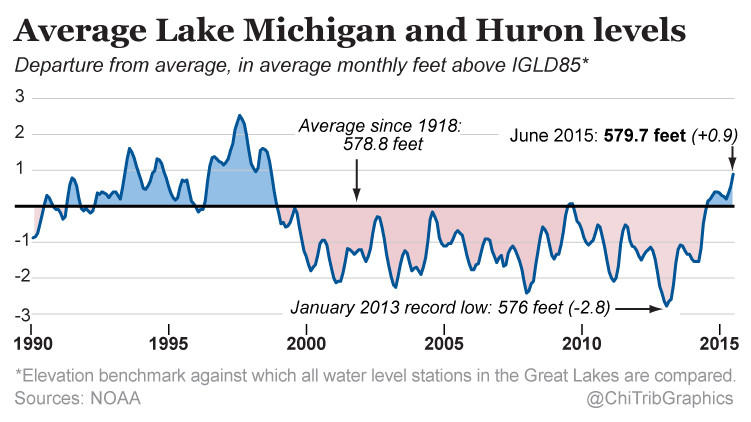
Today’s a little piece for those of you who follow me from the Chicago area. It turns out that in the last 30 months, the water level of Lake Michigan has risen three feet. Despite what some people think, Lake Michigan is not an ocean—I have overheard conversations in my neighbourhood about people who went “swimming in the ocean today” and want to show them a map that points out the Atlantic is almost a thousand miles away—and is not under the same threat as the coast via melting icecaps. The Great Lakes are instead impacted by other regional and cyclical patterns, e.g. El Niño. This article by the Chicago Tribune makes use of this small but clear line chart in its discussion of those very factors.

Water levels for Lakes Michigan and Huron

Credit for the piece goes to the Chicago Tribune’s graphics department.

ISIS Throughout the World

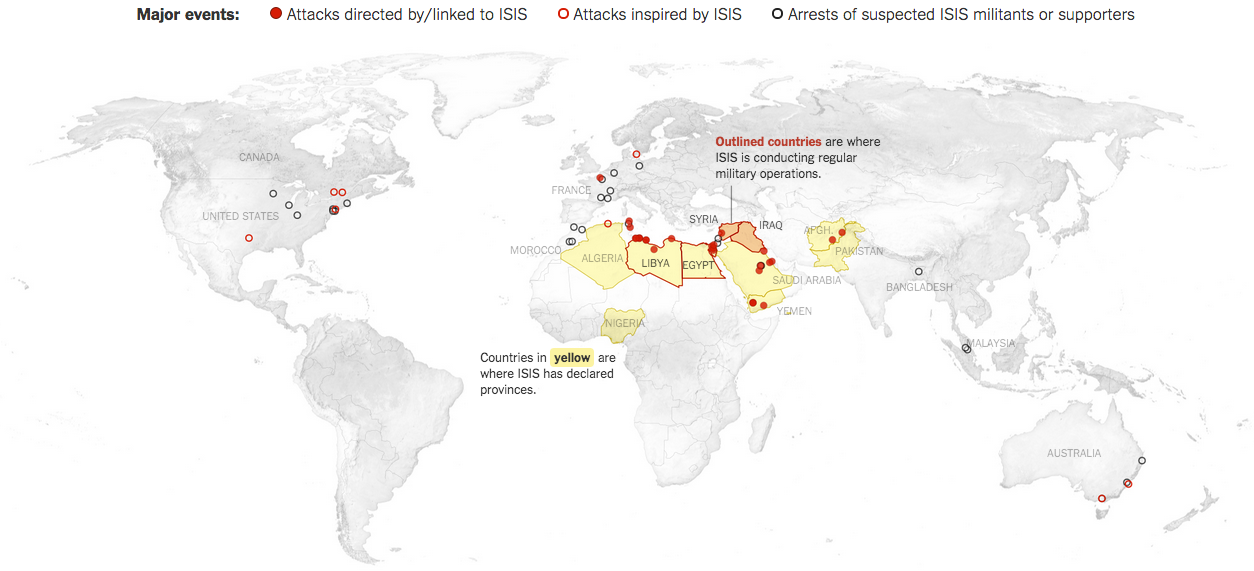
ISIS is still a threat to the Middle East, evidenced by the US announcing yesterday that it is intensifying strikes against the quasi-state in both Syria and Iraq. But just where has ISIS spread? And are its attacks spreading? This New York Times piece looks at just those two questions. The first through an obvious map.

The geographic reach of ISIS at all points over time

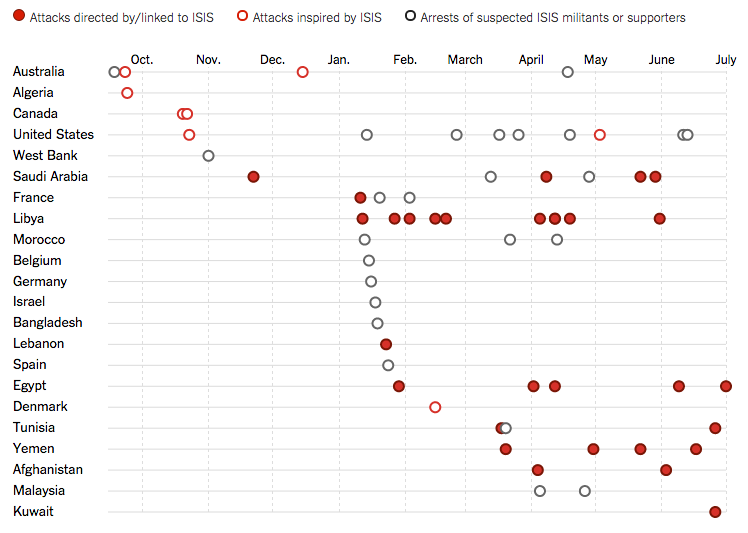
What the map does is show you where ISIS has attacked around the world over all time. So yes, it has global reach. But the map alone cannot show you if things are improving or getting worse. For that you need a visualisation type that can plot things over time. And as aforementioned, the piece includes that as well.

A spike in attacks this winter presaged a summer of terror

Unfortunately, it appears that yes, ISIS is attacking or at least attempting to attack more targets in more countries both within and without the Middle East and its declared provinces.

Credit for the piece goes to Karen Yourish, Derek Watkins, and Tom Giratikanon.