The Spellecy’s Wisconsin Land Grant

I have returned from my trip up north to Minnesota and Wisconsin. Unfortunately, from the research side it was not the most successful of trips. I did find some records, but none that answered any of the big questions I had. If anything, I now have far more questions. Most of the information I learned deals with the homesteaded land that John Spellecy received in 1888, at the young age of 70. It turns out by the time he was given the land by the US government, he had already made one contract to sell a portion of it. And so to make some semblance of it, I made this animation to show how the land grant disappeared over only a 12 year period.
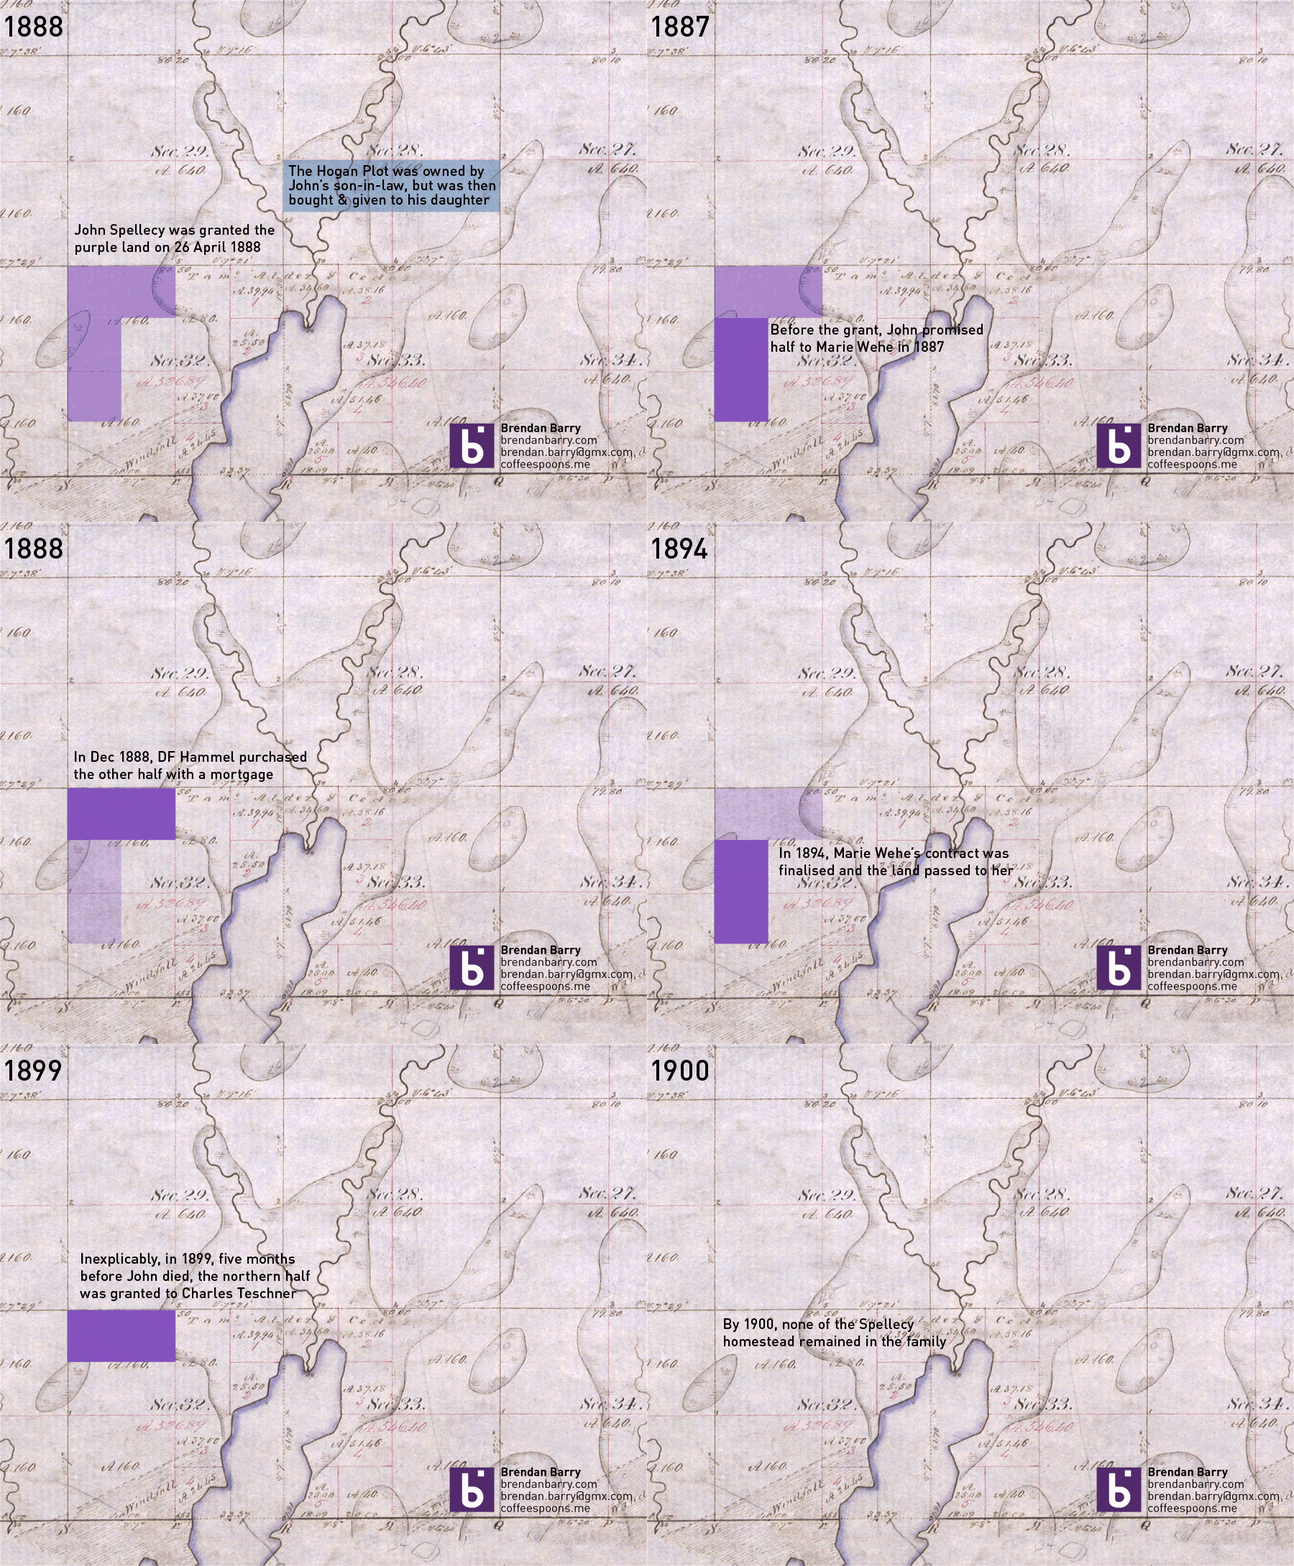
How the Spellecy plot disappeared

For the curious, the background image is a digitisation of the US government’s original land survey. The A.160 denotes 160 acres, the maximum allowed by a homestead claim.

Aquifers Around the World

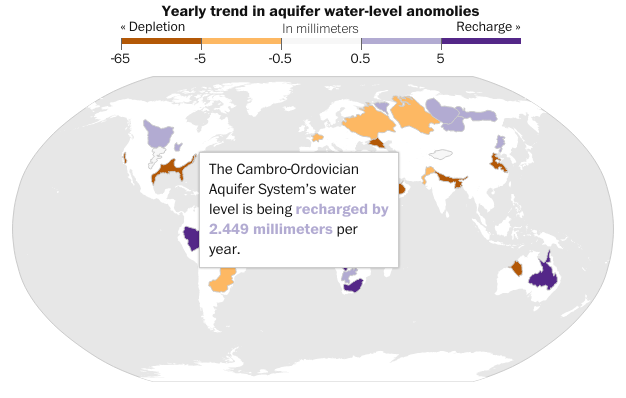
It has rained quite a bit in the south the last couple of days, thanks to tropical weather systems. But, as some new data from NASA shows us, the world is running out of water. That is largely because we drain large underground water systems called aquifers faster than the natural environment replenishes them. The Washington Post has a small interactive map that looks at the world’s largest aquifers and respective trend towards either being recharged or drained.

Aquifers are being drained around the world

Credit for the piece goes to Todd Frankel.

Native Languages of the World

Today’s post looks at an infographic from the South China Morning Post. The graphic in question looks at languages and how many speak them. Specifically, the graphic narrows the focus down to those native languages spoken by 50+ million people, of which there are 23 spoken by a combined 4.1 billion people out of the world’s 7.2 billion inhabitants.

Native language speakers

Credit for the piece goes to Alberto Lucas López.

Sex, Drugs, and Rock Oil

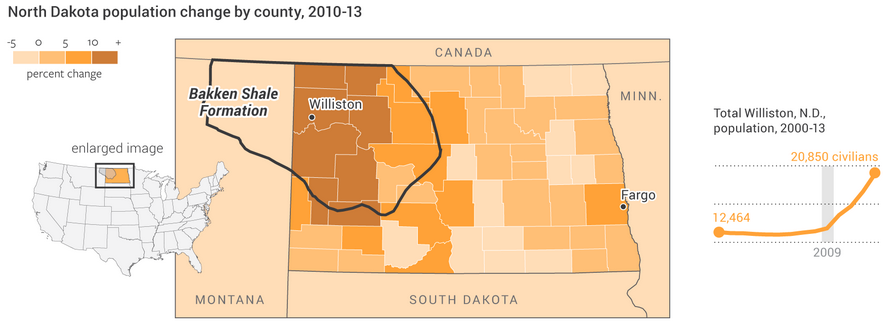
North Dakota’s economy has been booming because of shale oil. Most of that economic growth has been centred on what was the small city of Williston, North Dakota. Economic growth often leads to population growth, however, and that can at times lead to growth in less than wholesome economic activities. The National Journal took a look at the population growth in the area and what has been happening concurrently in a few metrics of the less wholesome sectors of the economy, i.e. drugs and prostitution. Turns out, they are both up.

Population growth in North Dakota

Credit for the piece goes to Clare Foran and Stephanie Stamm.

It’s Melting! It’s Melting!

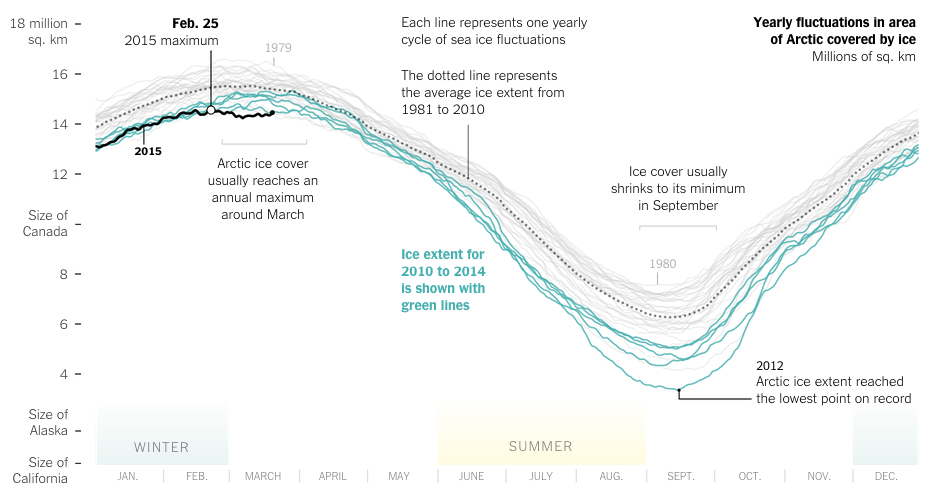
Spring has finally arrived. And that means that far to your humble author’s north, the sea ice in the Arctic is beginning to recede from its annual maximum coverage. However, this year’s coverage was the smallest since satellite records began in 1979. The New York Times covers the story in a nice article with two big data pieces. The first is a really nice map—not shown—that looks at this year’s coverage compared to average extents.

The really nice part, however, is a line chart of historical ice coverage from 1979 through to the current date. While the piece is not interactive, the annotations in the graphic do a nice job explaining the different lines and outliers. Overall, a solid piece.

Annual cycle of Arctic ice coverage

Credit for the piece goes to Derek Watkins.

Germanwings Flight 4U 9525

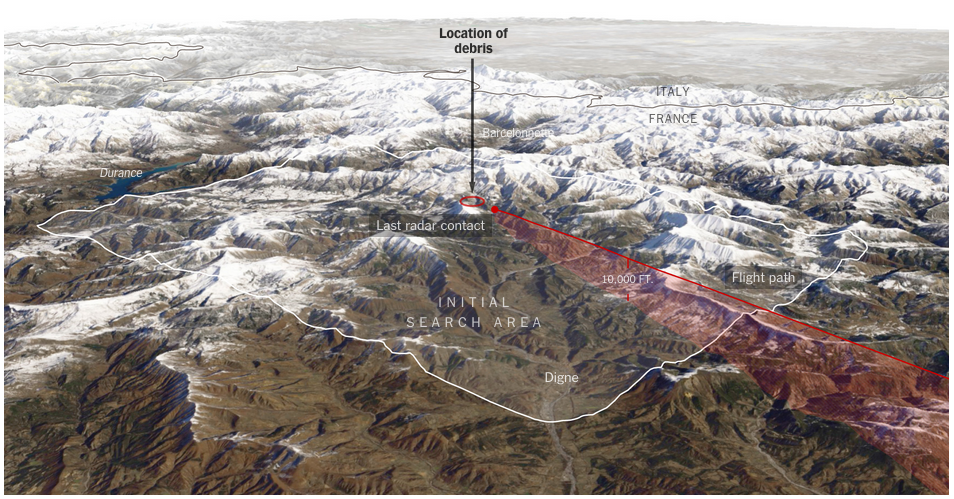
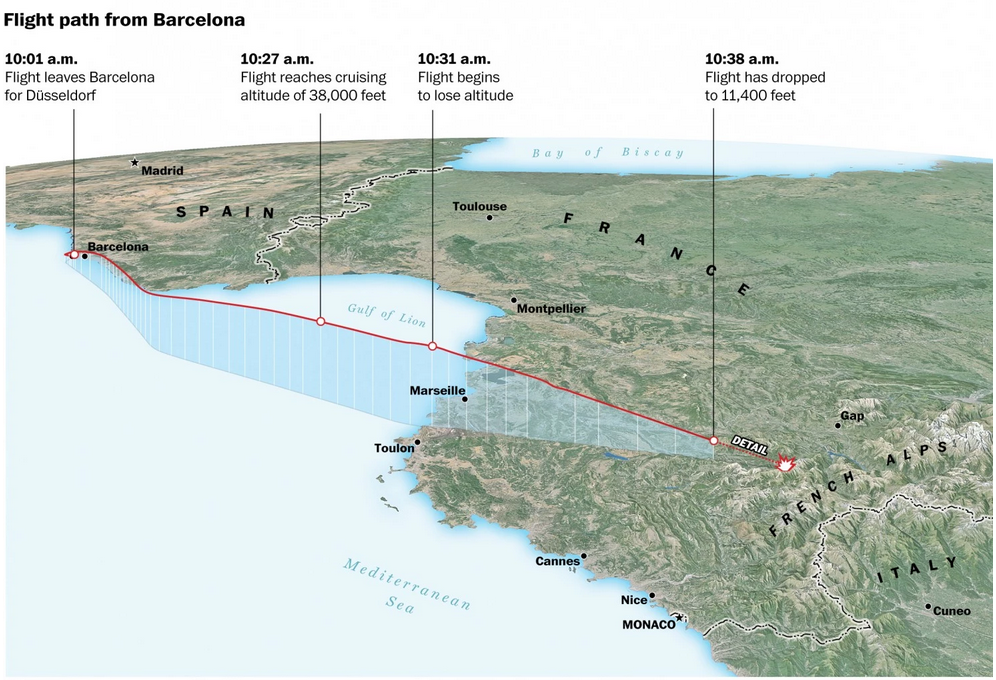
Yesterday an Airbus A320 operated by Germanwings, a subsidiary of Lufthansa, crashed in the French Alps with no survivors. This morning, I am showing the two best graphics I have come across thus far attempting to explain just what happened.

The first is from the New York Times. In a series of maps, it points out through satellite photography the roughness of the terrain and therefore the difficulty likely to be experienced by recovery crews. The final line chart plots the altitude of the flight, which fell from a cruising altitude of 38,000 feet to just over 6,000 feet in eight minutes. Overall, especially given the limited amount of information that we currently possess, not a bad piece.

The New York Times' explainer map
The New York Times’ explainer map

The second comes to us from the Washington Post. What I enjoy about this piece is that it combines the altitude chart with the map. This gives a bit context to the fact that despite being still 6,000 feet above sea level, the aircraft was in fact flying into the high mountains of the Alps.

The Washington Post's explainer map
The Washington Post’s explainer map

Credit for the New York Times piece goes to the New York Times graphics department. And credit for the Washington Post piece goes to Gene Thorp and Richard Johnson.

Moon Bases

Today’s post falls somewhere between just for fun and science reality. Remember moon bases? Newt Gingrich’s ridiculed comment about a habitable moon base by 2020? Well, one problem with colonies on other planets—or even interstellar transport for that matter—is radiation. The moon has no magnetosphere and no atmosphere. So it can be bombarded by both radiation and meteorites.

But, now we have lava tubes. Well, in theory at least. Scientists have run the numbers and found that if lava tubes exist on Mars, they would be structurally sound to support colonies within lava tubes. And that brings us to the raison d’etre of today’s post: the diagram used to explain that science.

I present you all with your hypothetical moon base: New Philadelphia.

New Philadelphia looks just like today's Philadelphia
New Philadelphia looks just like today’s Philadelphia

Credit for the piece goes to David Blair.

The Urban Future

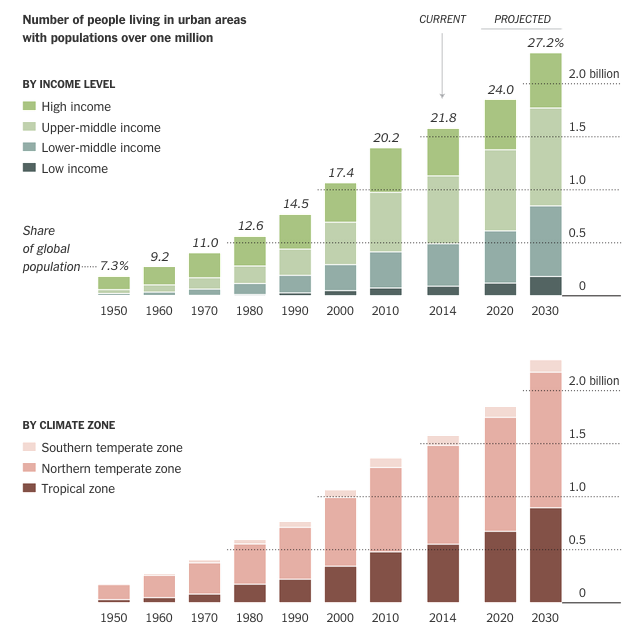
Today’s selection is a little old—dating from July of last year—but is still a nice example of an inline graphic supporting the premise of its accompanying article. The New York Times looks at what was then data published by the United Nations on urban growth out to 2030. The article talks about the growth of megacities in lower income countries and those in the tropical regions. So smack in the middle of the article are two stacked bar charts breaking down urban populations into those two categories.

Urban population makeup

Personally I would have preferred a series of line charts to better compare the growth—the lack of a common baseline makes it very difficult to compare segments of the bars. But below the stacked bar charts we have a nice table. Those are always good to see. They organise information clearly and make it quick to find what is relevant.

Credit for the piece goes to the New York Times graphics department.

The Link Between Work and Transit

The Wall Street Journal recently published an interesting article about the link between work and access to transit. They included a graphic that looked at the link between the two.

Linking the two together

Credit for the piece goes to the Wall Street Journal graphics department.

The Reforestation of Europe

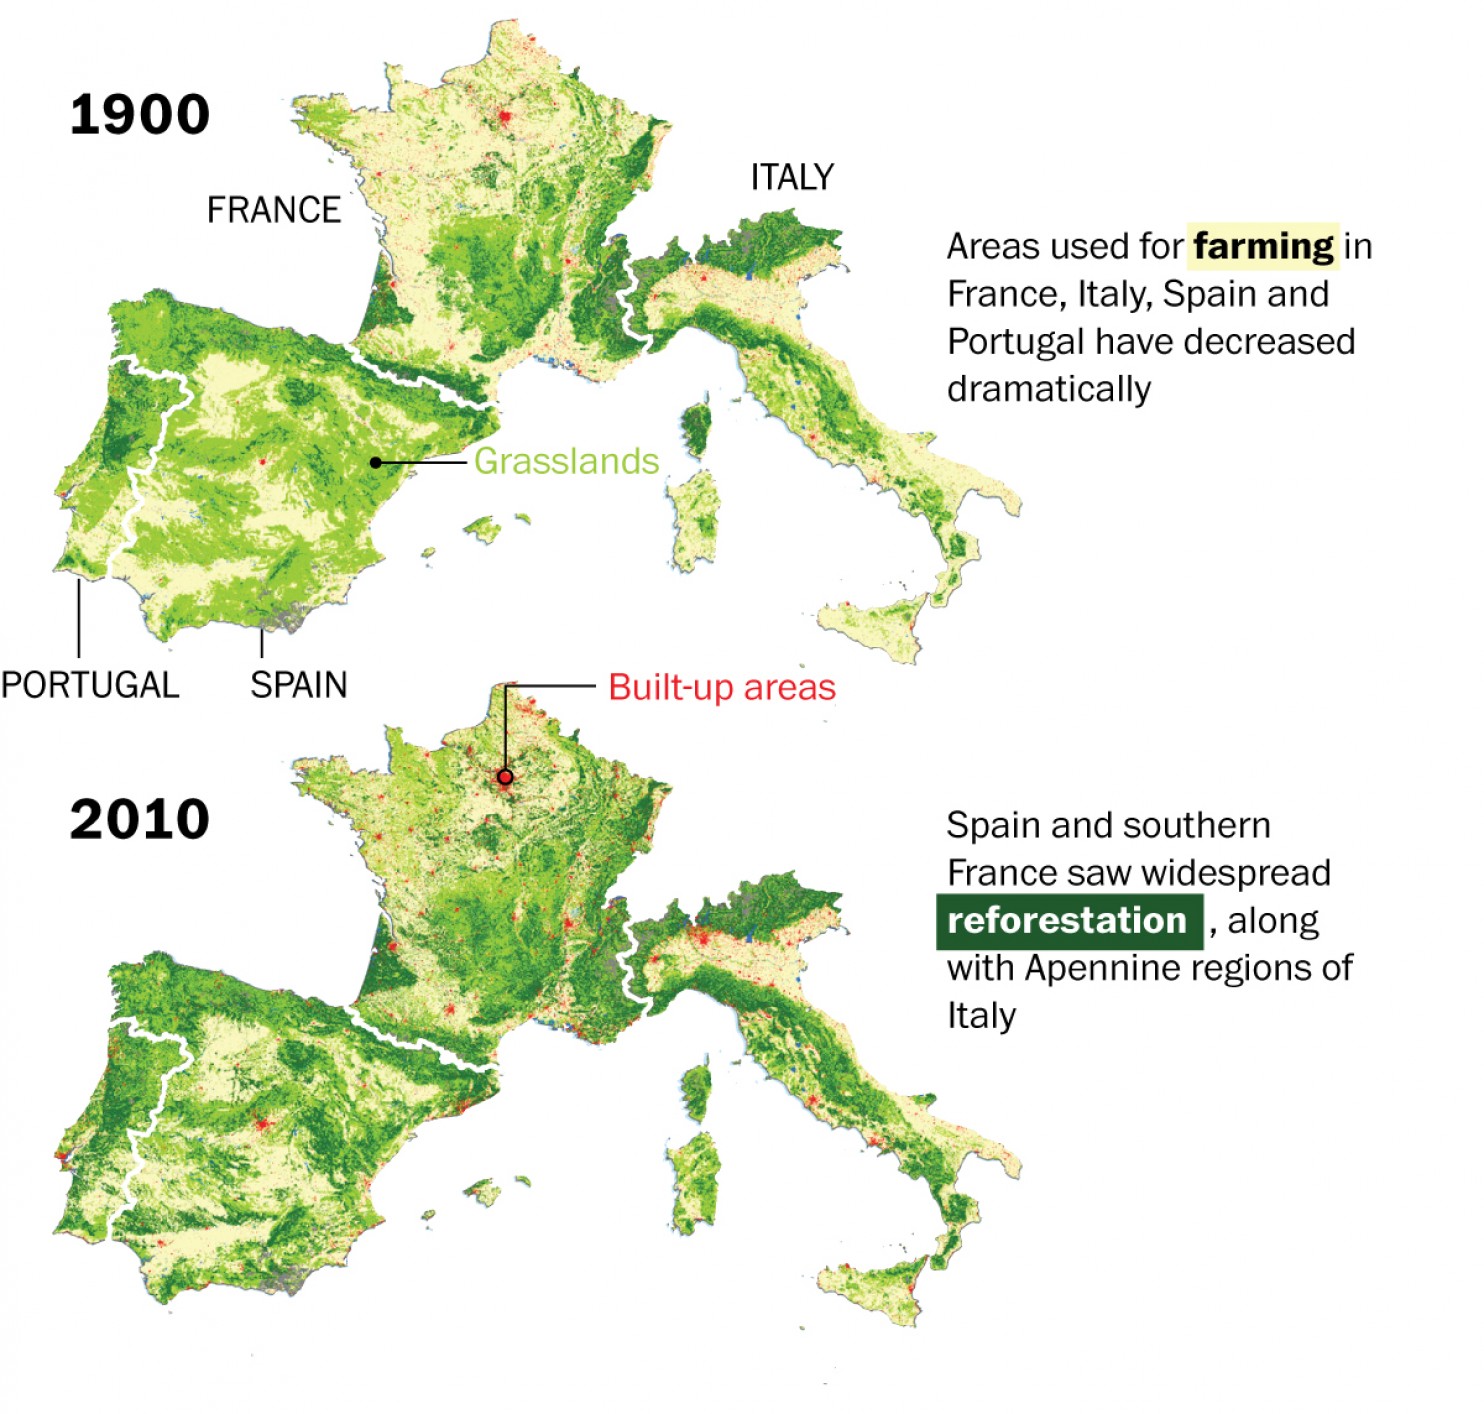
We hear a lot about deforestation around the world. But, in this piece from the Washington Post, we see how over the last century, Europe has actually managed to reverse that trend and reforest parts of the continent.

A look at the western Mediterranean

Credit for the piece goes to Rock Noack.