Comparing Elizabeth to Victoria

Following on from yesterday’s post about Queen Elizabeth’s timeline as she passed Queen Victoria, today we have another selection from the BBC that compares the reigns of the two queens. Unfortunately, while the screenshot below is okay, the overall graphics and illustrations strike me as a bit too simple and not terribly useful in making comparisons.
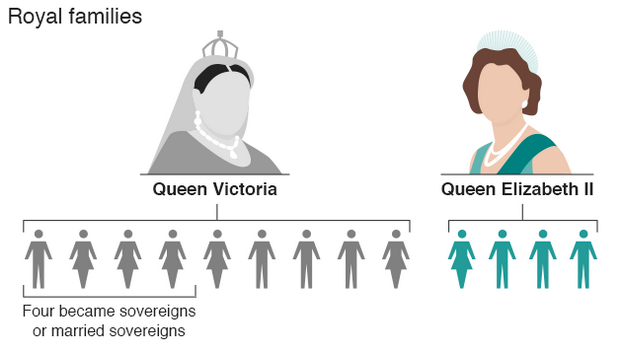
The royal families
The royal families

Credit for the piece goes to the BBC graphics department.

Queen Elizabeth II—Britain’s Longest Reigning Monarch

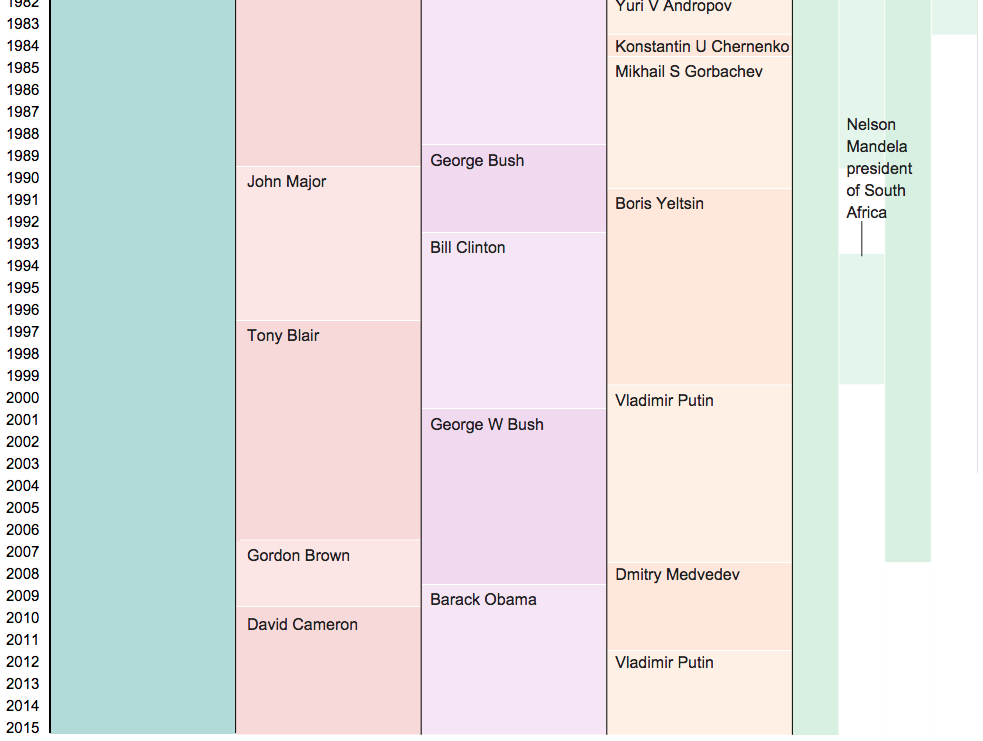
As of today, Queen Elizabeth is the longest reigning British monarch. She has surpassed the record of the famous Queen Victoria, Elizabeth’s great-great-grandmother at 63 years and seven months. Obviously a lot of things have changed over those 63 years, and in this article the BBC uses a graphic to look at how the world stage has changed.

Queen Elizabeth II's reign
Queen Elizabeth II’s reign

Credit for the piece goes to the BBC graphics department.
Living on the Grid

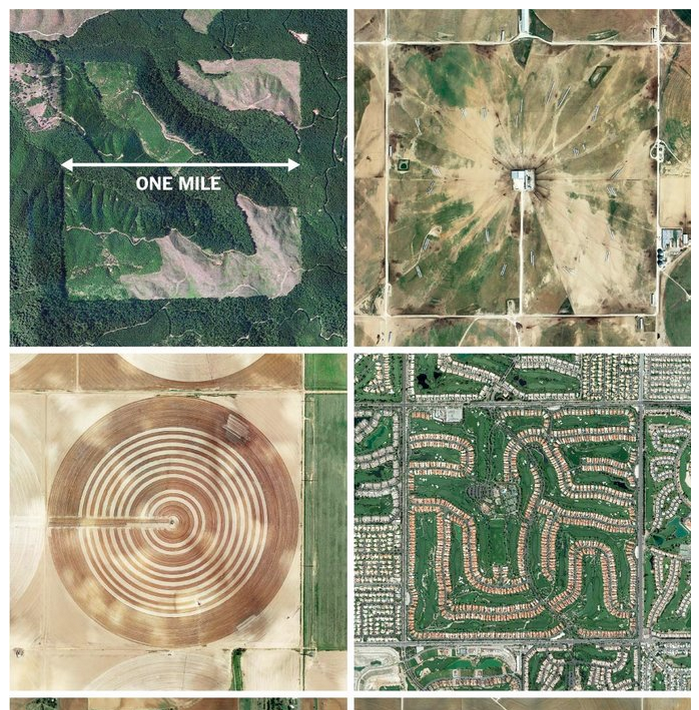
Today’s post relates very much to yesterday’s post. But this one is from the New York Times and uses aerial photography to showcase how the Jefferson grid system works in reality after it was implemented as shown yesterday.

The Jefferson grid
The Jefferson grid

Credit for the piece goes to the person behind the Instagram account @the.jefferson.grid

Organising Western Lands

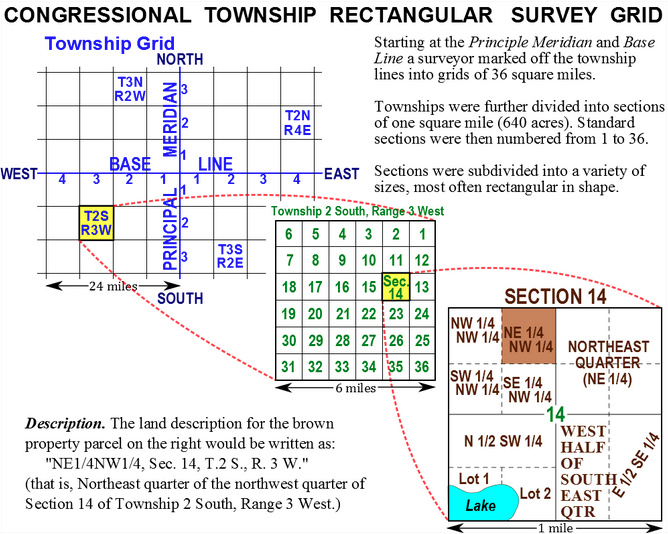
A few weeks back I looked at my ancestral family’s land grant in Wisconsin. Unlike land on the East Coast that was surveyed and organised by pioneers in different colonies using different sets of rules, after the formation of the United States, surveyed land was organised into townships that had subdivisions. In this blog post I found about the subject, there are several diagrams and maps that explain just how this system worked.

How western lands were organised

If you’re curious about how western land was organised, its worth a quick read.

Credit for the piece goes to Living History Farms.

16th Century Maps

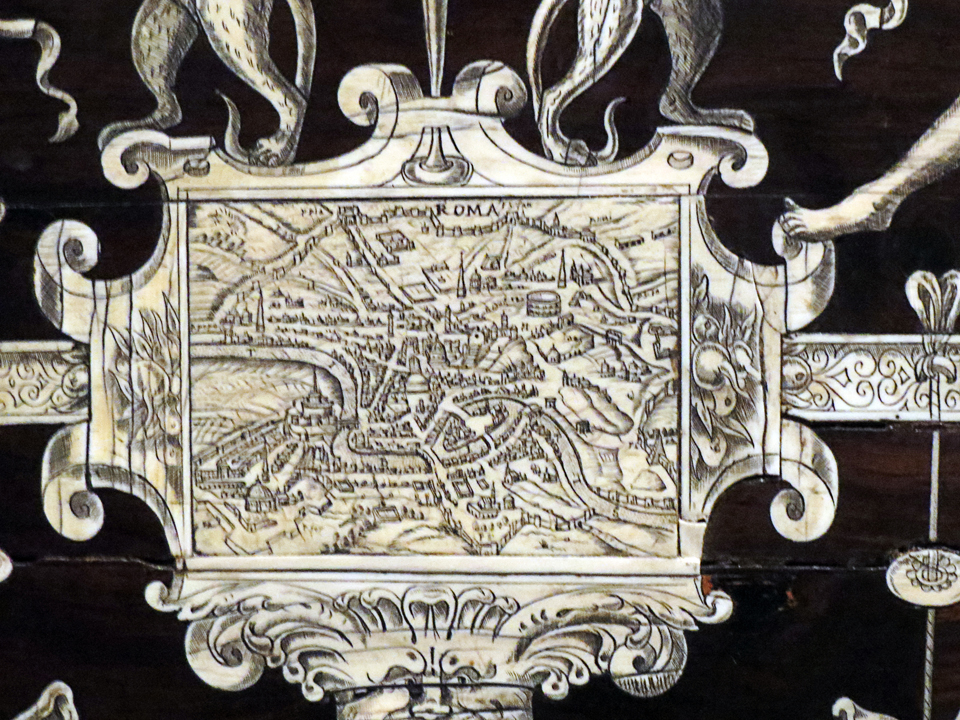
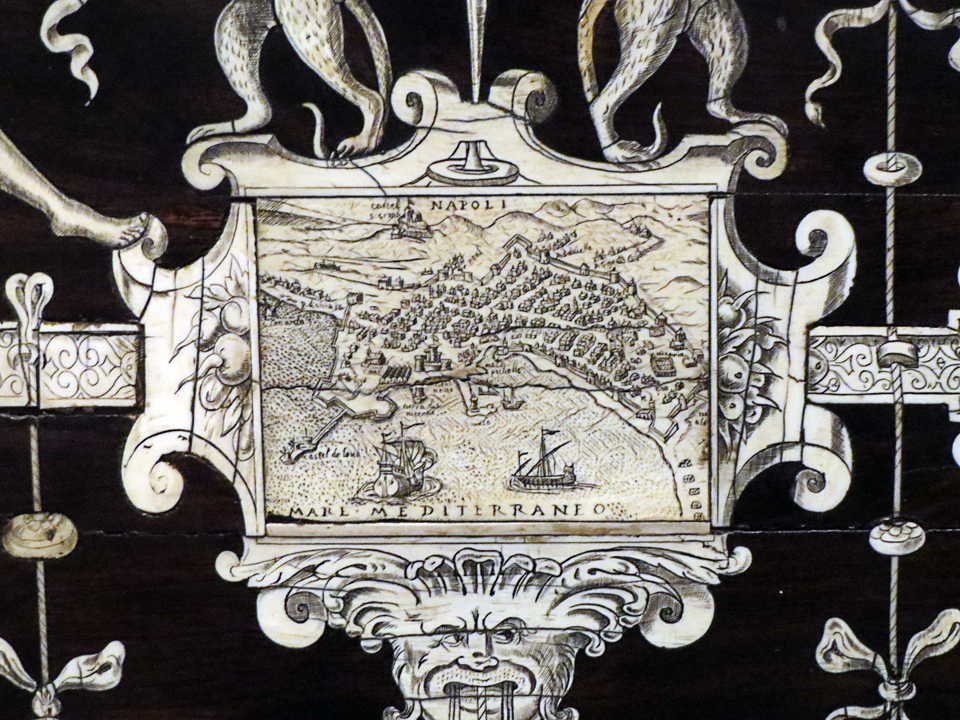
While in Philadelphia last weekend, I managed to make it to the Philadelphia Museum of Art for a little bit. And today’s piece is a nice map—ivory on ebony—from a 16th century Italian writing cabinet.

The overall chest
The overall chest
The detail for Rome
The detail for Rome
The centre map
The centre map
The detail for Naples

Credit for the piece goes to the workshop of Iacobus Fiamengo.

The Spellecy’s Wisconsin Land Grant

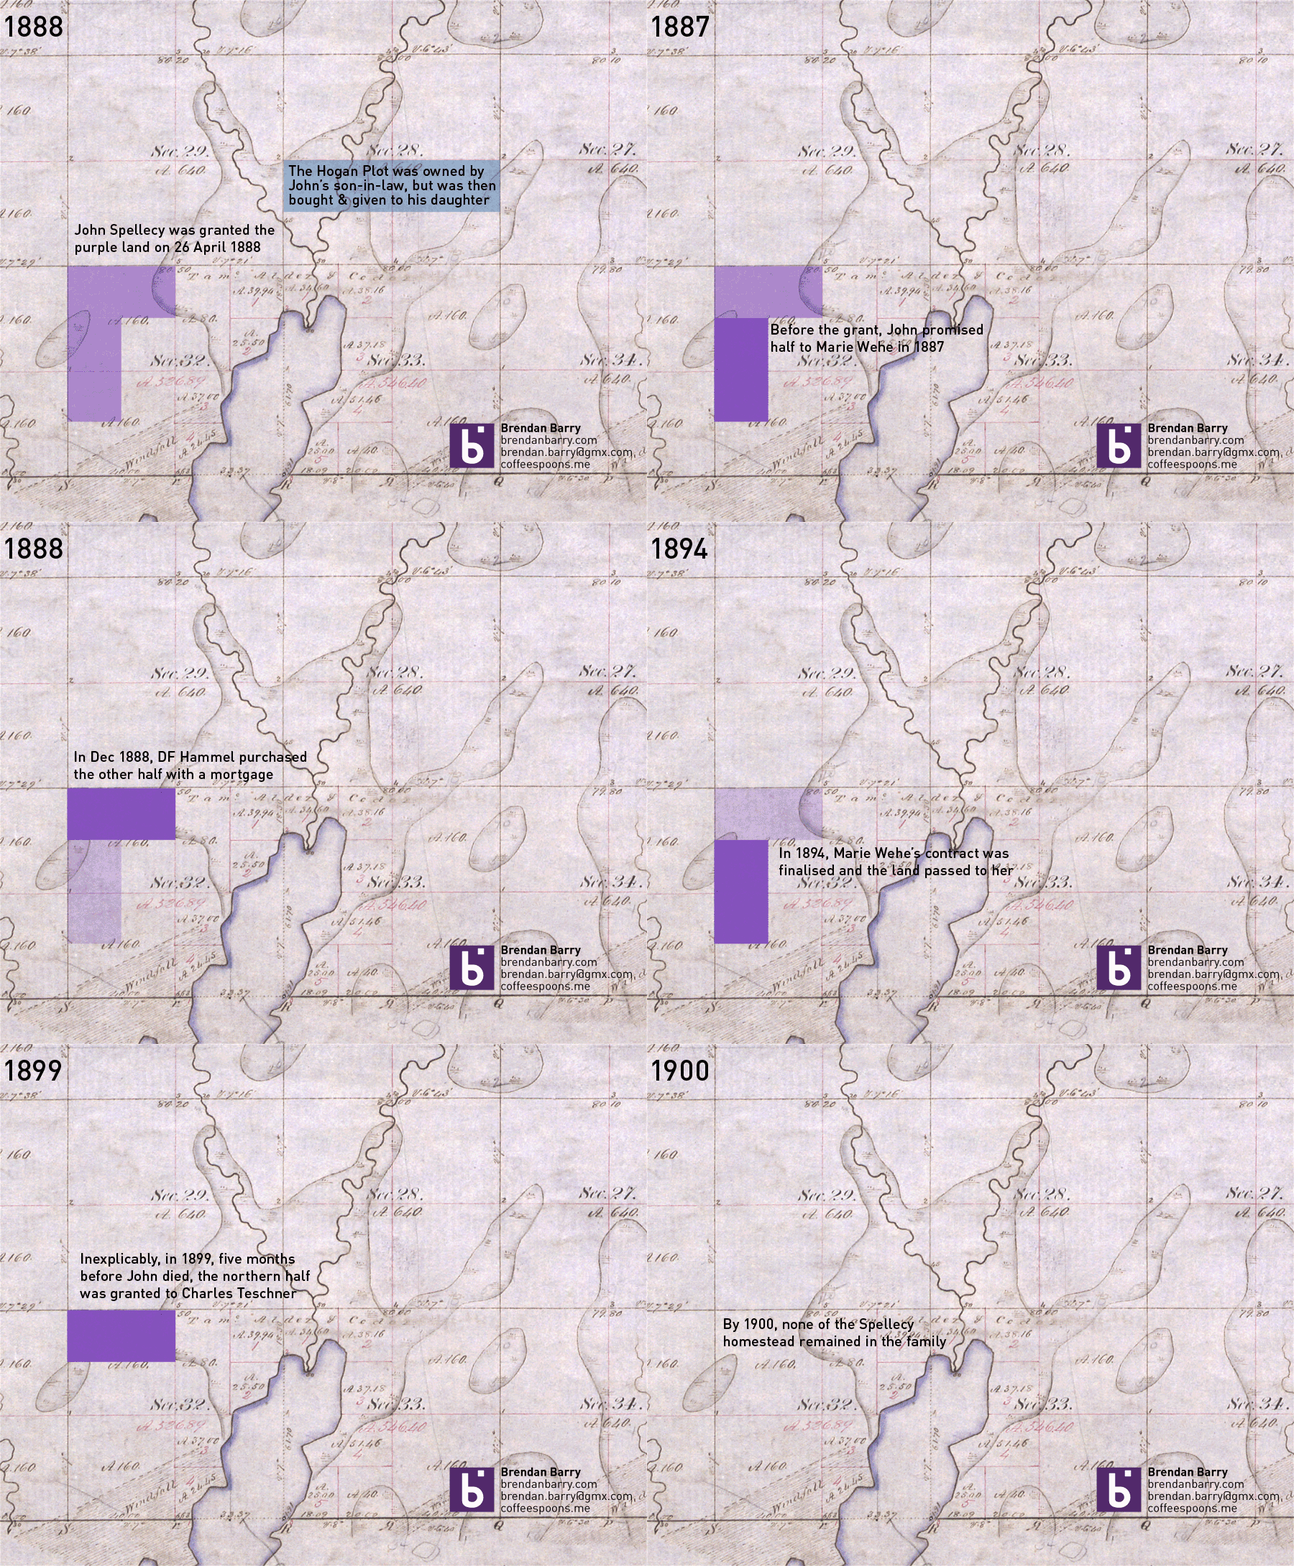
I have returned from my trip up north to Minnesota and Wisconsin. Unfortunately, from the research side it was not the most successful of trips. I did find some records, but none that answered any of the big questions I had. If anything, I now have far more questions. Most of the information I learned deals with the homesteaded land that John Spellecy received in 1888, at the young age of 70. It turns out by the time he was given the land by the US government, he had already made one contract to sell a portion of it. And so to make some semblance of it, I made this animation to show how the land grant disappeared over only a 12 year period.

How the Spellecy plot disappeared

For the curious, the background image is a digitisation of the US government’s original land survey. The A.160 denotes 160 acres, the maximum allowed by a homestead claim.

America’s Long History with Flip-flopping

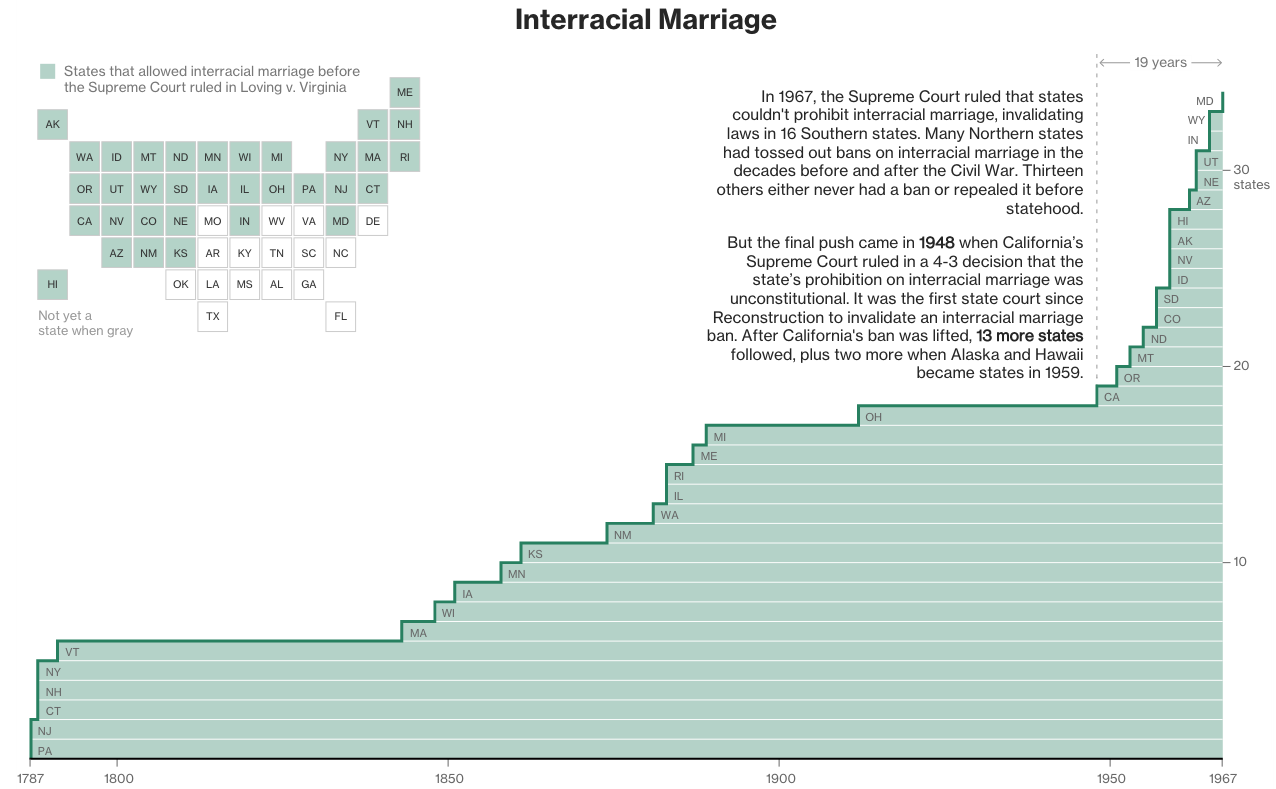
Today the Supreme Court takes up gay marriage. Again. This is, you know, after they decided two years ago that the federal government has to recognise gay marriages when performed in states where it is legal. Anyway, last week, Bloomberg Business looked at the United States preference for changing its mind through a nice series of charts.

How interracial marriage changed in the US

They took six key issues, including interracial marriage shown above, and looked at how the position shifted over time. They identified the basic trend as being early adopter states followed by rapid acceptance to a critical mass, at which time the federal government stepped in, e.g. via the Supreme Court.

Credit for the piece goes to Alex Tribou and Keith Collins.

British Parliament Timeline

For those of you who don’t know, the British Parliament was dissolved today ahead of the 7 May elections. In other words, it is now election time. Last week the Economist published a small interactive piece that allows you to look at the composition of the British Parliament from 1870 through today.

Parliament over the years

While many (some?) of us would remember times from recent history, e.g. the 1997 electoral victory of Tony Blair, the memory might be a bit foggier one hundred years in the past. But to help you, if you click on a particular year, the view changes from an overview to a focus on Parliament in that particular year.

Parliament in 1915
Parliament in 1915

Credit for the piece goes to the Economist’s Data Team.

Lee Kuan Yew Built Modern Singapore

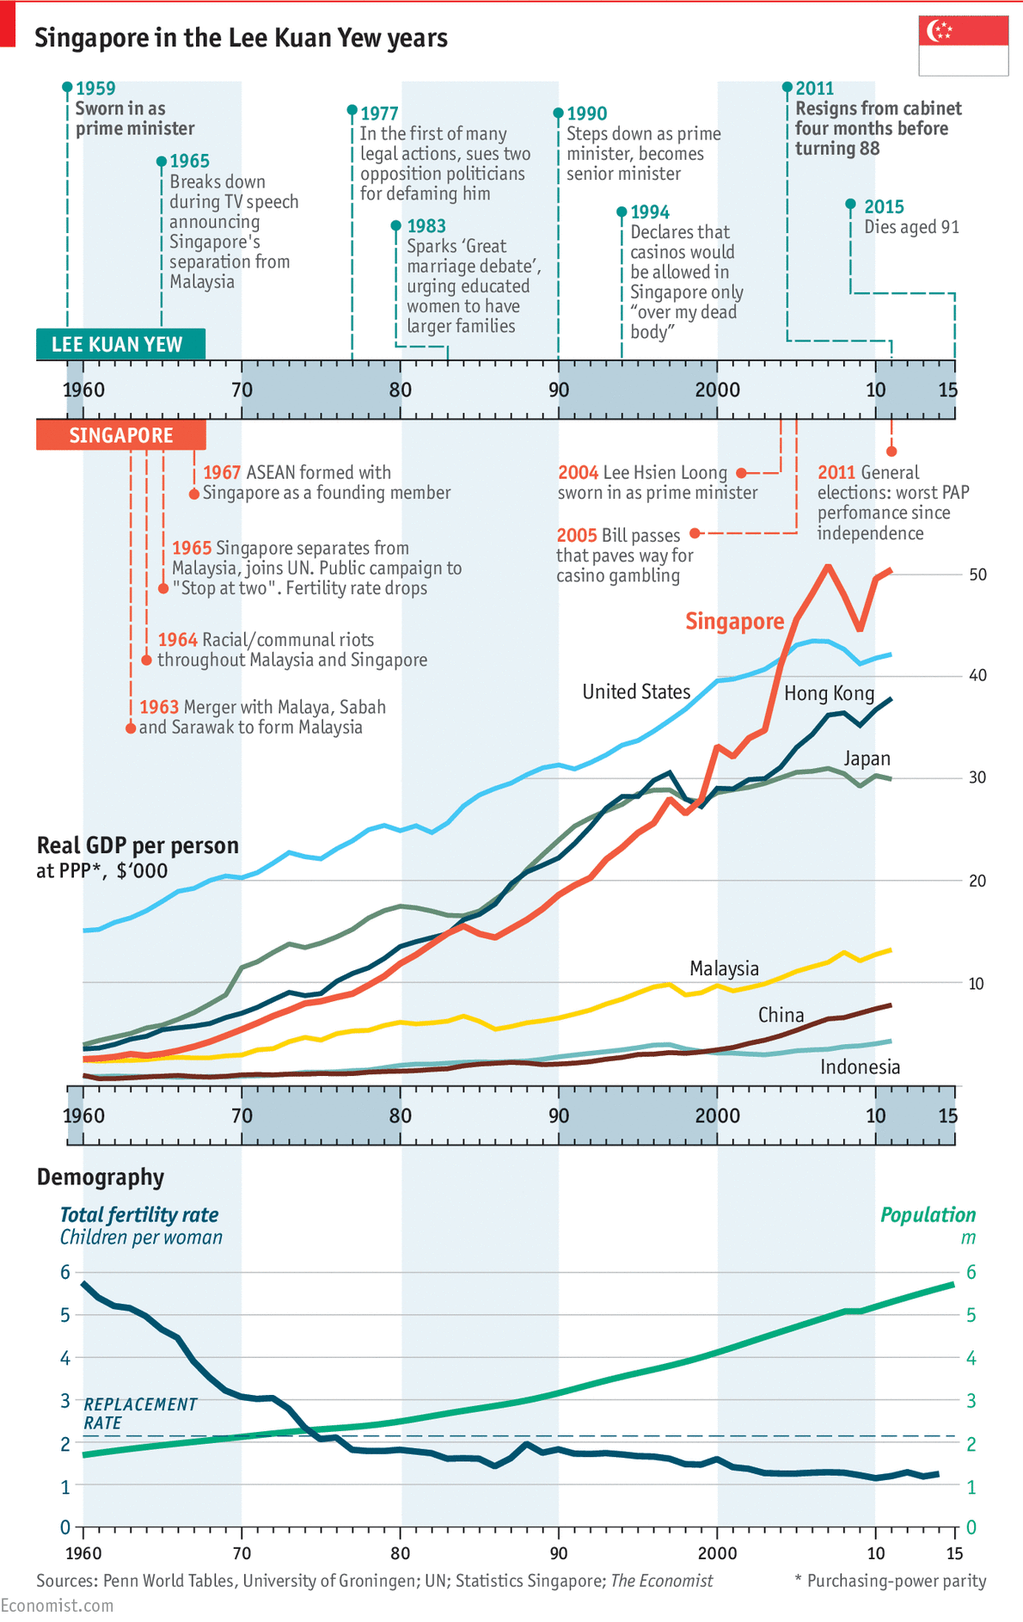
Lee Kuan Yew died this weekend. He is lately responsible for designing and implementing the policies that transformed Singapore from a poor fishing village to a commercial hub. The transformation came at a price of course. Singapore enjoys limited free speech and the country is effectively a one-party state, with the one party now controlled by Lee Kuan Yew’s son. Regardless of the faults, the transformation itself is remarkable. And the Economist put together a timeline to showcase that.

The Life of Lee Kuan Yew and Singapore's development
The Life of Lee Kuan Yew and Singapore’s development

Credit for the piece goes to the Economist’s graphics department.

The UK’s Genetic Clusters

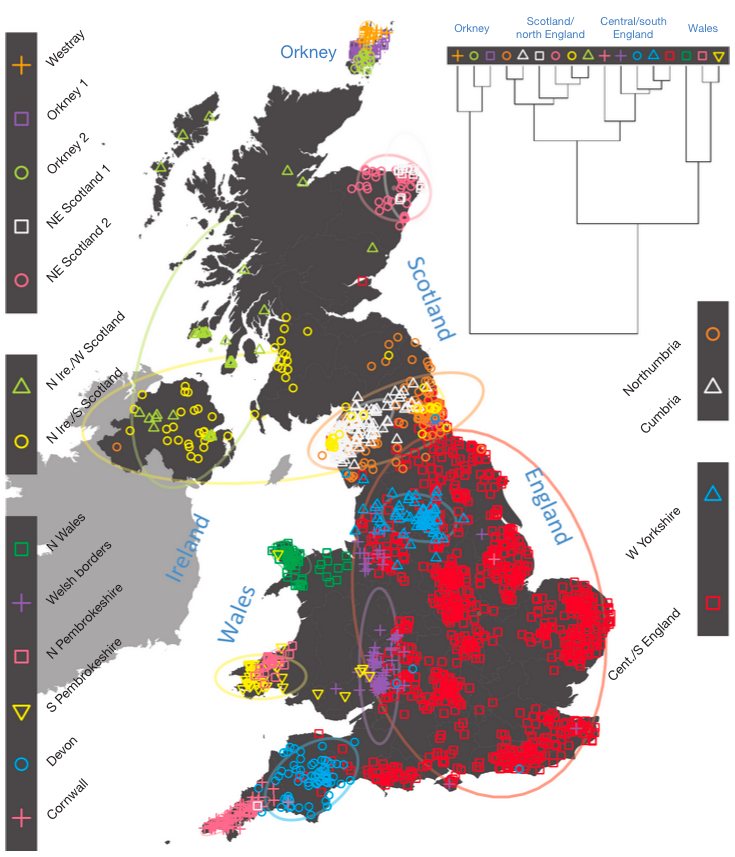
I always enjoy the combination of two of my interests: data visualisation and genealogy. So this BBC article that references a Nature article piqued my interest. It looks at the distribution of DNA across the United Kingdom and identifies different cluster areas. The most important finding is that the Celts, i.e. the people of Scotland, Northern Ireland, Wales, and Cornwall are not a single genetic group. Another finding of interest to me is that the people of Devon are distinct from both Cornwall and Dorset, Devon’s bordering regions. That interest is because my New England ancestors largely hailed from Devon and Dorset.

The colours don't imply relationships, for what it's worth
The colours don’t imply relationships, for what it’s worth

Credit for the piece goes to the Nature article authors.