A Week of Unrest Across the Middle East

Over the last week a video clip on YouTube that mocked the Muslim prophet Mohammad sparked unrest across the Muslim world, from Morocco to Bangladesh and from Turkey to Kenya. While most of the protests were peaceful, a few were not. In Libya, the US consulate in Benghazi was attacked—in circumstances still not entirely clear—and four Americans were killed, including the US ambassador, Christopher Stevens. In Khartoum, Sudan, the embassies of the US, the United Kingdom, and Germany were all attacked. While in Afghanistan, the Taliban successfully attacked the UK’s heavily fortified base of Camp Bastion, nearest to Kandahar, killing two US Marines and destroying six Harrier jets.

Combing through several news sites, including the BBC, AP, and Reuters among others, I mapped where protests occurred and sought to show how much of that country’s population identifies as Muslim. Most nations were, not surprisingly, heavily Muslim. But several countries with rather small Muslim populations such as Kenya, Sri Lanka, and India also hosted protests, some violent. Not included, because of the difficulty in changing the map, is Australia. Sydney experienced protests nearing rioting as protestors marched.

Click the map for the full-sized view.
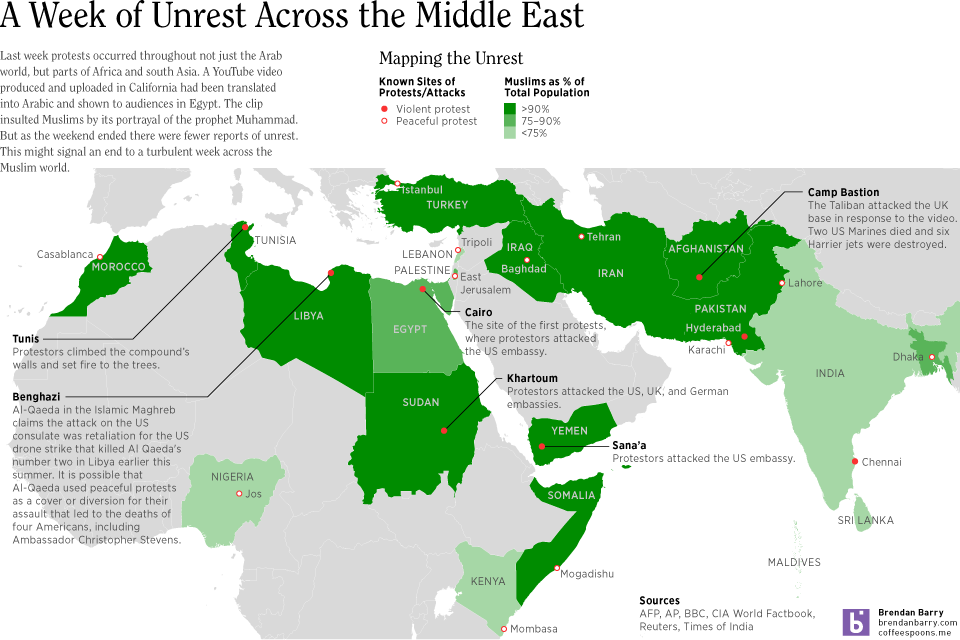
Map of Muslim Unrest; click for the full-size view

Ivory Trade

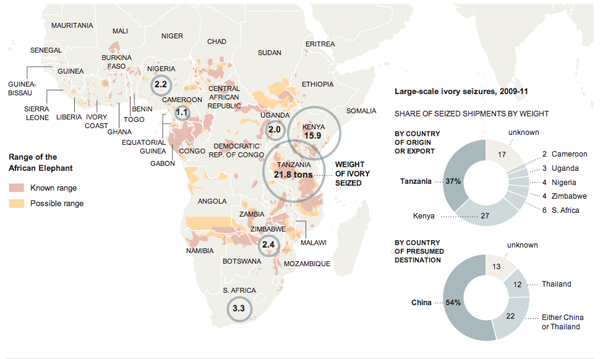
This graphic from the New York Times looks at the illegal ivory trade out of Africa and into, primarily, the markets of Asia. I think the map works fairly well in showing why certain countries are centres for the illicit industry. But the two donut charts integrated into the graphic as part of the Indian Ocean are a bit weaker.

Ivory trade
Ivory trade

My main problem is that the shares are a bit difficult to distinguish as arcs, especially when looking at the export countries. But the second chart with the import markets does work a little bit better. In this case there are really only three markets: China, Thailand, and Others. But the chart contains the ambiguous China or Thailand. So in theory, that demarcation could fall anywhere between China and Thailand—a point harder made if comparing simply by bars. This means that the chart really is looking at China vs Thailand that combine to 87% vs. Others. The trick is finding the break between China and Thailand. Is this chart perfect? No, but in this case I think it an acceptable use of the donut—though I likely would have treated it a little bit differently to emphasise that point.

Made in the USA. Exported to Mexico.

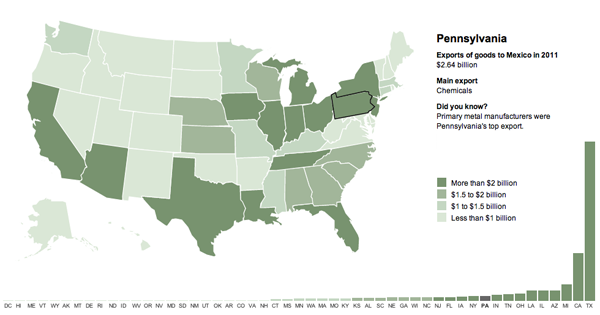
We trade a lot with China. Everyone knows that. But people might not realise that both Canada and Mexico are also among our largest trading partners. (I suppose it helps that they are both right next door.) Mexico is the second-largest importer of US goods after Canada. (China is third.) The Washington Post looked at which states are exporting the most to Mexico and what their largest exports happen to be.

Exporting to Mexico
Exporting to Mexico

Credit for the piece goes to Wilson Andrews, Emily Chow, and Bill Webster.

Climate Change

When I was younger—albeit not by much—I applied my interests in geography, history, and politics to create maps of fictional places. I used knowledge of things like the Hadley cell and the Koppen climate classification system to figure where on the maps I drew people would be able to live in temperate climates and where nobody could live because it would be an arid desert. I also read encyclopedias growing up, so go figure.

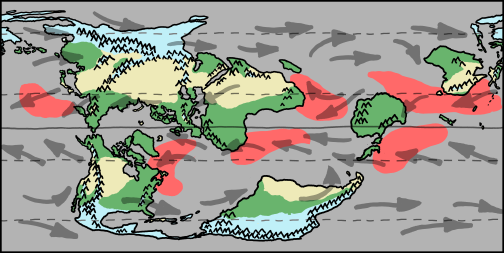
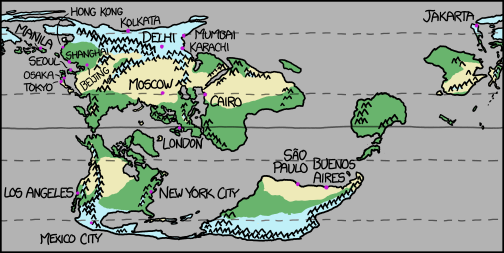
But I never bothered to apply my amateurish interest in geography and climatology to Earth. Rather, to an alternate Earth. But Randall Munroe over at xkcd did take a “what if” about a rotated Earth’s surface and investigated what would be the results. Of course he is also not an expert and even after thousands of years of living on this planet, humanity has yet to figure out all the variables that determine climates. But he gave it a shot. And he explained how it works (in theory). The result is called Cassini.

Climate of Cassini
Climate of Cassini

Blue is cold; think Siberia. Green is temperate; think rain and trees and, well, green things. Yellow is arid; think deserts. Red is hurricane zones—appropriate for summer. Think, well, hurricanes.

Cities on Cassini
Cities on Cassini

Turns out Philadelphia would still be a great place to live. Just saying.

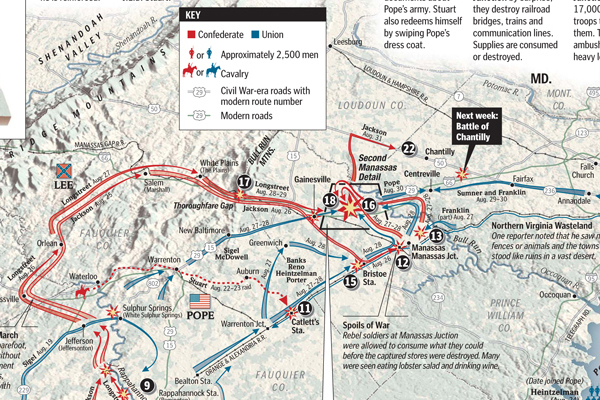
The Second Battle of Bull Run or The Second Battle of Manassas. Take Your Pick.

So the battle has two different names, but it was undoubtedly bloody. The Washington Post created an infographic exploring this important battle of the Civil War that led to a bloody Union defeat.

Second Bull Run
Second Bull Run

Credit for the piece goes to Gene Thorp, Brenna Maloney, Laura Stanton, and Don Troiani.

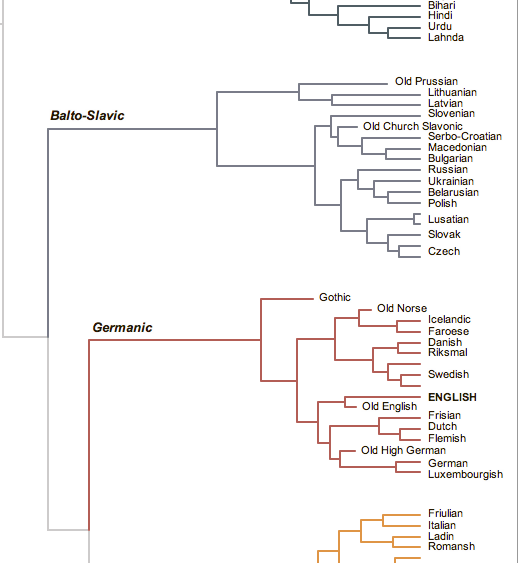
Indo-European Language Origin

Polonius once asked Hamlet what he was reading. Hamlet replied “Words.”

I still love that scene. But, it turns out that we now have an even better idea of where our words came from. It turns out that it is more likely that our shared Indo-European languages originated not in the steppes of Russia but rather Anatolia in Turkey. The New York Times created a graphic that looked at just how the Indo-European family of languages can be broken out.

Branches of our family tree


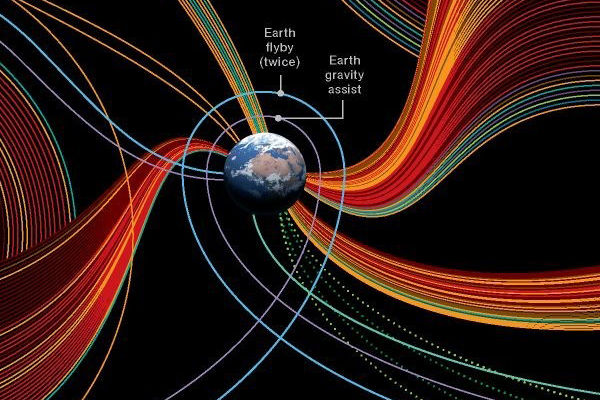
Space. Something About a Frontier?

Today’s post comes via one of my co-workers. I don’t have any information on it other than it being an infographic looking at our exploration of the solar system (and in the near future beyond, thanks Voyager). My guess is that it isn’t particularly new, as I would imagine that the designer would have liked to have called out the Curiosity mission that just landed on Mars. But so far as I can tell, that mission is absent from the infographic.

We Start at Earth
We Start at Earth

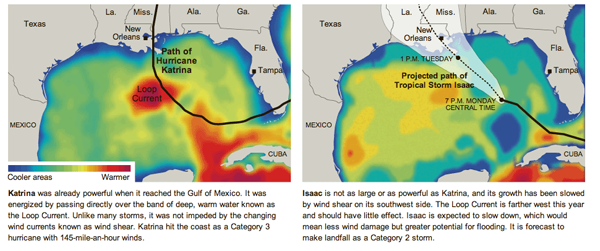
Hurricane Isaac vs Hurricane Katrina

I live in the Midwest but I grew up on the East Coast. I spent my summers at the Jersey shore. (No, not that one.) I know a thing or two about hurricanes. Isaac is expected to make landfall later today in the New Orleans area almost seven years to the day when Katrina made landfall. There are some notable differences between the two storm systems and the New York Times has attempted to elucidate those important distinctions in this graphic.

Differences
Differences

Opportunity

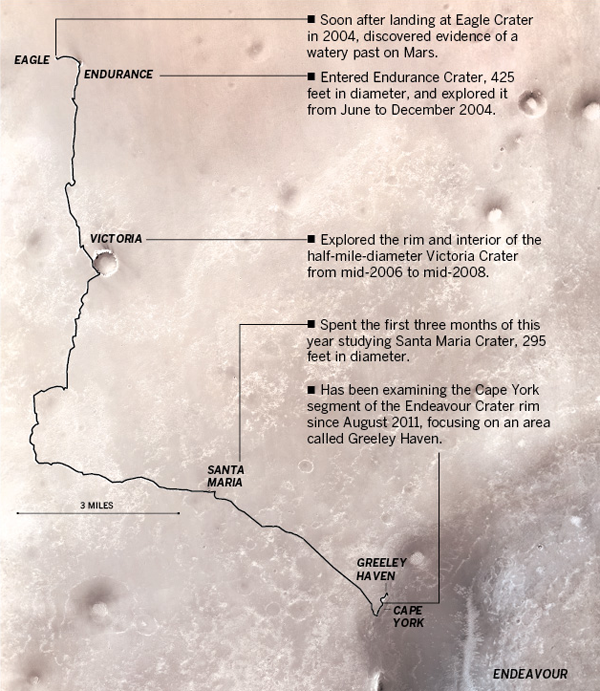
Curiosity is not the only rover on Mars, eight years after a 90-day mission, we still have Opportunity rolling around. The Los Angeles Times published this graphic detailing the exploration conducted by Opportunity. This is a map of Opportunity’s section of Mars.

Path of Opportunity
Path of Opportunity

Credit for the piece goes to Julie Sheer, Lorena Iñiguez, Raoul Rañoa, and Anthony Pesce.

Patrolling the US–Mexican Border

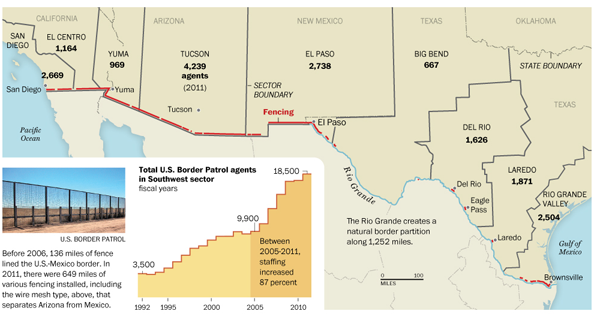
If you haven’t heard, we share a border with Mexico. And we patrol it. And the Washington Post published a graphic looking at the patrolling of the US–Mexican border.

Border patrol staffing

Credit for the piece goes to Anup Kaphle and Bill Webster.