(Lack of) Support for Cassidy-Graham Obamacare Repeal

A wee bit of housekeeping here at the top. Your author will be away for work and then enjoying a well-earned, but all-too-brief holiday over the next week.

At the end of the week, the Senate’s window to pass a budget reconciliation measure, i.e. what they need to do to repeal Obamacare with only 51 votes, will close for a year. As of my writing on Monday evening, Susan Collins has just become the third Republican no vote, effectively dooming the bill should it come to the floor for the vote.

But as the week progresses, I fully expect the bill’s authors to add some bells and whistles to try and sweeten the deal. But the problem has always been, the bells for the hardline conservatives push moderates away and the whistles for those same moderates drive away the same hardline conservatives. For the next year and a half or so, the best bet to pass a fix to healthcare is a bipartisan “repair Obamacare” instead of “repeal Obamacare”. Whether or not the Senate will have the stomach for such a compromise is yet to be seen.

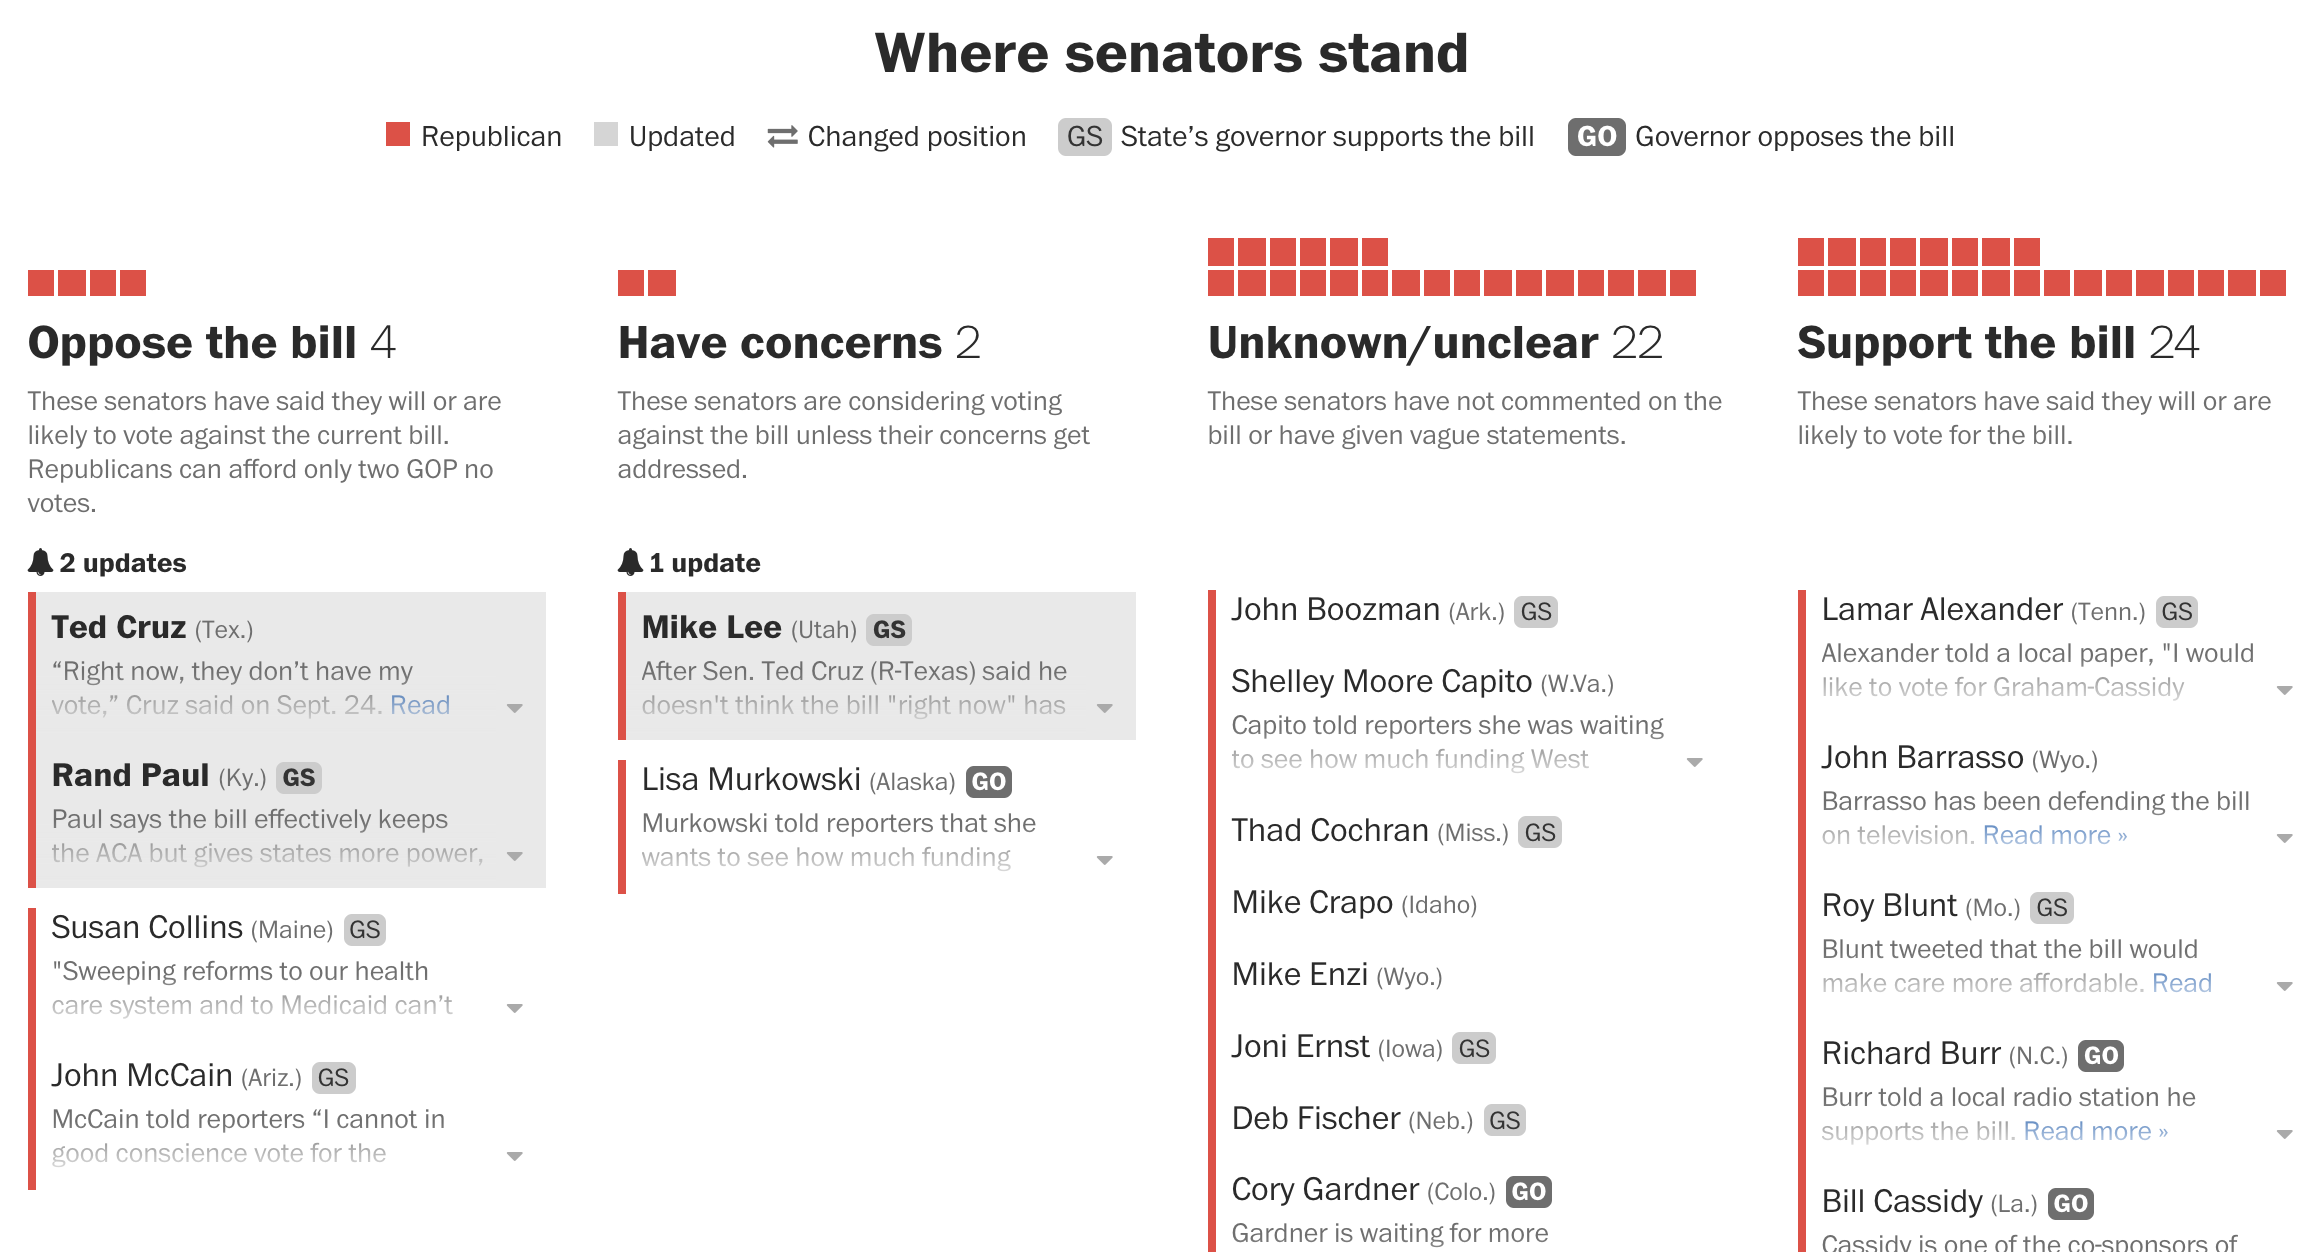
In the meantime, this week we have a tracker from the Washington Post examining the latest positions of senators on the Cassidy-Graham bill.

It does a nice job of breaking up the Republican conference not just along the ideological spectrum, but also on the winners and losers spectrum. After all, the bill as written will transfer large sums of aid from states that accepted the expansion of Medicare to those states that rejected expansion.
Who's saying yes and who's saying no
Who’s saying yes and who’s saying no

Credit for the piece goes to Kim Soffen, Amber Phillips, and Kevin Schaul.

German Election Results

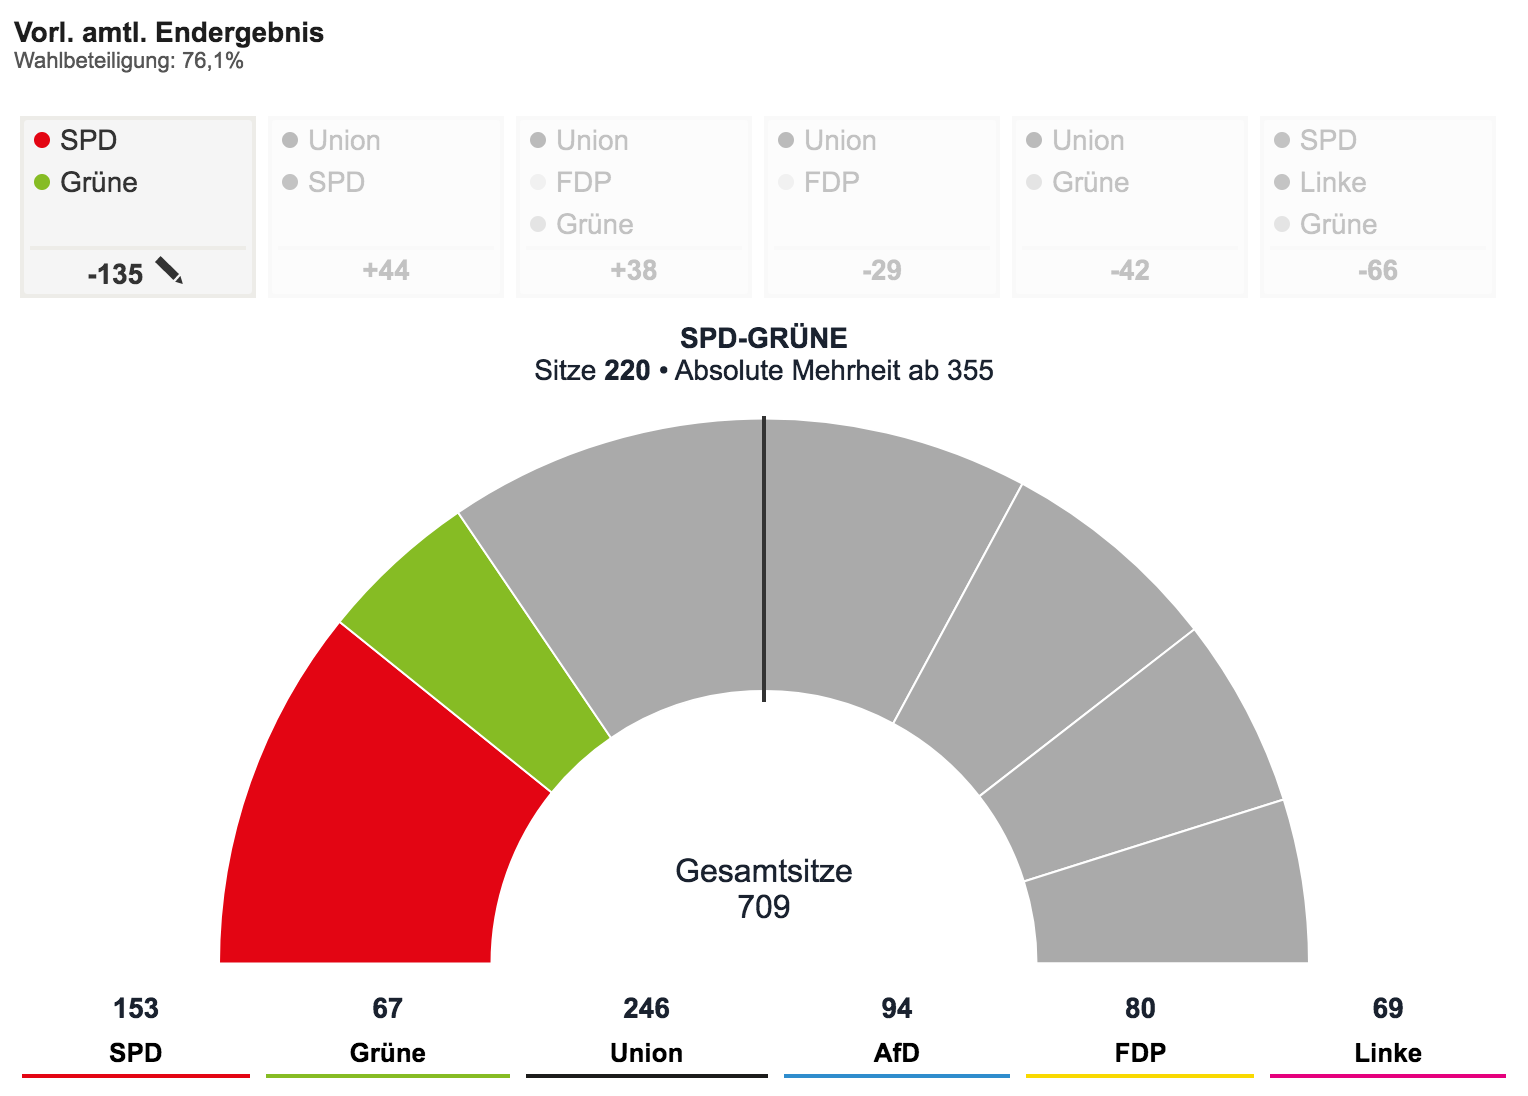
On Sunday Germany went to the polls. Angela Merkel won a fourth term, but the anti-immigrant nationalist party, Alternative for Germany (AfD), won nearly 13% of the vote. That places a nationalist party in the German parliament for the first time since World War II.

A lot of the graphics I saw were straight-up bar charts of the final vote share. But Die Welt, a German paper, did have this piece with an interactive choropleth. There is nothing revolutionary in the map itself. But it does show how support for the AfD exhibits clear geographic patterns, namely large support in what was East Germany.

AfD support was strongest in the former East Germany

But the really nice part about the Die Welt piece is the interactive coalition builder at the end. They present several different possibilities. Unfortunately, I cannot read German, so the narrative on the page eludes me. But it was fun to explore the potentials. But with the SPD announcing it would go into opposition, we are not likely to see a grand coalition.

Which combination will prevail?

Credit for the piece goes to the Die Welt graphics department.

Nambia

C’mon. You knew I was not going to let that one slip by.

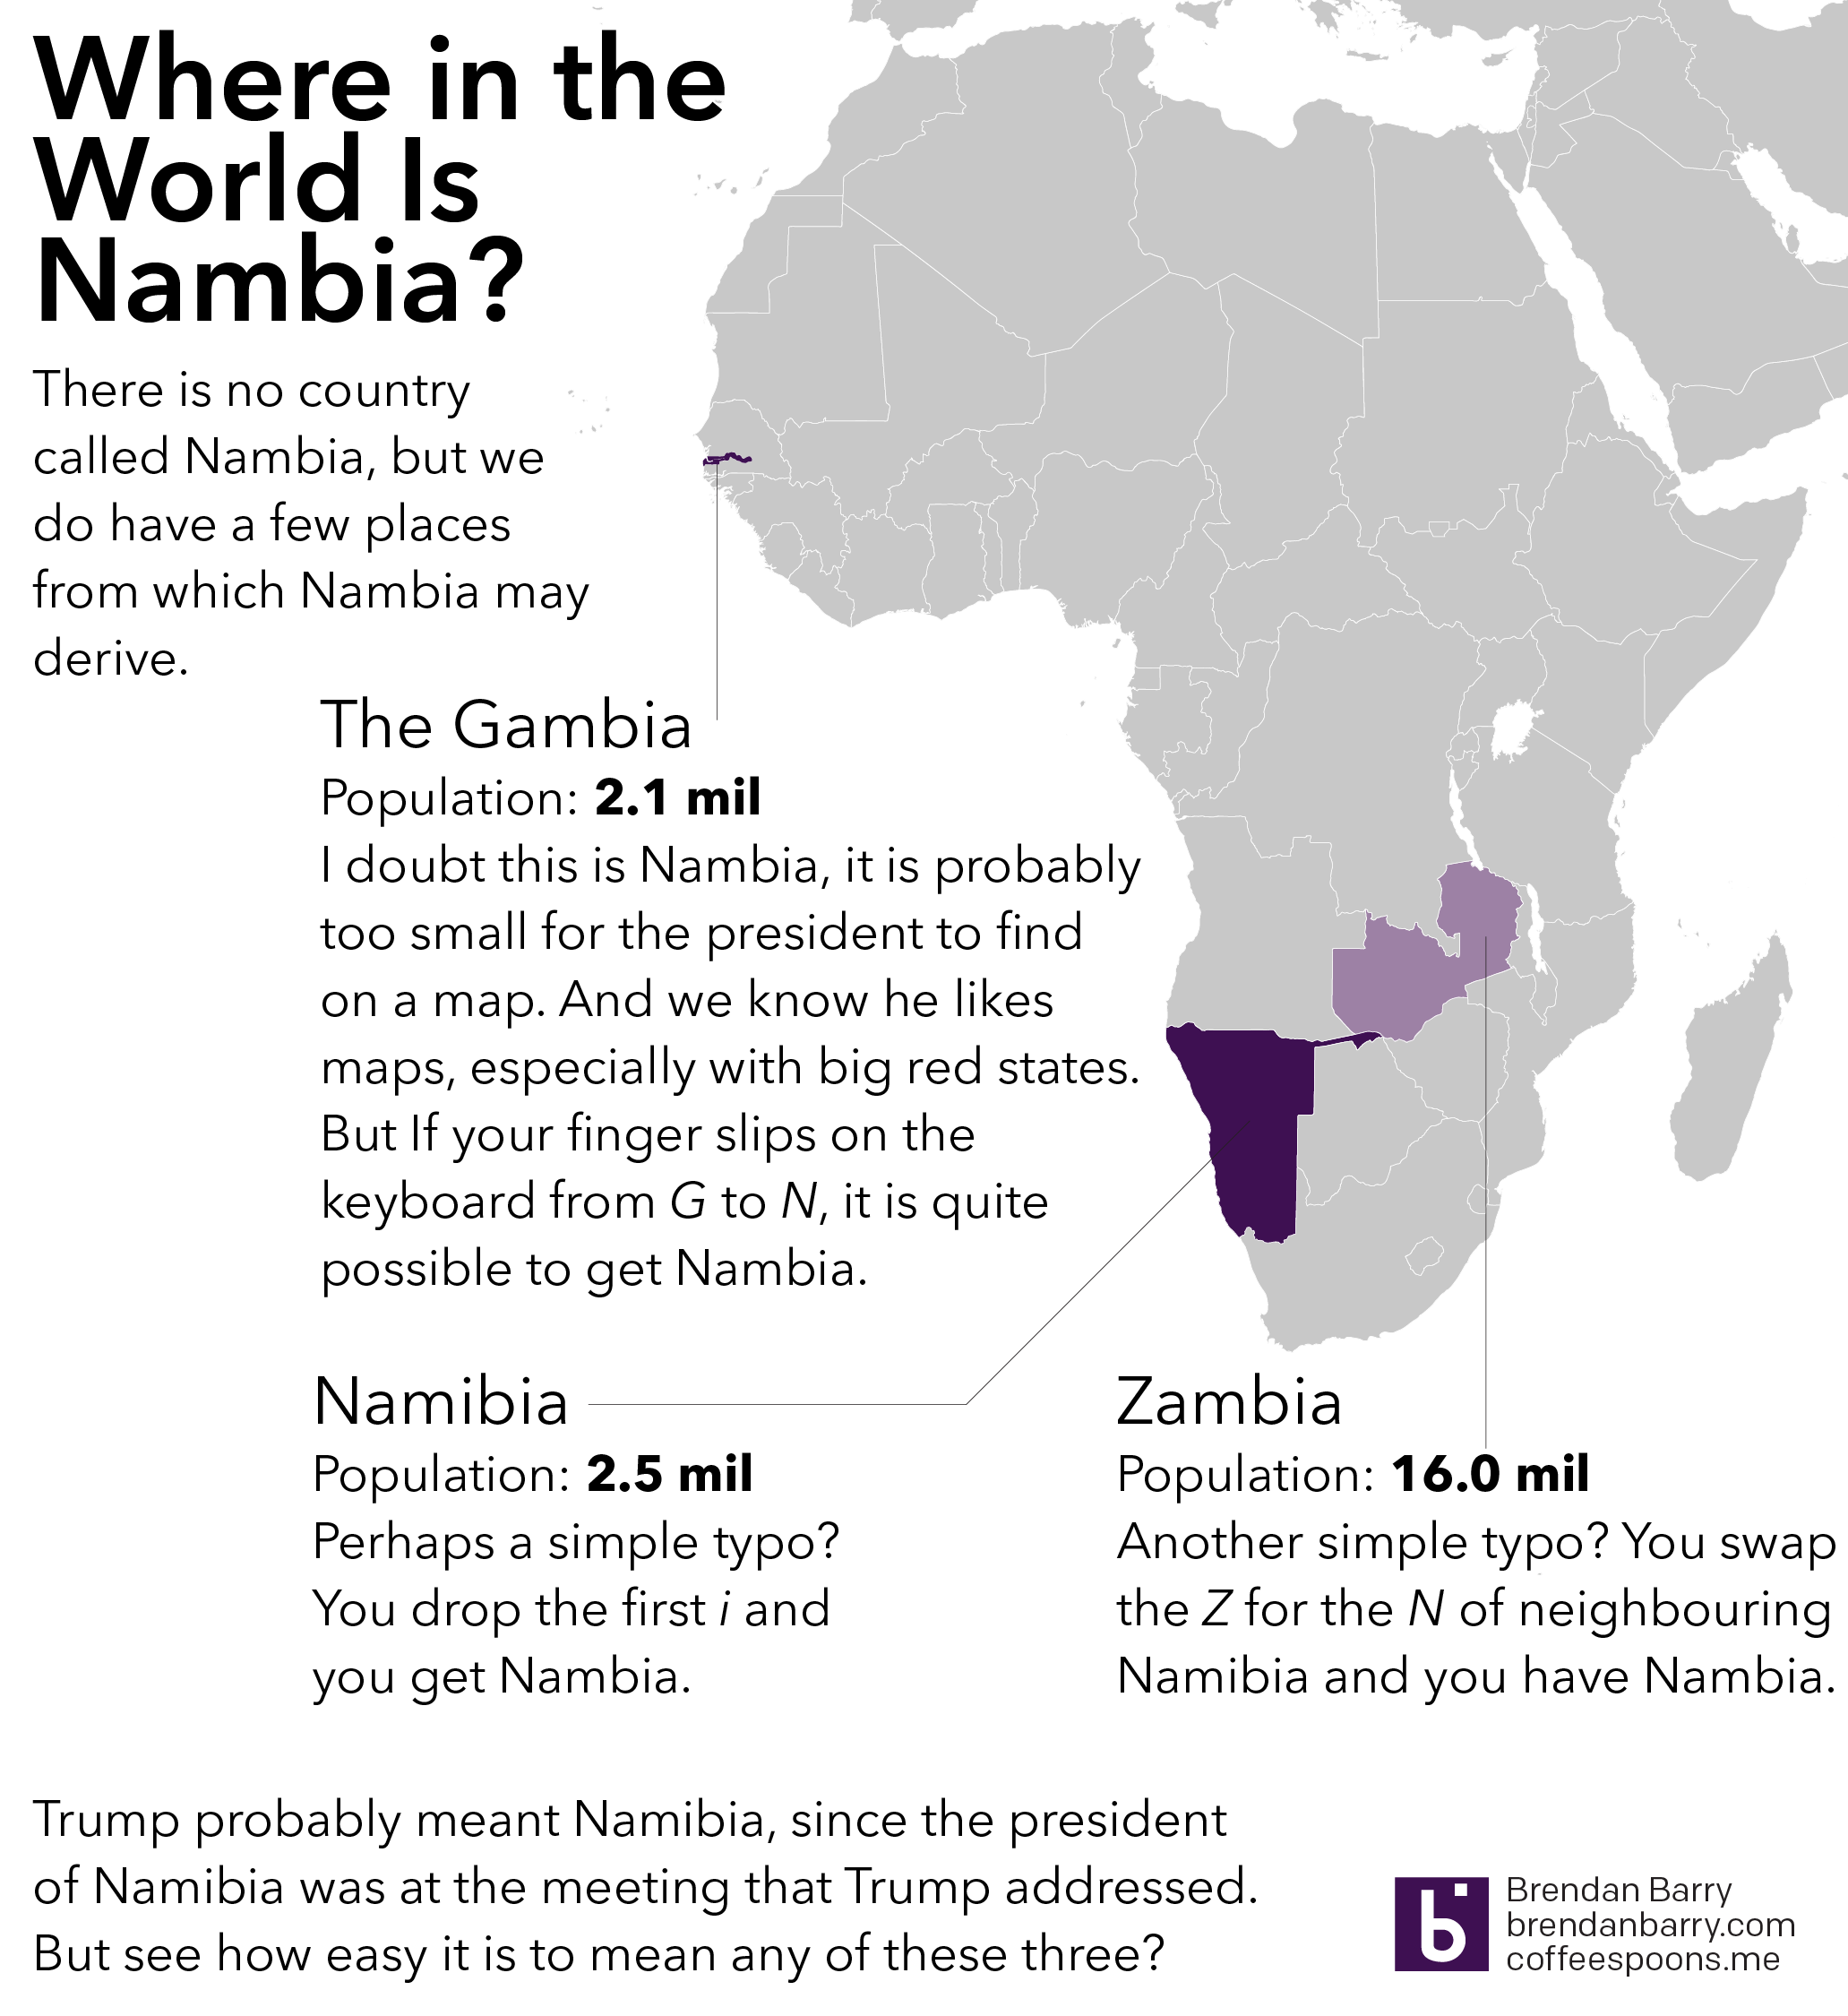
President Trump, in a meeting with African leaders, twice name-dropped Nambia and in one mention held it up as having a nearly self-sufficient healthcare system. Funny thing to mention as the US is on the brink of eviscerating its healthcare system. But I digress. The point is that when you are speaking to the president of a country, you take a minute to learn how to pronounce the country’s name correctly. Even write it phonetically in the text if you have to. (I’ve done that.) So where is Nambia?

This was just too too good to pass up…

The Cassidy-Graham Healthcare Bill

I meant to post this yesterday, but accidentally saved it as a draft. So let’s try this again.

Yesterday the New York Times published a print piece that explored how the Cassidy-Graham bill would change the healthcare system. This would, of course, be another attempt to repeal and replace Obamacare. And like previous efforts, this bill would do real damage to the aim of covering individuals. We know the dollar amounts in terms of changes to aid given to states, but in terms of the numbers of people likely to lose their coverage, that would have to wait for a CBO score.

Hyperlinked to the online version of the article

The graphic makes really nice use of the tall vertical space afforded by two columns. (You can kind of see this too in the online version of the article.) At the beginning of the article, above the title even, are two maps that locate the states with the biggest funding gains and cuts. I wonder if the two maps could have been combined into one or if a small table, like in the online version, would have worked better. The map does not read well in the print version as the non-highlighted states are very faint.

The designer chose to repeatedly use the same chart, but highlight different states based on different conditions. This makes the small multiples that appear below the big version useful despite their small size. Any question about the particular length can be referenced in the big chart at the top.

With the exception of the maps at the top of the piece, this was a great piece that used its space on the page very well.

Credit for the piece goes to Haeyoun Park.

Burning Out the Rohingya

For years the Rohingya people, largely Muslim, in Burma (also known as Myanmar) have faced persecution from the majority Buddhist Burmese to the point that they are not considered citizens. Over the last several weeks, the Burmese government has reacted to assaults against civil authorities by armed Rohingya groups by burning villages wholesale. Burma denies it, occasionally going so far as to say that the Rohingya have in fact burned their own villages.

Sure.

The New York Times had an article on the Rohingya crisis, which if it is not already is now perilously close to being ethnic cleansing. Online, an article offered more, comparing satellite views of villages before and after their burning to the ground.

Before and after
Before and after

This week global leaders are meeting in New York at the UN General Assembly. Undoubtedly and rightly they should discuss issues like North Korea’s two programmes, one of developing nuclear weapons and the other of developing intercontinental ballistic missiles. But, hopefully they will not be silent on this issue.

Credit for the piece goes to Sergio Peçanha and Jeremy White.

Farewell, Cassini

Today’s post is a sad post, hence why I did not run with it on Friday. But on Friday, we bid adieu to the little space probe that could, Cassini. This piece is not terribly heavy on the information design, but it does include one diagram—so it counts.

The BBC put together a piece reflecting on the Cassini mission, including its little lander Huygens. If you, like your author, are interested in space-y things, this article is worth the read.

Oh the photos we've enjoyed…
Oh the photos we’ve enjoyed…

Credit for the piece goes to Sue Bridge.

All the Crazy Models

Over the last several weeks we dealt with the impact of a few hurricanes from H to K, i.e. Harvey, Irma, Jose, and Katia. Now that the Atlantic basin has quieted a wee bit, it is time we get back to the lighter side of things.

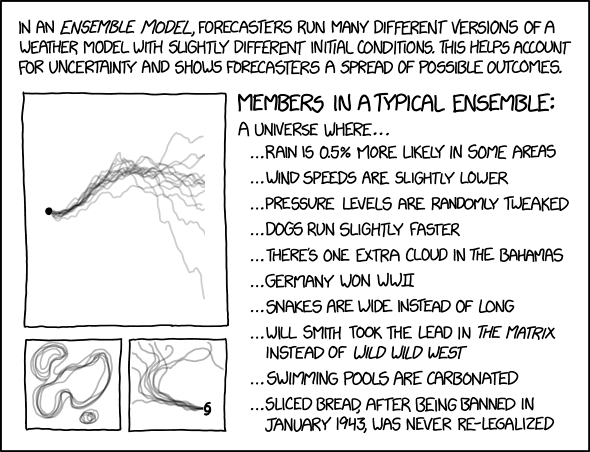
So we turn to xkcd and its look at ensemble models, often used to try and predict the paths of hurricanes.

I like to swap the victor of the colonial revolt in North America ca. 1776…

Happy Friday, everyone.

Credit for the piece goes to Randall Munroe.

The Best Rivalry Is Back

But to be honest, it never really went anywhere. As you know, your humble author visited Boston this past weekend and got to see two games of his Red Sox against Tampa Bay. Tampa, of course, is not the rivalry to which I am referring, but things were heated back in the days when Maddon managed Tampa.

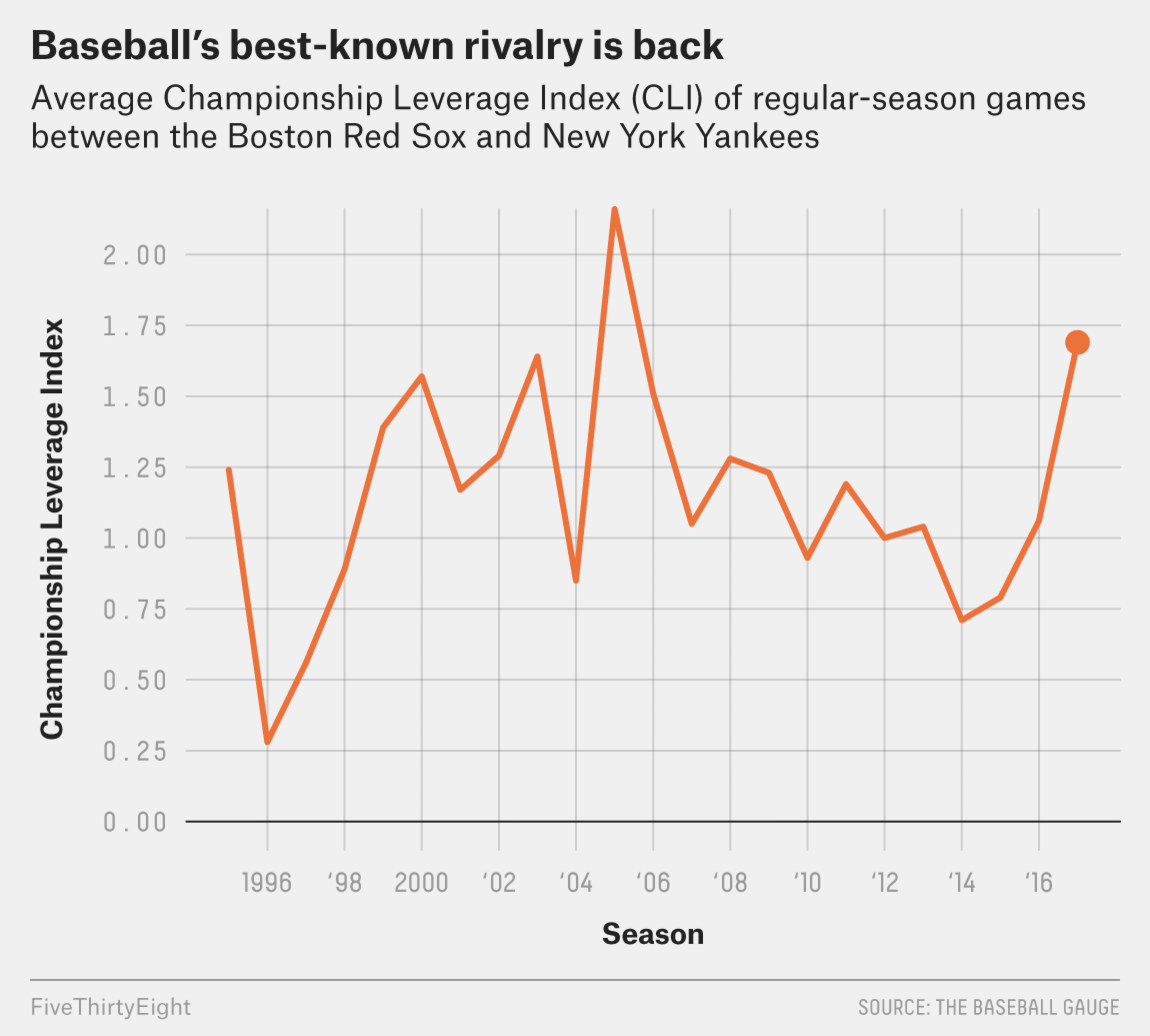
No, I am of course talking about the Red Sox–Yankees rivalry. Two weeks ago FiveThirtyEight posted an article about the rivalry and how it has returned. Admittedly, they meant not from the perspective of bitter hatred for all things Yankees, but rather that the Yankees are attempting to be good again.

This chart from the article is nothing more than a line chart. But I just wanted to point out that the rivalry lives, though in my mind it never really went away.

Down with the Empire…

Credit for the piece goes to the FiveThirtyEight graphics department.

Colin Kaepernick

Colin Kaepernick is a contentious figure in American football because of the protests he started against the US national anthem. While other protesting players remain on teams and play, Kaepernick remains unsigned despite what some say is a talent above other players. And as the American football season just began, this article from the Washington Post caught my attention.

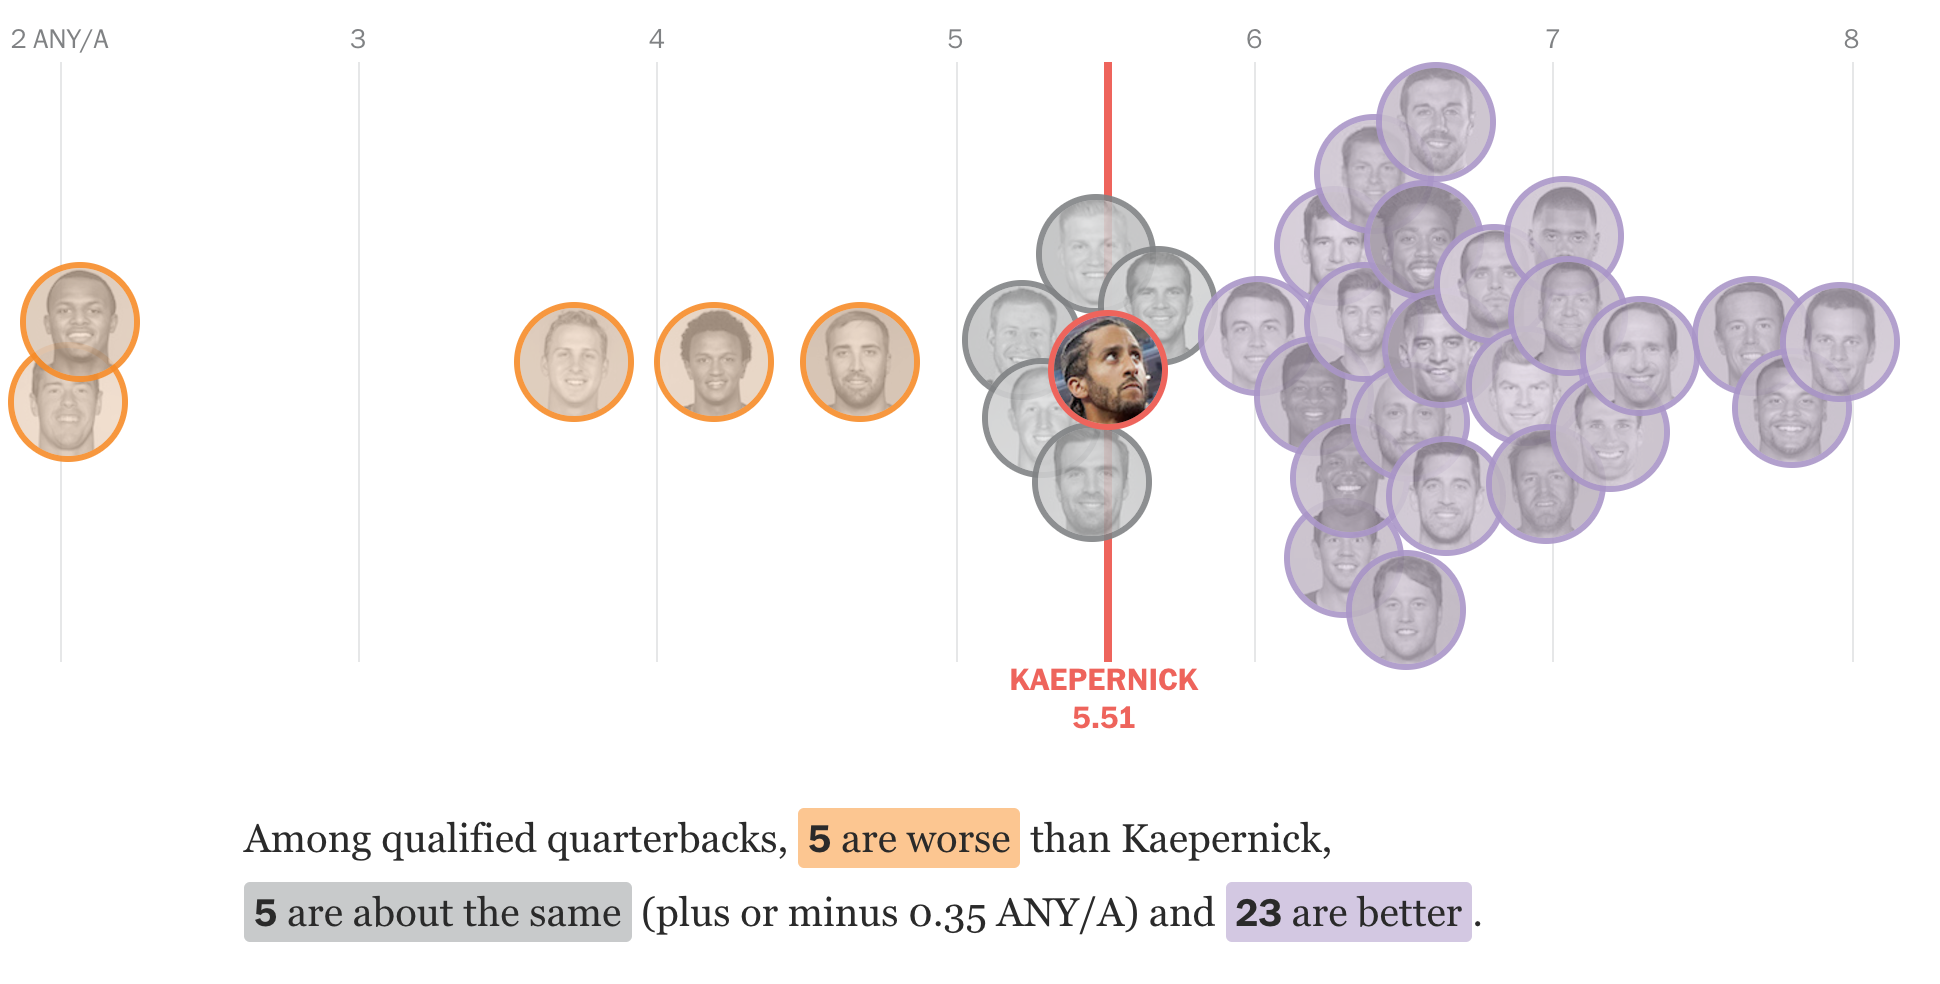
Some of the arguments I have seen for Kaepernick’s unsigned status allege he just is not very good. But is that so? What does the data show? Well thankfully the Post dived into that and is running what we can best call a Kaepernick tracker comparing him to qualified quarterbacks in the NFL.

Clearly better than a host of other quarterbacks

It turns out, he is a middle-of-the-pack quarterback, demonstrably better than half-a-dozen and sitting solidly amongst an almost third-tier or cluster of players. The data clearly shows that poor performance is not the reason for remaining unsigned, otherwise he would have replaced any number of quarterbacks. True, it could come down to his dollar cost, but most likely his remaining unsigned, compared to almost a dozen players underperforming him, is related to his protests.

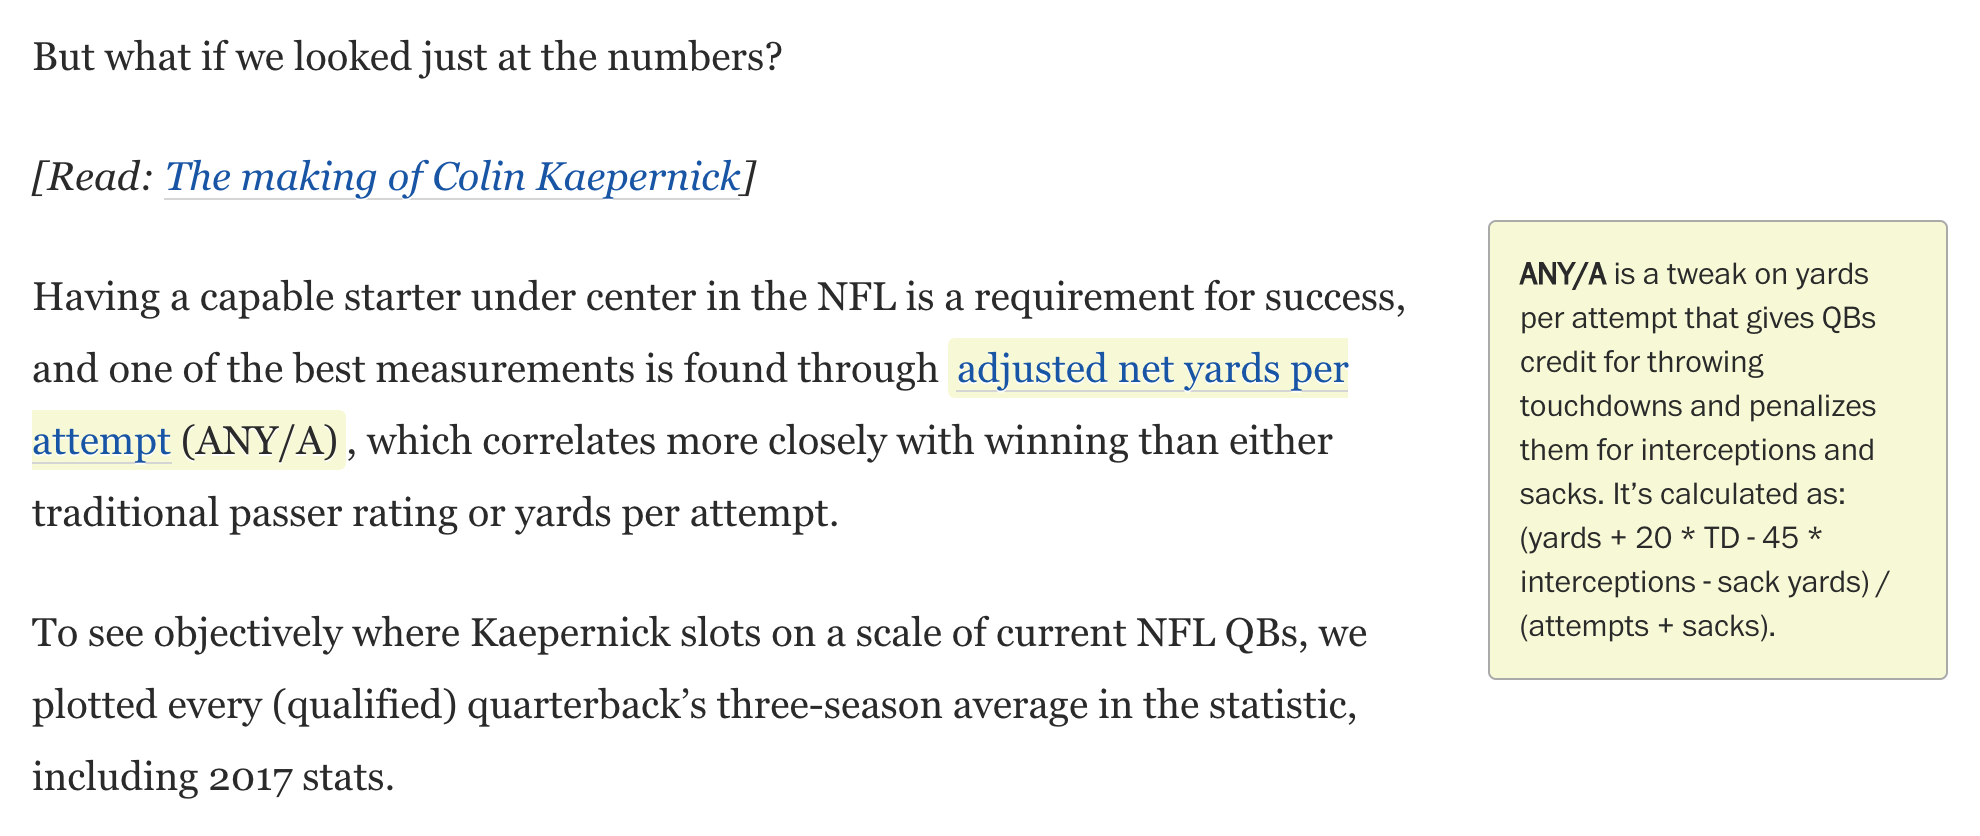
Now from the design standpoint, I also wanted to call attention to this article because of the way it handles definitions. The article uses the statistic adjusted net yards per attempt to assess performance. But what does that actually mean? Well, in the digital margins of the piece, the designers include an explanation of that statistic. I thought this was a really well-done part of the article, not interrupting the main narrative flow for a definition that a portion of the audience probably knows. But the more casual followers or people more interested in the political nature of the story would have no idea, and this does a great job of explaining it to us laymen.

What does it all mean?

Credit for the piece goes to Reuben Fischer-Baum, Neil Greenberg, and Mike Hume.

Where to Site Amazon’s HQ2

One of the stories I am interested to work on visualising in that mythical land of free time is a comparison of potential host cities for Amazon’s recently announced HQ2, a second corporate headquarters. In the meantime, I read this piece from the Times that attempted to decide for them.

Where oh where…
Where oh where…

I have some qualms with it, first that it excludes other North American cities—I would not be surprised to see Toronto win the headquarters. I have doubts that Mexico City would work, but it is possible. But my biggest problems are with the exclusionary nature of the selection. That is, within this set, cities that have x. Of the cities that have x, the cities that have y, and so on and so forth.

Personally I suspect Amazon will be looking at which cities not only fit the most requirements, but also which cities will ultimately give them the best business deal. And that I think is a very difficult to describe category.

But it is fun to try.

Credit for the piece goes to Emily Badger, Quoctrung Bui, and Claire Cain Miller.