How Trump Could Get to 270

Trump won Arizona last night. And that is a big deal, despite losing Utah. He was never expected to win Utah. And while he Arizona was expected, the magnitude of his victory there was…big. If you replicate even something close to that in a demographically similar state like California, he can rack up some big delegate numbers.

But the big story these days is the anti-Trump movement, largely centred upon either Ted Cruz or tactical, state-by-state voting to force a contested convention (which as a political nerd would be just fantastic). Chris Cillizza of the Washington Post, however, wrote an article that I largely agree with that a Trump nomination might actually give the Republicans a better shot at the White House than Ted Cruz. The whole article is worth a read.
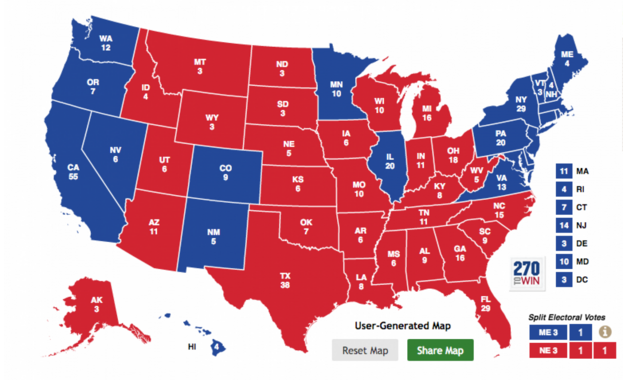
285 votes
285 votes

Credit for the piece goes to Chris Cillizza.

Watching the Iowa Caucus Results

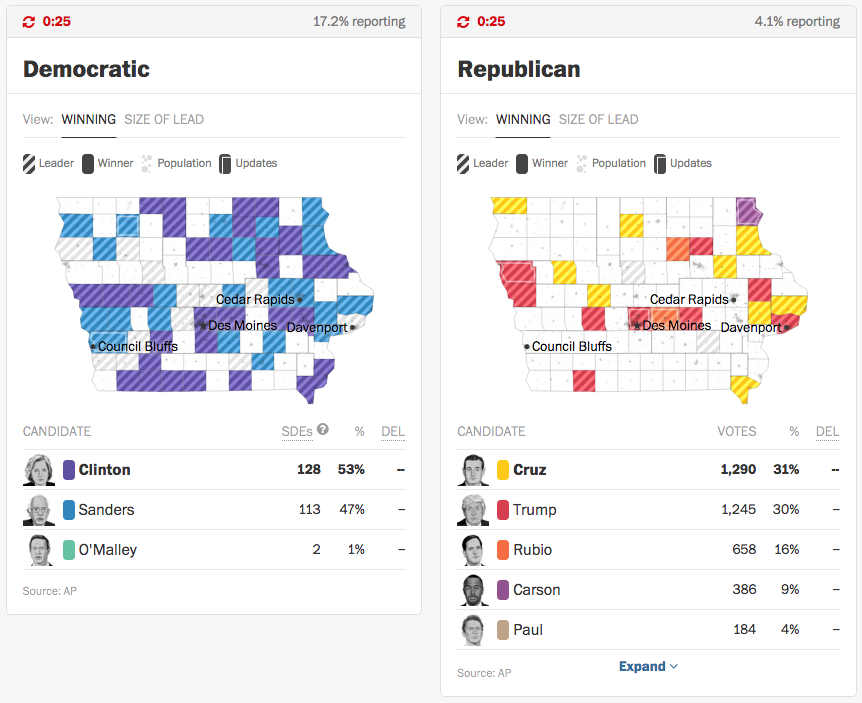
Last night I watched the caucuses from my dinner table via the internets. And I used this handy piece from the Washington Post. The screenshot is from early in the evening before most of the results had arrived.

The early results
The early results

What is really nice is that the site refreshed every thirty seconds. Sometimes nothing happens in a county. But if something did, they used a nice white line within the county borders to indicate a county within which an update had occurred.

Credit for the piece goes to the Washington Post graphics department.

A Royal Nation

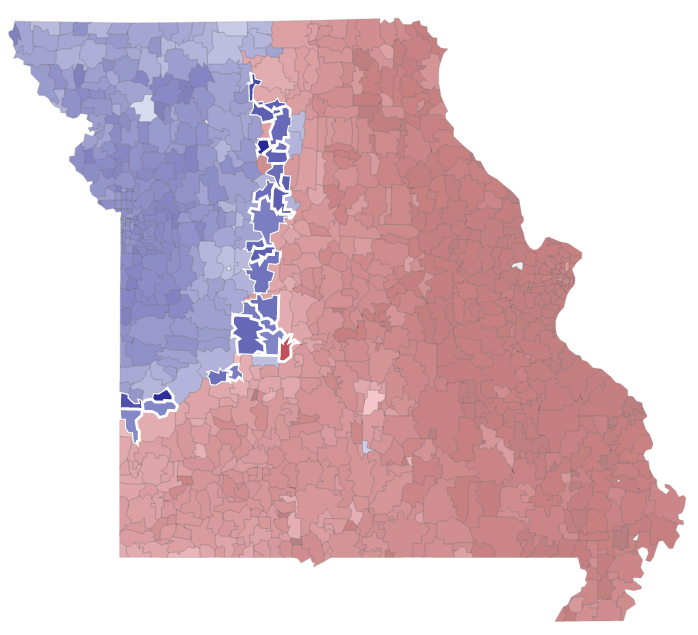
You may recall a year and a half ago a post I wrote up about a New York Times piece looking at the fandoms of baseball in the United States. Well fresh off their hometown Royals’ World Series victory, the folks at the Kansas City Star revisited the graphic—driven by Facebook likes—to see if there had been any change. Sure enough, Royals Nation—or whatever they call it—has made inroads into what was before St. Louis Cardinals territory.

Missouri is a little more blue these days

The only sad part about the article is that they talk of changes in adjacent states, e.g. Kansas, but have no maps for those.

Credit for the piece goes to Jay Pilgreen.

The Canadian Elections

Canada held an election yesterday. For your briefing on it, John Oliver did a great job on Last Week Tonight. But for the serious coverage, we have results.

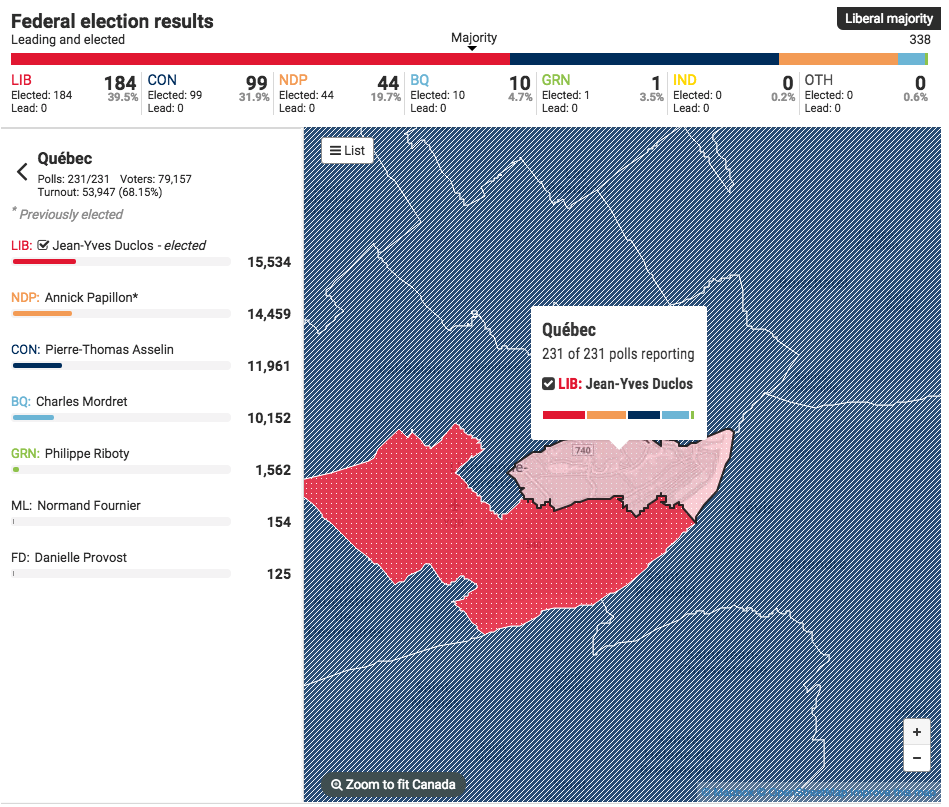
Here we have the results coverage by the National Post. It’s your standard choropleth coloured by the victor in each riding, or constituency. From a design side, I find the pattern fill interesting and not something I have seen done before for a political map.

I just chose a place I had visited in Canada

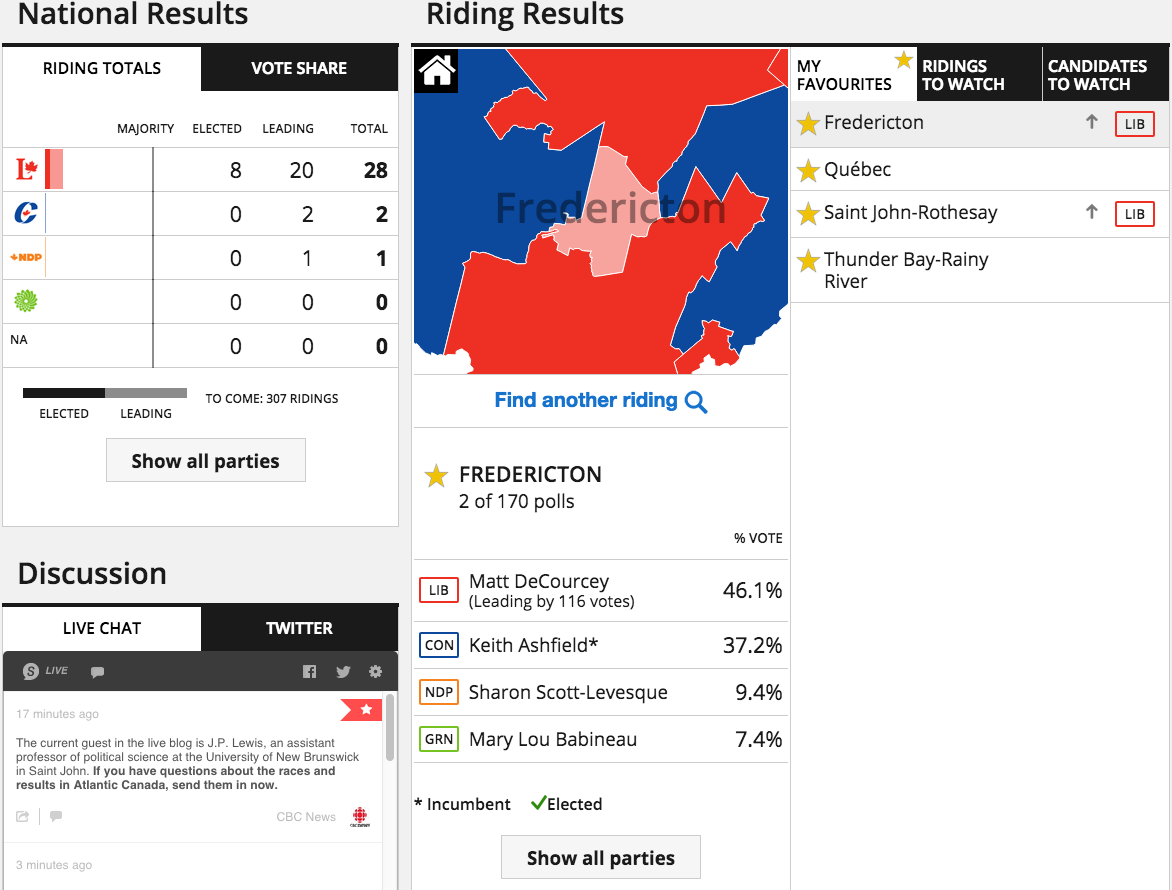
But I really like what the CBC did. They built an interactive application to cover the evening’s results as they arrived. This screenshot is for the riding in Fredericton, where my ancestors lived in the 19th century. (I had to have a connection to the ridings somehow.) In particular, I liked the ability to star ridings of interest and have them immediately retrievable. The CBC complemented that with a list of ridings to watch. It was a great resource for the evening.

Fredericton results
Fredericton results

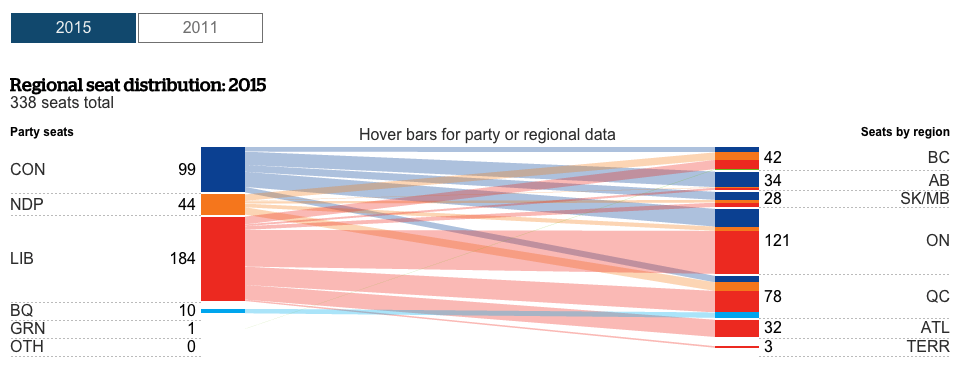
But then they also covered the results with an article with interactive graphics. This is more your standard fare with choropleths, bar charts, and line charts. But they flow through the article quite sensibly. Overall, a solid results piece.

Party results per region

Credit for the National Post piece goes to the National Post graphics department.

Credit for the CBC piece goes to the the CBC graphics department.

McDonald’s All-day Breakfast

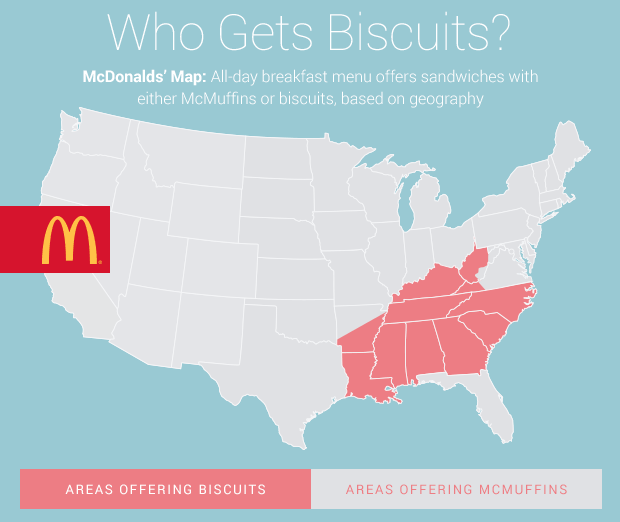
I don’t know about you, but I have seen a lot of those all-day breakfast bags sitting about the city of Chicago the last few days. (That they are not in waste bins is a different story.) CBS took a look at where the biscuit vs. McMuffin offering is available in the US—hint, not Chicago—and compared that geographic spread to something else. It’s worth a quick look.

Where to go for biscuits

Credit for the piece goes to CBS graphics department.

Uber vs. Taxi (in New York)

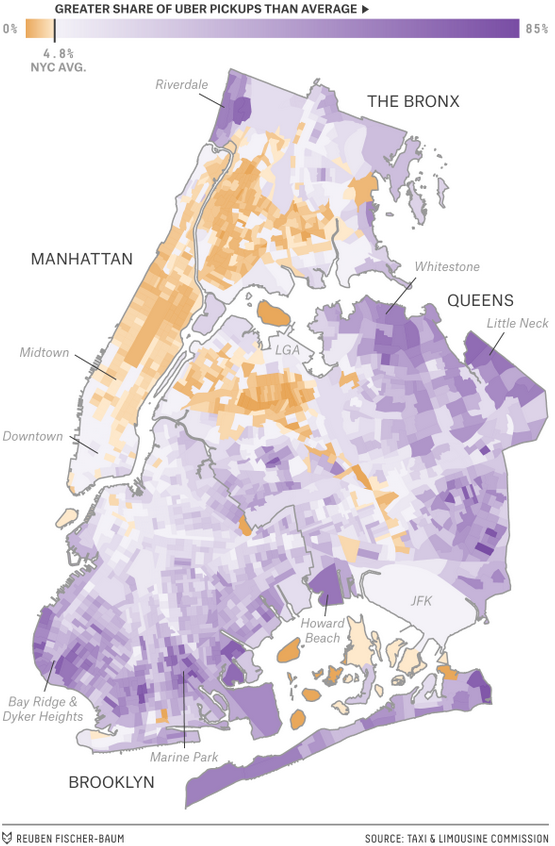
I just spent the weekend back in my hometown of Philadelphia and while we walked most places, there were a few Uber rides. As someone who doesn’t use the app and normally will hail a taxi when necessary, I had been looking forward to posting this piece. FiveThirtyEight looked at data for New York comparing Uber to taxis.

Share in New York
Share in New York

Credit for the piece goes to Reuben Fischer-Baum.

What is the Minimum Wage Worth

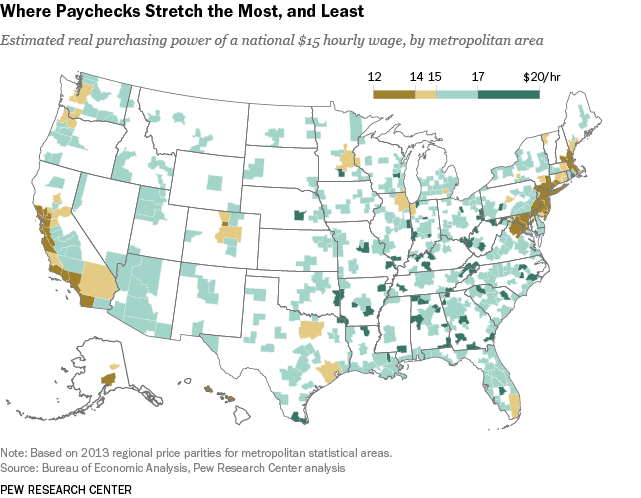
The minimum wage of $15 per hour does not necessarily mean the same thing to everyone all across the country. Based on where one lives, the purchasing power of a dollar might make minimum wage worth more or less than $15. The Pew Research Centre put together a map showing where $15 is worth more or less.

The purchasing power of minimum wage

Credit for the piece goes to the Pew Research Centre.

Your Average Daily Sunshine

(Hint, it’s not me.)

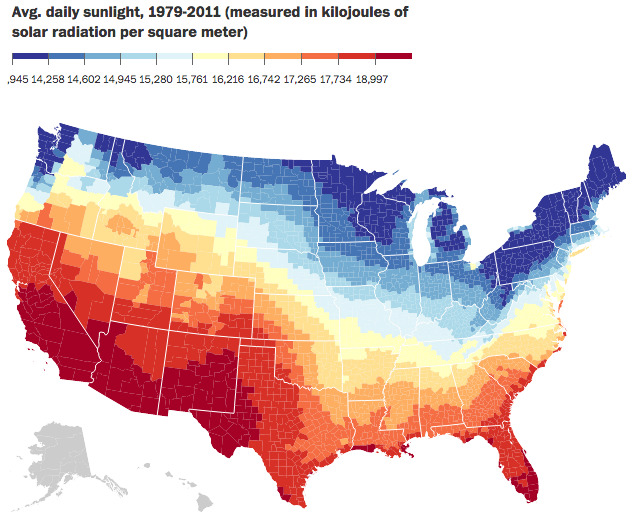
I was talking with someone the other day about how I dislike warm weather. Give me nice, cool, crisp weather any day of the week. And also how I am okay without sunshine—a cool, misty, grey day is lovely. Much of weather, of course, is determined by sunlight, energy, hitting the Earth. Well, just a few weeks ago the Washington Post published a piece looking at daily sunlight. At the end of the piece it has a nice small multiple graphic too.

Average daily sunlight

Credit for the piece goes to the Washington Post graphics department.

Greek Referendum Results

So when I initially planned to do this post for today, I thought the results would be a lot closer and the data display more interesting. But, I was wrong. It turns out the Greeks voted overwhelmingly against the European Union’s offer in a greater than 60–40 result. But, here we go anyways, a whole lot of no in this piece from the Guardian.

Turns out Greeks don't want austerity
Turns out Greeks don’t want austerity

Credit for the piece goes to the Guardian’s graphics team.

Does Your Hometown Impact Your Odds of Marriage?

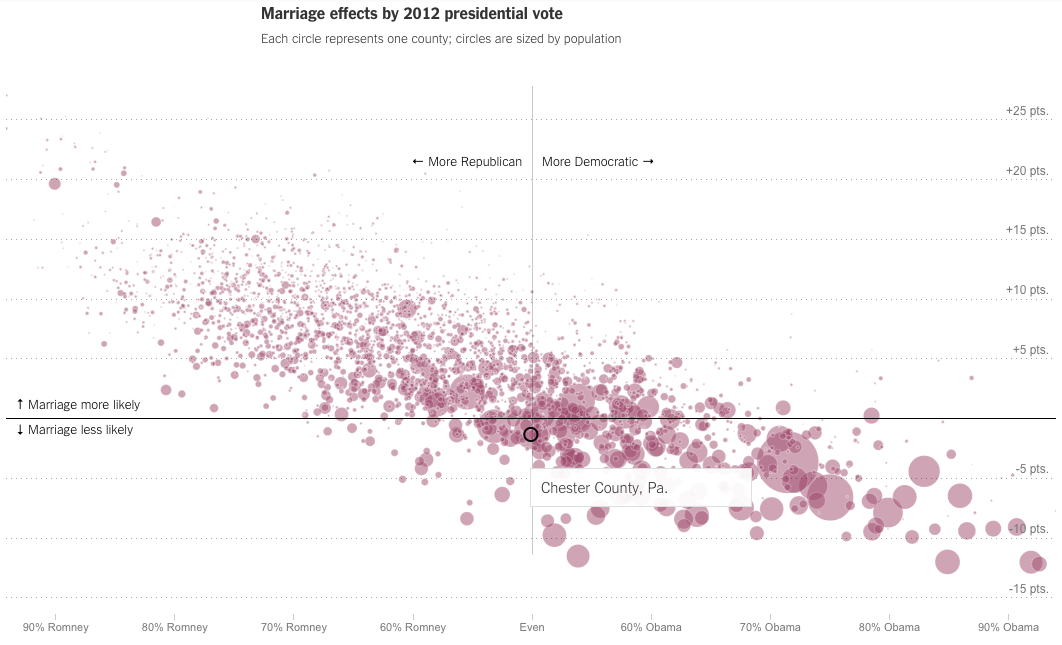
Last week we looked at the New York Times piece on where you grew up’s impact on future income. This week, we look at their follow-on piece, how your hometown impacts your odds of getting married. The piece includes some nice interactive choropleth maps, but my favourite part is the scatter plot correlating politics (as determined by 2012 election votes) to marriage. My hometown (‘s county) is highlighted in the screenshot below.

Chester Co., PA is almost even politically, but slightly less likely to marry

Credit for the piece goes to David Leonhardt and Kevin Quealy.