Biden’s Biggest Pyramids

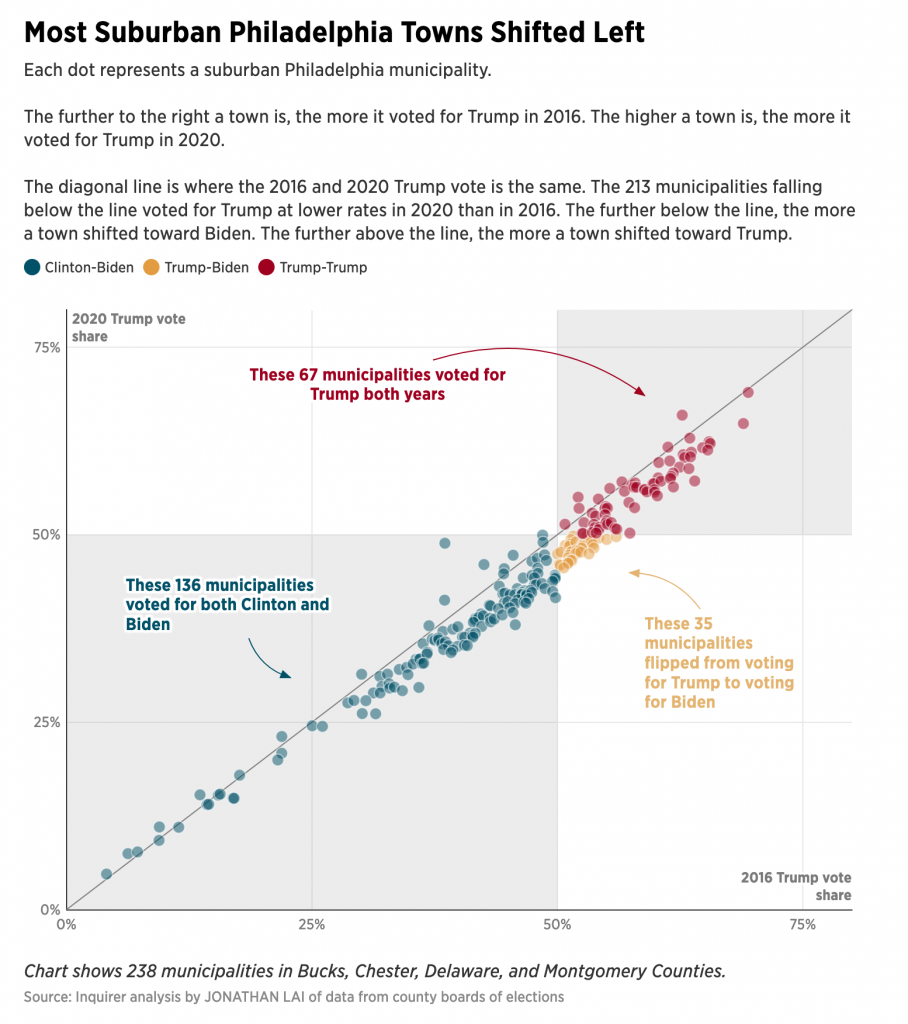
Yesterday we looked at an article from the Inquirer about the 2020 election and how Biden won because of increased margins in the suburbs. Specifically we looked at an interactive scatter plot.

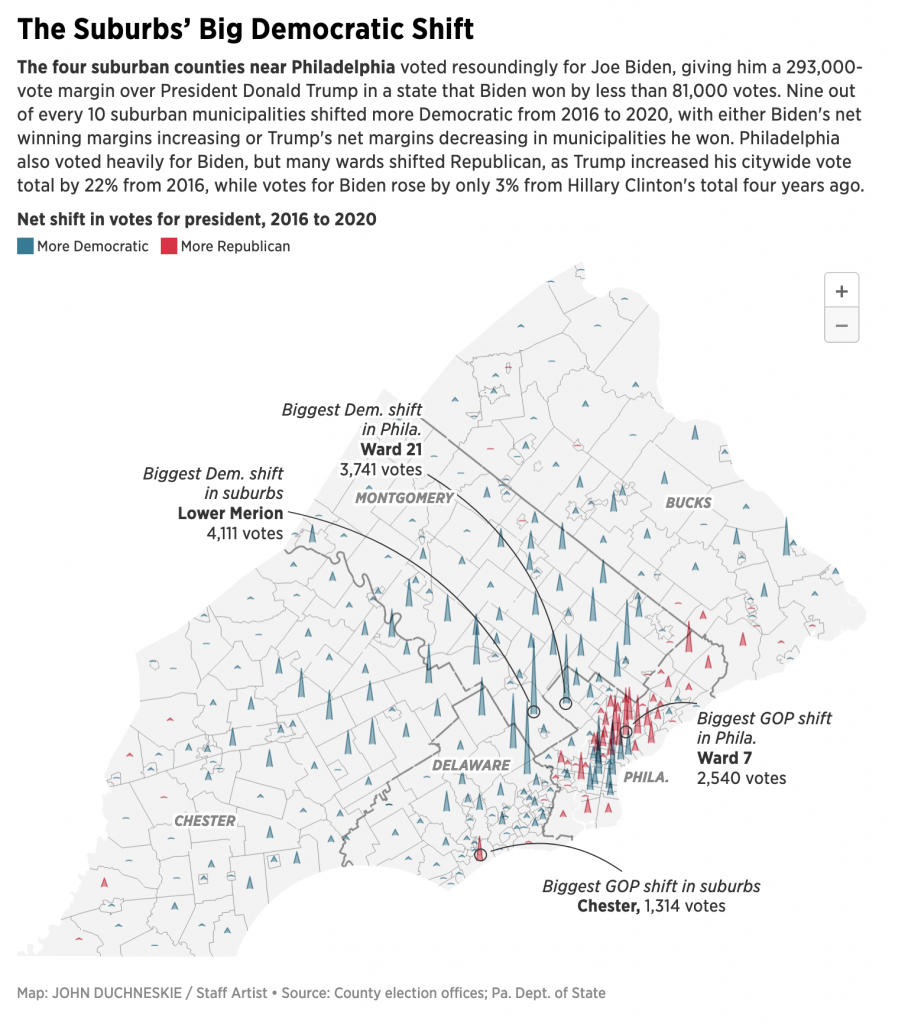
Today I want to talk a bit about another interactive graphic from the same article. This one is a map, but instead of the usual choropleth—a form the article uses in a few other graphics—here we’re looking at three-dimensional pyramids.
All the pyramids, built by aliens?

Yesterday we talked about the explorative vs. narrative concept. Here we can see something a bit more narrative in the annotations included in the graphic. These, however, are only a partial win, though. They call out the greatest shifts, which are indeed mentioned in the text. But then in another paragraph the author writes about Bensalem and its rightward swing. But there’s no callout of Bensalem on the map.

But the biggest things here, pun intended, are those pyramids. Unlike the choropleth maps used elsewhere in the article, the first thing this map fails to communicate is scale. We know the colour means a county’s net shift was either Democratic or Republican. But what about the magnitude? A big pyramid likely means a big shift, but is that big shift hundreds of votes? Thousands of votes? How many thousands? There’s no way to tell.

Secondly, when we are looking at rural parts of Bucks, Chester, and Montgomery Counties, the pyramids are fine. They remain small and contained within their municipality boundaries. Intuitively this makes sense. Broadly speaking, population decreases the further you move from the urban core. (Unless there’s a secondary city, e.g. Minneapolis has St. Paul.) But nearer the city, we have more population, and we have geographically smaller municipalities. Compare Colwyn, Delaware County to Springfield, Bucks County. Tiny vs. huge.

In choropleth maps we face this problem all the time. Look at a classic election map at the county level from 2016.
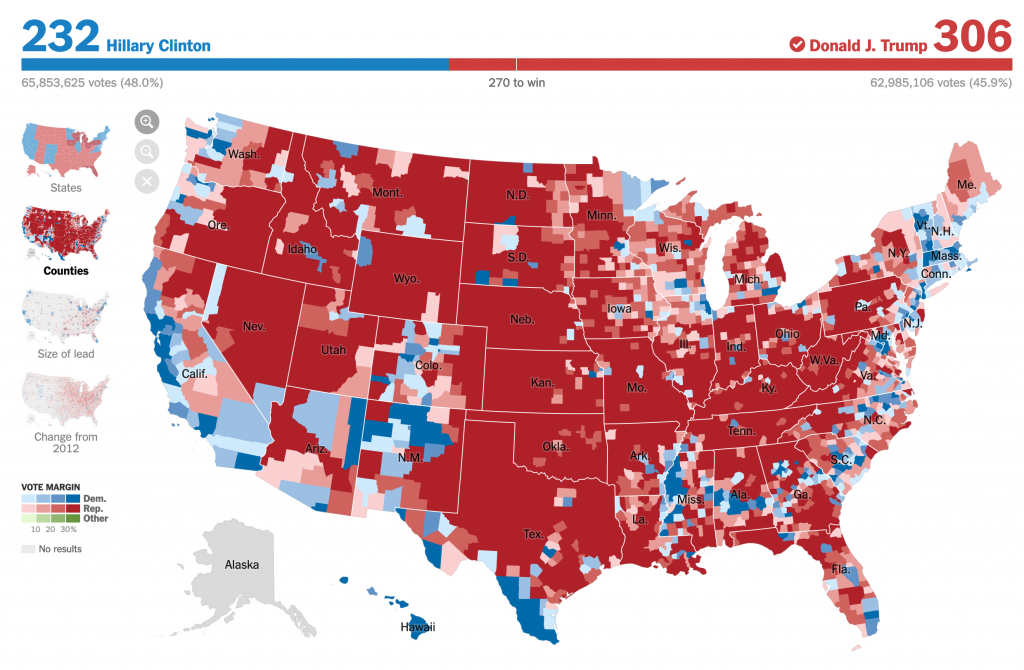
Wayb ack when…

You can see that there is a lot more red on that map. But Hillary Clinton won the popular vote by more then 3,000,000 votes. (No, I won’t rehash the Electoral College here and now.) More people are crowded into smaller counties than there are in those big, expansive red counties with far, far fewer people.

And that pattern holds true in the Philadelphia region. But instead of using the colour fill of an area as above, this map from the Inquirer uses pyramids. But we face the same problem, we see lots of pyramids in a small space. And the problem with the pyramids is that they overlap each other.

At a glance, you cannot see one pyramid beind another. At least in the choropleth, we see a tiny field of colour, but that colour is not hidden behind another.

Additionally, the way this is constructed, what happens if in a municipality there was a small net shift? The pyramid’s height will be minimal. But to determine the direction of the shift we need to see the colour, and if the area under the line creating the pyramid is small, we may be unable to see the colour. Again, compare that to a choropleth where there would at least be a difference between, say, a light blue and light red. (Though you could also bin the small differences into a single neutral bin collecting all small shifts be them one way or the other.)

I really think that a more straight forward choropleth would more clearly show the net shifts here. And even then, we would still need a legend.

The article overall, though, is quite strong and a great read on the electoral dynamics of the Philadelphia region a month ago.

Credit for the piece goes to John Duchneskie.

Biden Won the Burbs

The thing with election results is that we don’t have the final numbers for a little while after Election Day. And that’s normal.

There are a few things I want to look at in the coming weeks and months once my schedule eases up a bit. But for now, we can use this nice piece from the Philadelphia Inquirer to look at a story close to home: the vote in the Philadelphia suburbs.

It’s all happening in the yellow.

I’ve already looked at some analysis like this for Wisconsin and I shared it on my social. But there I looked at the easy, county-level results. What the Inquirer did above is break down the Pennsylvania collar counties of Philadelphia, i.e. the suburbs, into municipality level results. It then plotted them 2020 vs. 2016 and the results were—as you can guess since we know the result—Biden beat Trump.

What this chart does well is colours the municipalities that Biden flipped yellow. It’s a great choice from a colour standpoint. As the third of the primaries, with both blue and red well represented, it easily contrasts with the Biden- and Trump-won towns and cities of the region. The colour is a bit “darker” than a full-on, bright yellow, but that’s because the designers recognised it needs to stand out on a white field.

Let’s face it, yellow is a great colour to use, but it’s difficult because it’s so light and sometimes difficult to see. Add just the faintest bit of black to your mix, especially if you’re using paints, and voila, it works pretty well. So here the designer did a great job recognising that issue with using yellow. Though you can still see the challenge, because even though it is a bit darker, look at how easy it is to read the text in the blue and the red. Now compare that to the yellow. So if you’re going to use yellow, you want to be careful how and when you do.

The other design decision here comes down to what I call the explorative vs. the narrative. Now, I don’t think explorative is a word—and the red squiggle agrees—but it pairs nicely with narrative. And I’ve been talking about this a lot in my field the last several works, especially offline. (In the non-blog sense, because obviously all my work is done online these days. Oh, how I miss my old office.)

Explorative works present the user with a data set and then allow them to, in this case, mouse over or tap on dots and reveal additional layers of information, i.e. names and specific percentages. The idea is not to tell a specific story, but show an overall pattern. And if the piece is interactive, as this is, potentially allow the user to drill down and tease out their own stories.

Compare that to the narrative, my Wisconsin piece I referenced above is more in this category. Here the work takes you through a guided tour of the data. It labels specific data points, be them on trend or outliers and is sometimes more explicit in its analysis. These can also be interactive—though my static image is not—and allow users to drill down, and critically away, from the story to see dots of interest, for example.

This piece is more explorative. The scatter plot naturally divides the municipalities into those that voted for Biden, Trump, and then more or less than they voted for Trump in 2016. The labels here are actually redundant, but certainly helpful. I used the same approach in my Wisconsin graphic.

But in my Wisconsin graphic, I labelled specific counties of interest. If I had written an accompanying article, they would have been cited in the textual analysis so that the graphic and text complemented each other. But here in the Inquirer, it’s a bit of a missed opportunity in a sense.

The author mentions places like Upper Darby and Lower Merion and how they performed in 2020 vis-a-vis 2016. But it’s incumbent on the user to find those individual municipalities on the scatter plot. What if the designer had created a version where the towns of interest were labelled from the start? The narrative would have been buttressed by great visualisations that explicitly made the same point the author wrote about in the text. And that is a highly effective form of communication when you’re not just telling, but also showing your story or argument.

Overall it’s a great article with a lot to talk about. Because, spoiler, I’m going to be talking about it again tomorrow.

Credit for the piece goes to Jonathan Lai.

Italian Election Results

Europe enjoyed some significant political news yesterday. First, Angela Merkel will serve a fourth term as chancellor as the SPD members voted to allow their party to enter into a grand coalition with Merkel’s CDU/CSU party.

But the more important story is that of the Italian elections, where the centre-left under Matteo Renzi was attempting a comeback against the populist parties the 5-Star Movement and the League, the latter an anti-immigrant party. Also in the mix was Silvio Berlusconi, whose Forza party won 14% of the vote and as a member of a right/centre-right bloc that won 37%.

So I chose to highlight the homepage of IL Sore 24 Ore, an Italian newspaper, that had the results displayed clearly.

Live results at the top of the home page

Of course the big problem is that I can neither read nor speak Italian. So figuring out just what every label is proved to be a bit tricky. But once you figure it out, it is quite clear.  The nice blue banner for the real-time results (again with the assuming of translation) does a nice job of clearly separating itself from the rest of the page, but the tables inside are quiet and not screaming for attention. Instead the user is allowed to find his or her party of bloc of interest and then scan to the right for the bold number of seats in the respective chamber.

The results page is similarly nice, using clean and simple tables to organise the information. Using the Chamber of Deputies page as an example, the overall results appear on the left while important context via maps and specific regions appear to the right. All the while the use of simple typography and whitespace guide the user to the appropriate data set.

These are the results for the Chamber of Deputies, the equivalent to the US House or House of Commons

And lastly a screenshot of an article about the election results, none of which I can read. Here, instead of an interactive table or graphic, we have a static graphic showing the results. It certainly captures the results in this particular moment—exact seat numbers have not yet been released—but could grow stale as the day goes on. Although there very well could be a page with interactive results like this, but that I cannot find because, again, I cannot read Italian.

The centre-right bloc did well, as did the 5-Star Movement (M5S)

The design of the graphic is nice. It uses the popular half-circle arc to show who “crosses the finish line” in terms of blocs seating more than 50% of the chamber. But once again, I am most impressed by the clarity of the table and information displays through white space and typography. (Though I feel in this case white space should be more like light salmon-coloured space.)

Overall, the designers did a fantastic job of presenting the data and information, so well that a non-Italian could even figure it out.

Credit for the piece goes to the Il Sore 24 Ore graphics department.

Voting in Virginia

Today is Election Day here in the States, but neither for the presidency nor for Congress. 2017 is an off-year, but it does have a few interesting races worth following. One is the New Jersey gubernatorial election across the river here from Philadelphia. Further down the Northeast Corridor we have the gubernatorial election in Virginia. And then I am going to be following the special election for a Seattle suburb’s state-level district. Why? Because it all gets to setting the table for 2022.

These three elections are all important for one reason, they relate to the idea of solid political control of a state government. The analogy is what we have in Washington, DC where the Republicans control the executive branch and both chambers of the legislative branch. In New Jersey, Democrats control the state legislature while (in?)famous Chris Christie, a Republican, is governor. In Virginia, Terry McAuliffe, a Democrat, is governor whilst the General Assembly is solidly Republican—we will get to that in a minute, trust me—and finally in Washington, the governorship is Democratic, the lower chamber of the state legislature is Democratic, but the state senate is Republican by one seat. And one of those very seats is up for a special election today.

So why am I making the big deal about this? Because solid political control of a state allows for biased redistricting, or gerrymandering, in 2020, when the US Census will reapportion seats to states, and thereby electoral college votes. If the Republicans win in Virginia, which is possible in what the polls basically have as a toss-up, they can redistrict Virginia to make it even harder for Democrats to win. And if the Democrats win in New Jersey and Washington, as they are expected to, they will be able to redistrict the state in their favour. Conversely, if the Democrats win in Virginia, and Republicans in New Jersey and Washington, they can thwart overly gerrymandered districts.

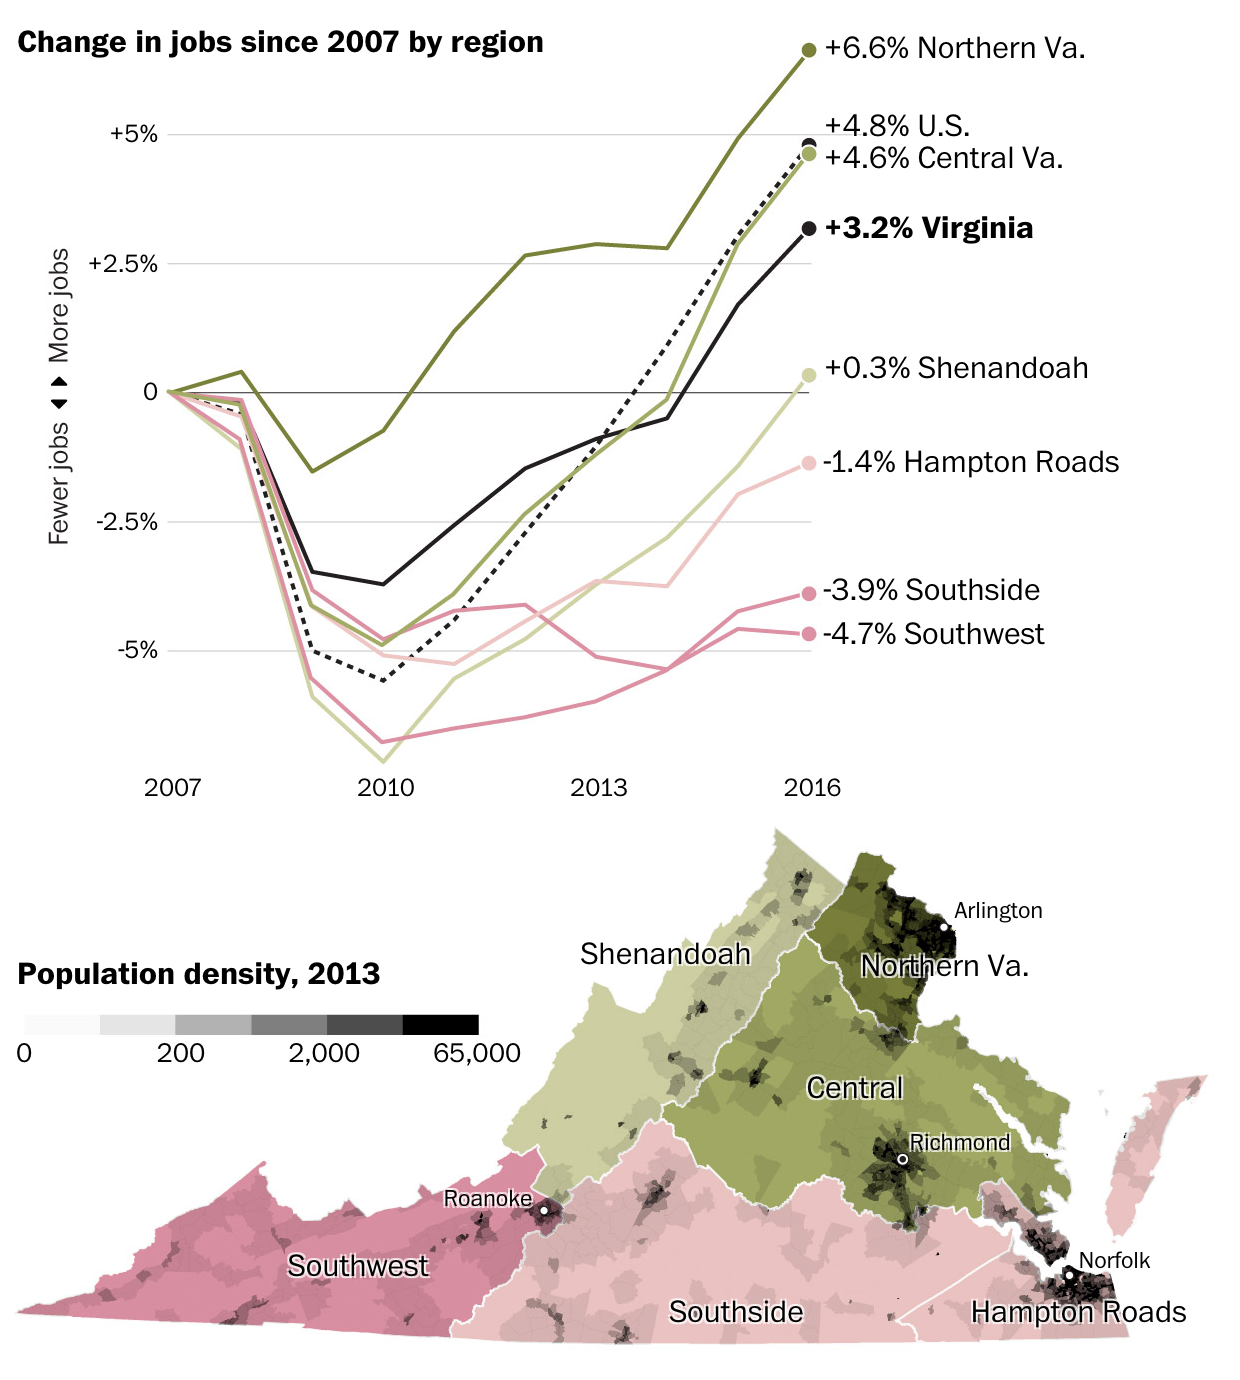
Which gets us to Virginia and today’s post. (It took awhile, apologies.) But as the state of Virginia changes, look at the dynamic growth in northern part of the state over the past decade, how will the changing demographics and socio-economics impact the state’s vote? Well, we have a great piece from the Washington Post to examine that.

The growth has been in northern Virginia thus far

It does a really nice job of showing where the votes are, in northern Virginia, and where the jobs are, again in northern Virginia. But how southern Virginia and Republicans in the north, might have just enough votes to defeat Democratic candidate Ralph Northam. The last polls I saw showed a very narrow lead for him over Republican Ed Gillespie. Interestingly, Gillespie is the very same Gillespie who architected the Republican’s massive victory in 2010 that obviously shifted the House of Representatives to the Republicans, but more importantly, shifted state legislatures and governorships to the Republicans.

That shift allowed for the Republicans to essentially stack the deck for the coming decade. And so even though in 2016, Democrats won more votes for the House of Representatives, they have far fewer seats. Even if there is a groundswell of new support for them in 2018, that same gerrymandering will make it near impossible for the Democrats to win the House. And so these votes in Virginia, New Jersey, and Washington state are fun to follow tonight—I will be—but they could also lay the groundwork for the elections in 2022 and 2024.

Basically, I just used today’s post to talk about why these three elections are important not for today, but for the votes in a few years’ time. But you really should check out the graphic. It makes nice use of layout, especially with the job bar chart organised by Virginia region. Overall, a solid and terrific piece.

Credit for the piece goes to Darla Cameron and Ted Mellnik.

A Throwback to Prior Kenyan Elections

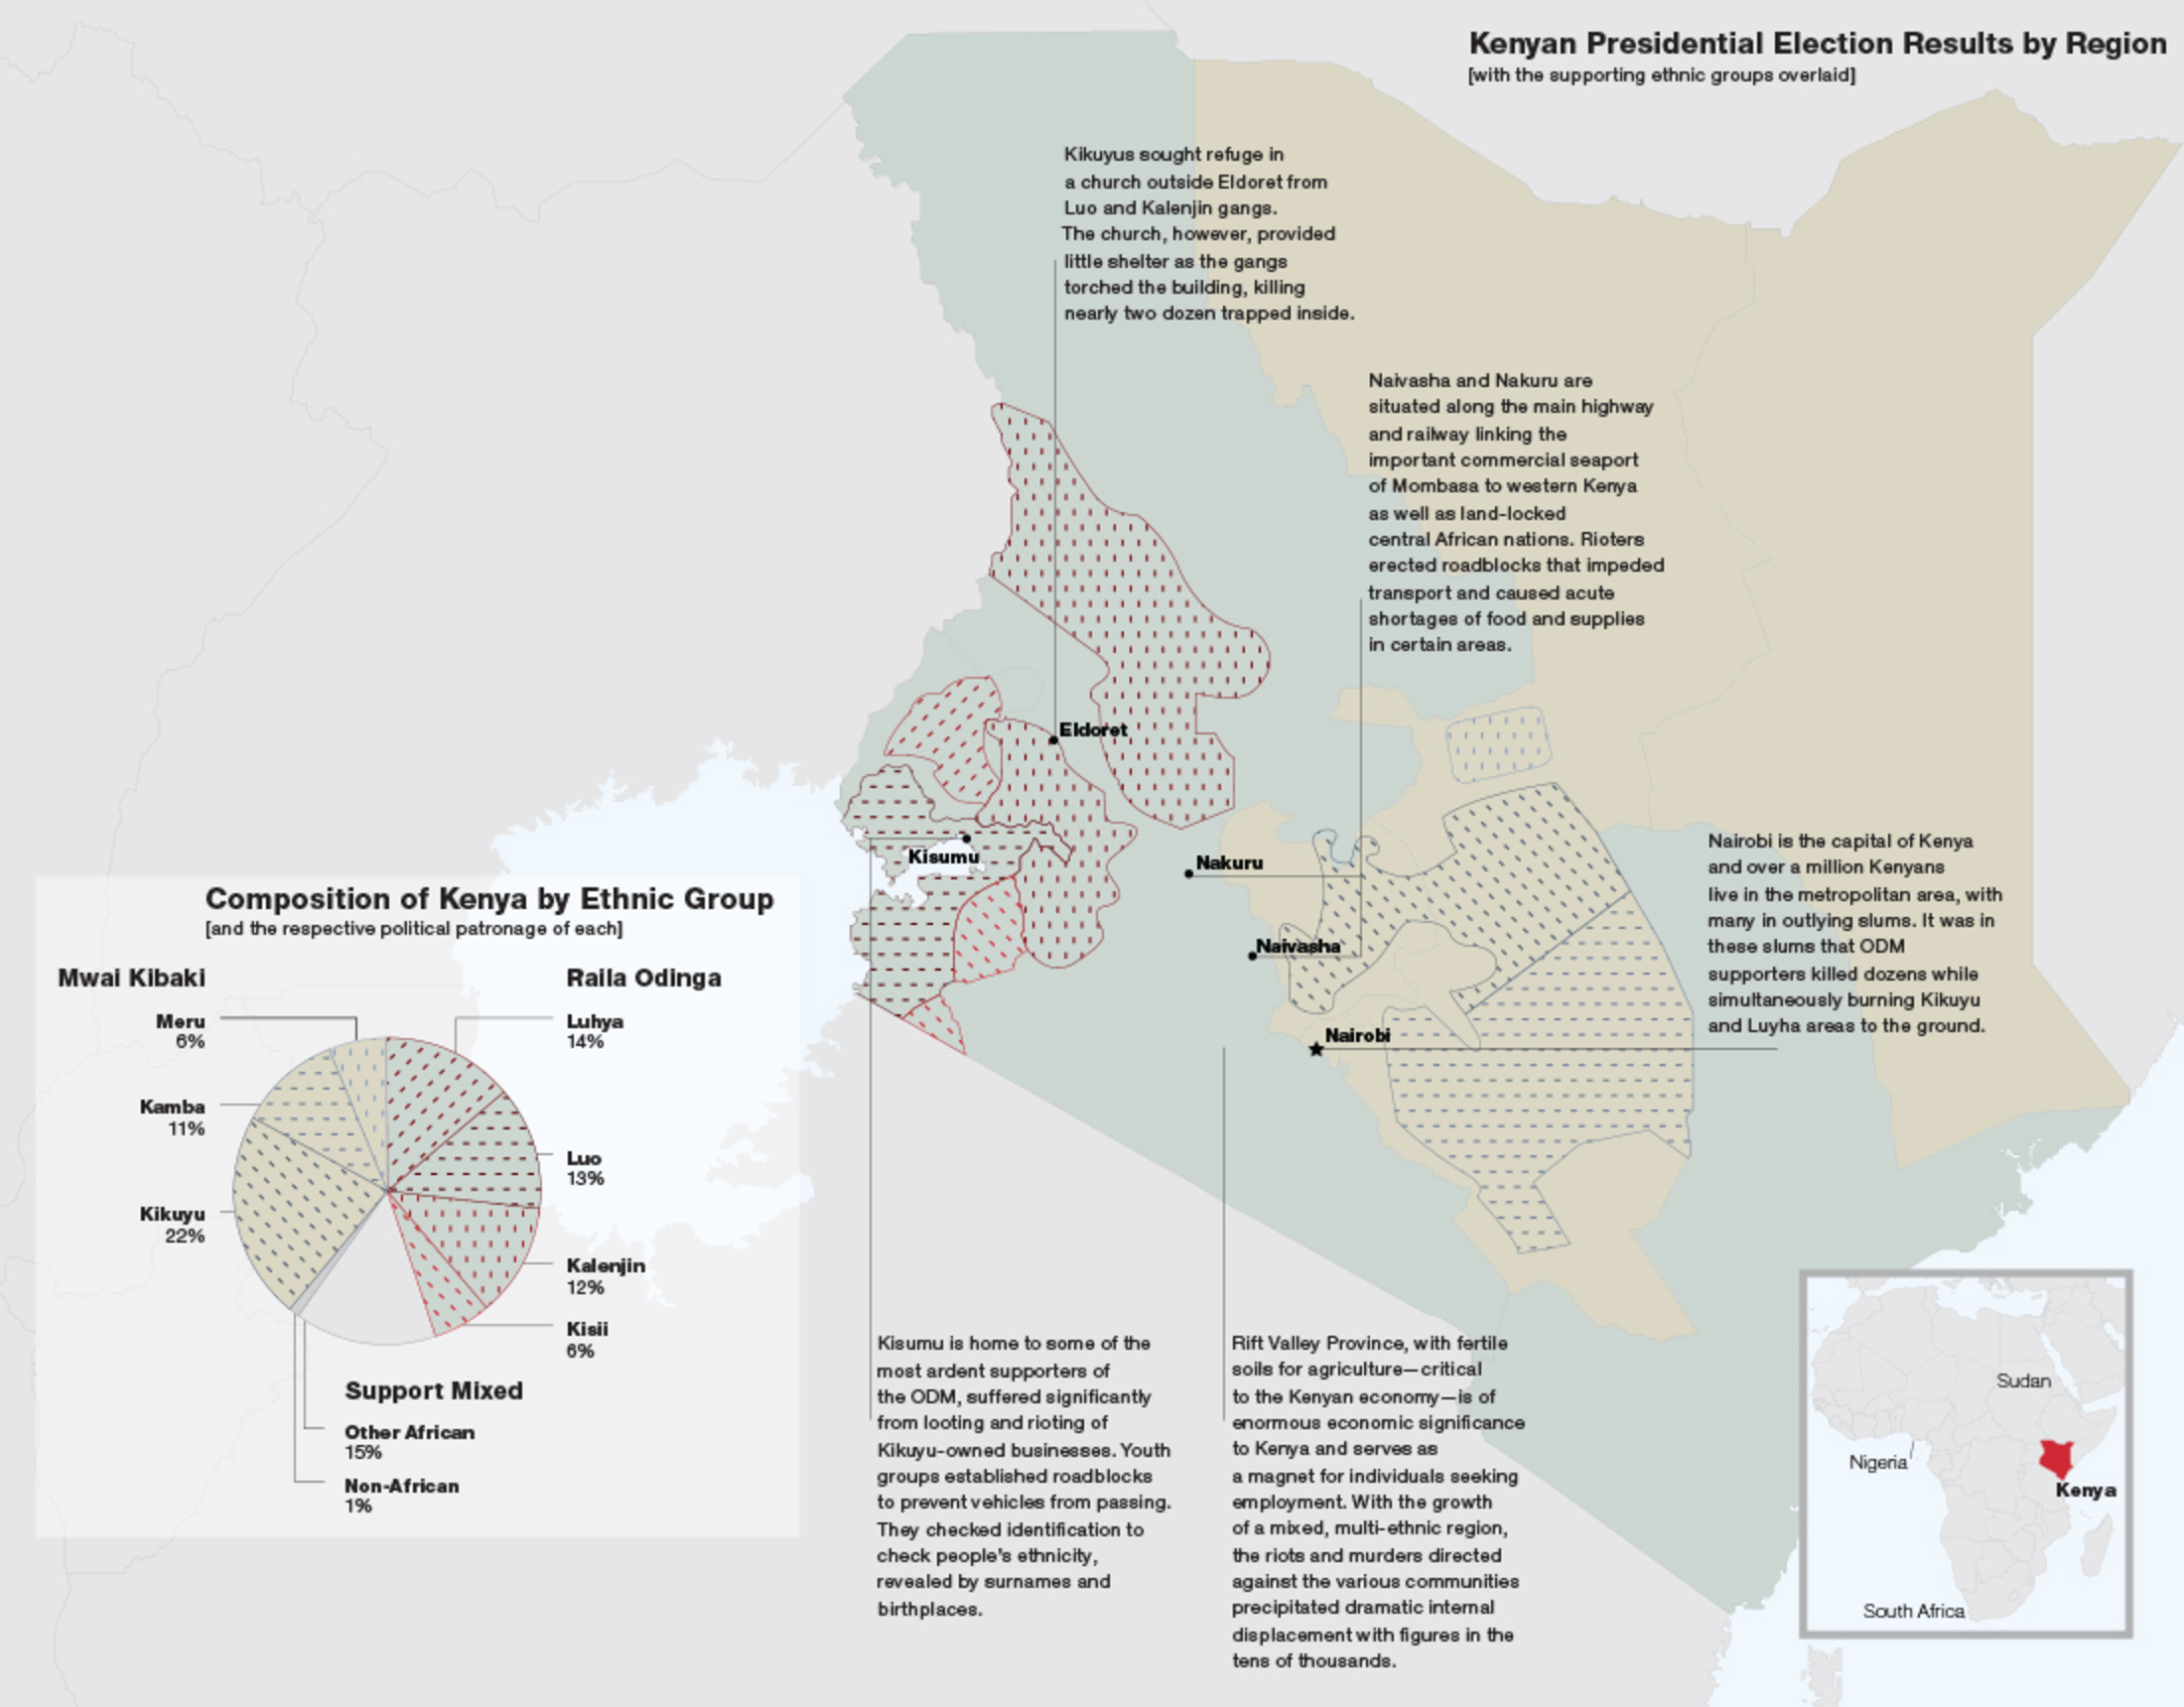
Kenya presently waits for the results of its presidential election, one that pitted incumbent Uhuru Kenyatta against Raila Odinga, a many ran but never won candidate. Now, if you will indulge me, the Kenyan elections have interested me since December 2007, which if you recall provoked sectarian violence to break out across the country.

At the time I had just started working at my undergraduate thesis, a book using Fareed Zakaria’s Future of Freedom as the text (with a parallel narrative from Chinua Achebe’s Things Fall Apart) and I wanted to use specific case studies and data to add to the point of the book. Kenya with its election result data and horrific outcome allowed me to do just that. I juxtaposed awful images of that violence with quiet text and a full-page graphic of the results. I still find it one of the stronger spreads in the book, but as we await the results in Kenya, I am hoping that a ten-year anniversary piece will not be required.

The page of data visualisation

And yes, I have learned a lot since 2007. Including my deep-seated antipathy for pie charts.

Credit for the piece goes to a much less knowledgable me.

Covering the New York Mayoral Primaries

Tuesday was election day in New York (among other places) where voters went to the polls for the mayoral primary (among other positions). For those living underneath what I can only presume was a very comfortable rock, this is the whole Anthony Weiner comeback election. Anyway, a bunch of different websites, most tied to the New York area, were covering the election results. So I wanted to share just a few.

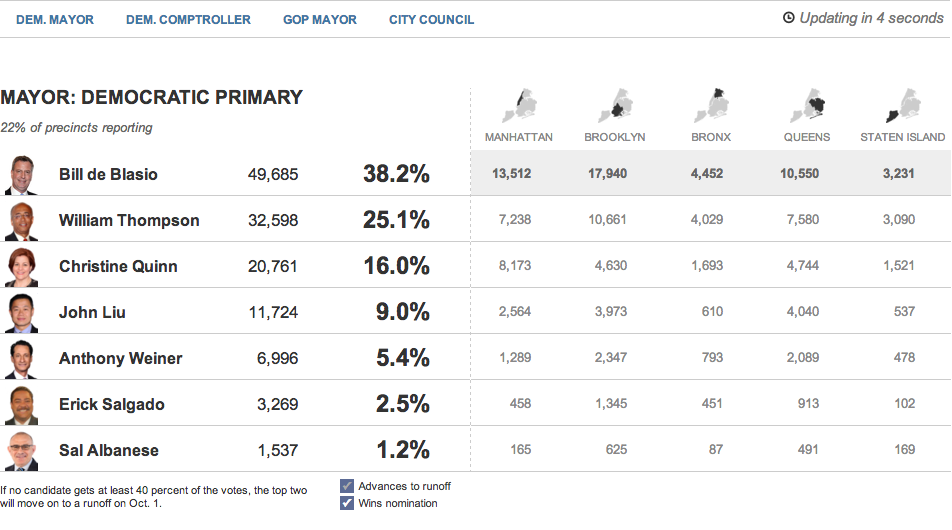
First we have the Huffington Post with the most straightforward presentation. Their table covers the main candidates and their results at a borough level and at a city-wide level.

The Huffington Post's tabular results
The Huffington Post’s tabular results

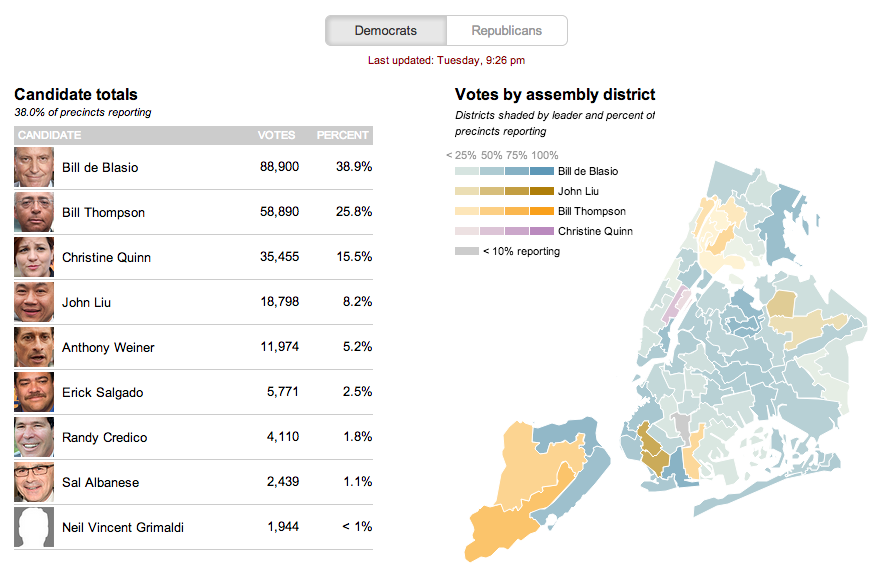
The second is from the Wall Street Journal. This uses a choropleth map with different colours assigned to a select few persons running—also the only ones with a real chance of winning. Tints of these colours in each district indicate how much of the district has voted.

The Wall Street Journal reports at the district level

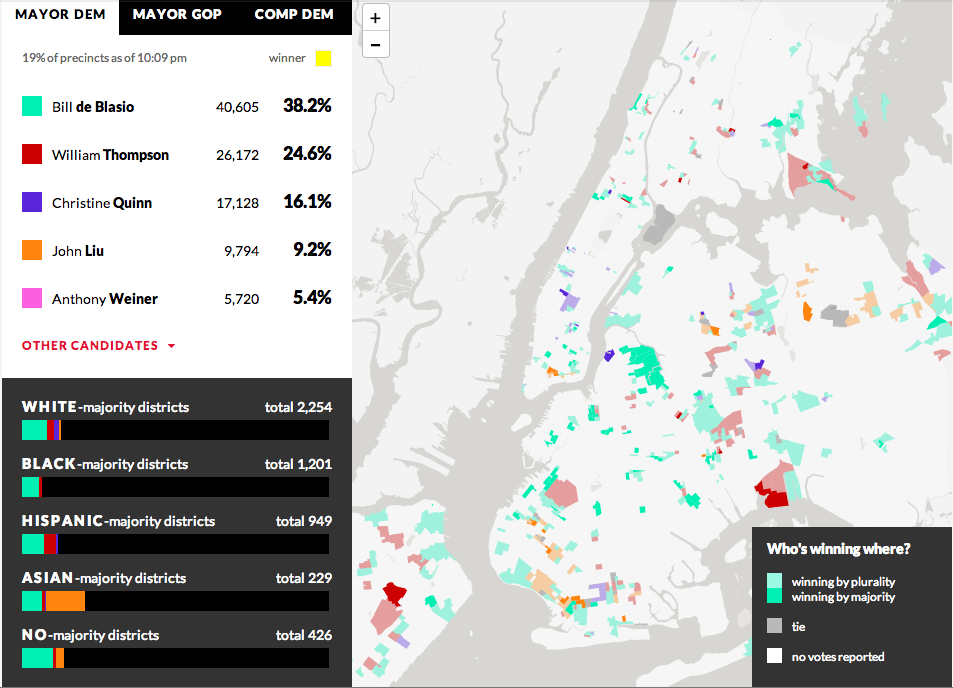
From WNYC we have our third example—another choropleth where different colours represent different candidates. However, unlike the Wall Street Journal, the colours here have only one tint. And instead of showing assembly districts, WNYC provides a further level of data and looks at precinct results. It does not represent the amount of the precinct that has voted, but rather whether the candidate is winning by a plurality or by a majority. Beneath the legend a second charting element is used; this details the breakdown of the vote by districts as separated into racial majority. This is an interesting addition that hints at filtering results by related data.

WNYC looks at who's winning and how
WNYC looks at who’s winning and how

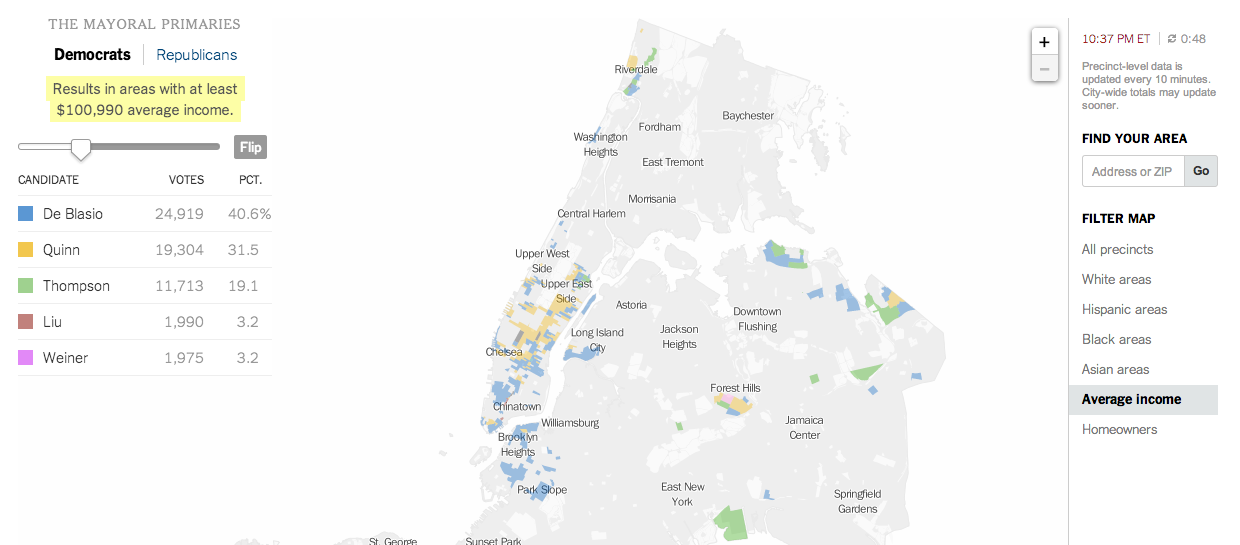
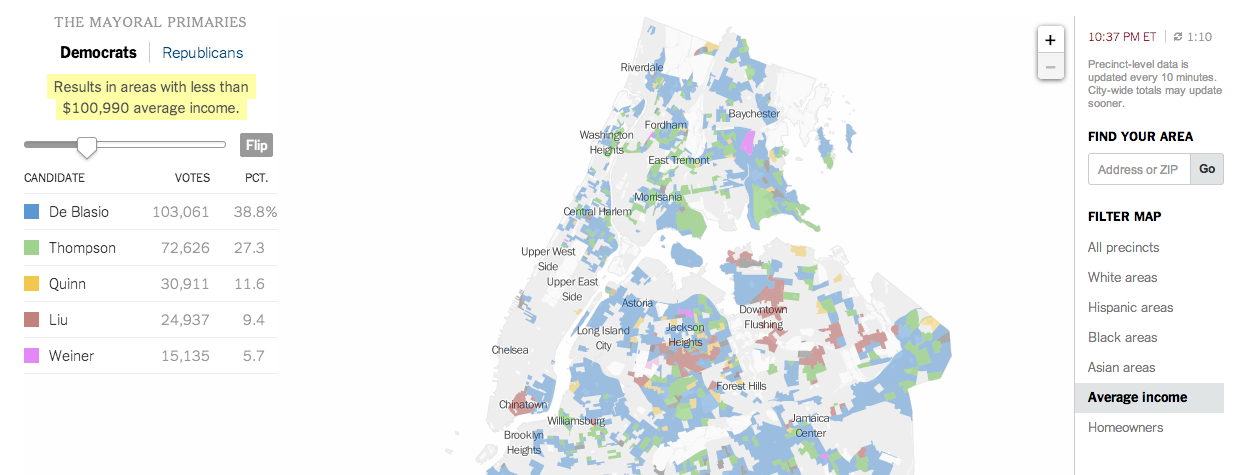
And that filtering brings us to the New York Times’ piece, which does offer filtering. It highlights districts on its maps—also precinct-level and not district aggregates—based upon the metric and the specific properties of said metric. In this case, I have chosen income. And the story of different voting patterns (at this particular point in the evening) based on income is quite clear. Look at Christine Quinn’s support.

Results from people earning more than $100k

Votes from people earning less than $100k


Credit for these:

Huffington Post: Aaron Bycoffe, Jay Boice, Andrei Scheinkman, and Shane Shifflett

Wall Street Journal: the Wall Street Journal’s graphics team

WNYC: Steven Melendez, Louise Ma, Jenny Ye, Marine Boudeau, Schuyler Duveen, Elizabeth Zagroba, and John Keefe

New York Times: New York Times’ graphics department

Ye Olde Boston Mayoral Candidate Map

A map? Again? I know. But trust me, this one is interesting. For those of you who do not know, Boston’s Thomas Menino is not running for reelection this year. By the time he leaves office, he will have been the mayor of Boston for over twenty years and so this year is the first open election in a long, long time.

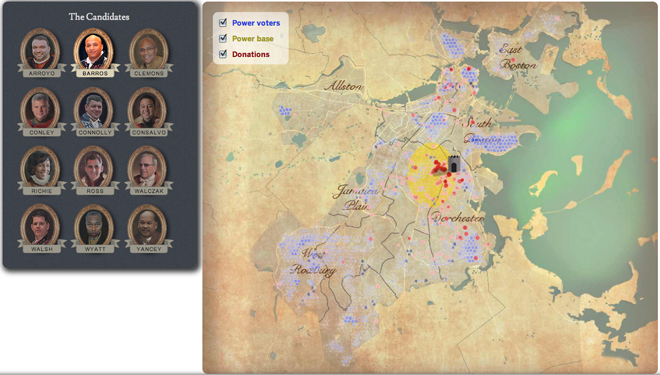
So what’s better than graphics for election-related data? Graphics with a medieval/Renaissance/fiefdom aesthetic, that’s what. With a little bit of fun, the Boston Globe mapped out the local areas of strength for the 12 candidates for mayor. The residence of each is denoted by a castle keep while areas of strength, location of donors, and key voting areas are signified in different colours. And the map’s background? Well, you can see for yourself.

Boston mayoral candidate map

Credit for the piece goes to Alvin Chang, Andrew Ryan, Javier Zarracina, and Matt Carroll.

Elections in Mali

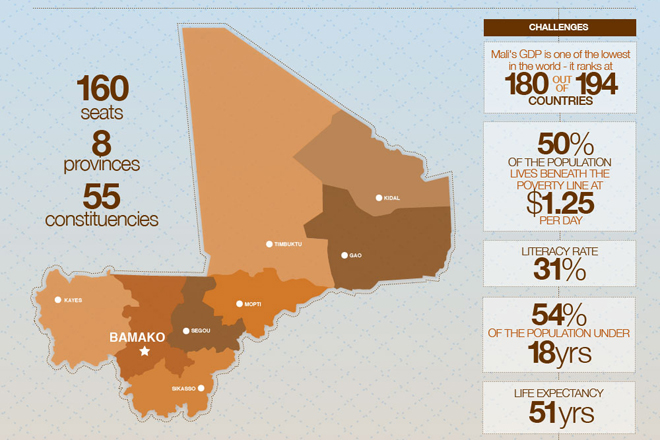
For those of you who did not know, the country of Mali held elections yesterday and results should be forthcoming. Those of you who regularly read or semi-frequently check my blog, you are likely familiar with the work I did covering the French-led intervention in Mali. I am a bit busy working on some other projects, so I did not have the time to prepare a graphic for the election as I had hoped. Nor did many others. Alas, the only graphic I have come upon is from Al Jazeera. And it is a mess.

Mali's election
Mali's election

That map only shows the provinces; the colours signify nothing. Nor is there any context for the factettes on the side. And while perhaps the intention was to show Mali in a snapshot, I think a piece about the challenges facing Mali could delve a bit into forecasted statistics. I credit the team behind the project with attempting to cover the story, but aside from biographies on the four leading candidates and overviews of the main militant groups, the piece lacks depth and substance.

Ultimately, after looking at the work, I am left wanting more. A lot more.

Credit for the piece goes to Alia Chughtai and Jacob Powell.

Election Stuff You Might Have Missed

The United States is not the only country in the world to have an election this November. It isn’t even the only big country. China is/had elections to replace the top leadership in Beijing. That’s right, it’s that about that time once every ten years when the Chinese political leadership is replaced.

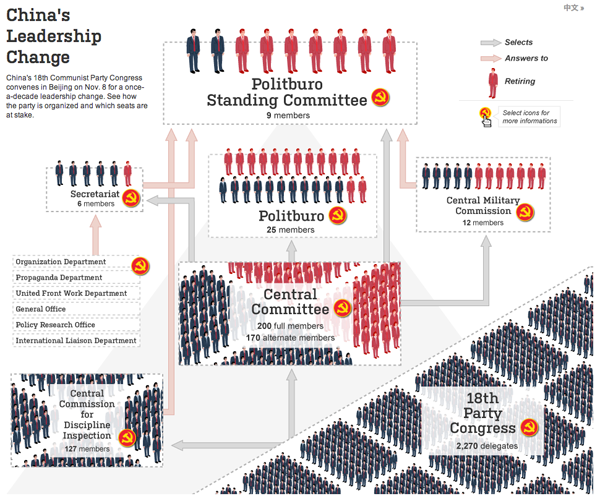
The Wall Street Journal had a nice interactive piece introduced with an animated video explaining just how the Chinese political system works. Or at least how we think it works. It’s not an entirely transparent system. Though as Americans have discovered lately, the transparency in seeing how large pieces of legislation are conceived, written, and passed is not necessarily a good thing.

Along with the diagram of the system, the piece offers photos and brief biographies for the presumed front runners. The “winners” of the elections should be announced sometime Thursday. Along with the new leaders, the Communist Party may also reduce the Politburo Standing Committee from nine members to seven members for more efficient governing. But nobody knows. We’ll see Thursday.

The 18th Party Congress