Europe enjoyed some significant political news yesterday. First, Angela Merkel will serve a fourth term as chancellor as the SPD members voted to allow their party to enter into a grand coalition with Merkel’s CDU/CSU party.
But the more important story is that of the Italian elections, where the centre-left under Matteo Renzi was attempting a comeback against the populist parties the 5-Star Movement and the League, the latter an anti-immigrant party. Also in the mix was Silvio Berlusconi, whose Forza party won 14% of the vote and as a member of a right/centre-right bloc that won 37%.
So I chose to highlight the homepage of IL Sore 24 Ore, an Italian newspaper, that had the results displayed clearly.

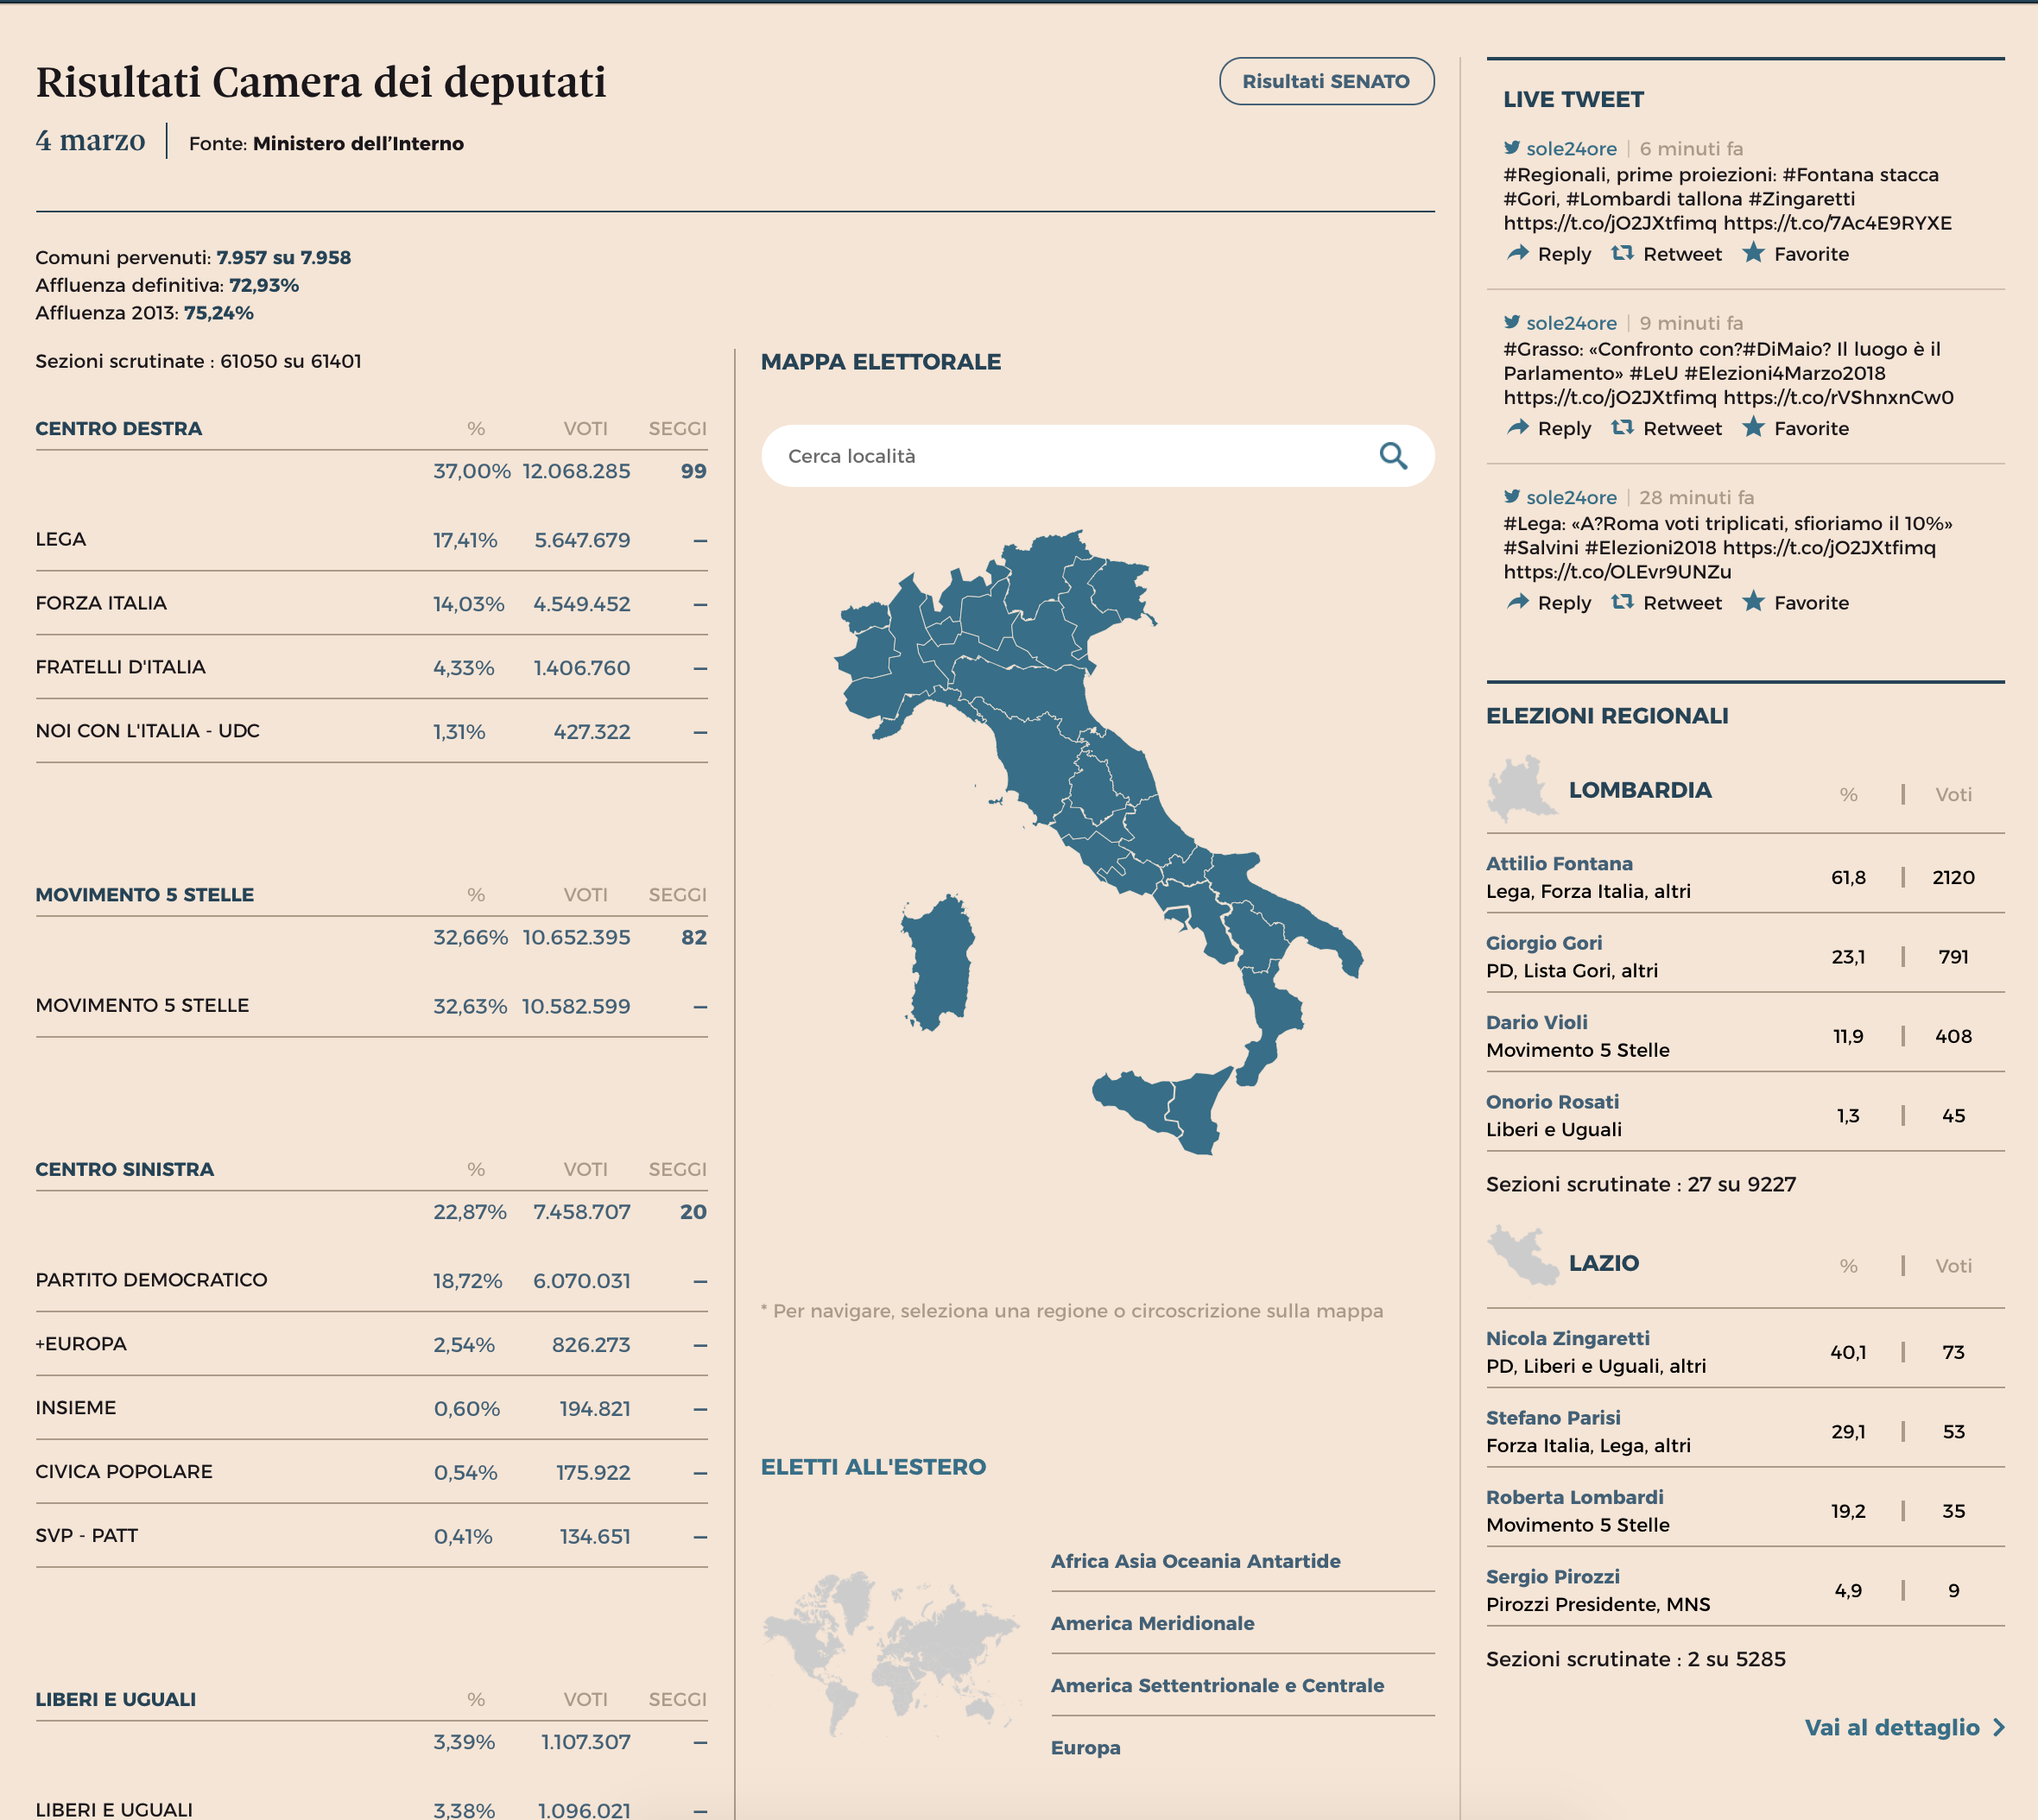
Of course the big problem is that I can neither read nor speak Italian. So figuring out just what every label is proved to be a bit tricky. But once you figure it out, it is quite clear. The nice blue banner for the real-time results (again with the assuming of translation) does a nice job of clearly separating itself from the rest of the page, but the tables inside are quiet and not screaming for attention. Instead the user is allowed to find his or her party of bloc of interest and then scan to the right for the bold number of seats in the respective chamber.
The results page is similarly nice, using clean and simple tables to organise the information. Using the Chamber of Deputies page as an example, the overall results appear on the left while important context via maps and specific regions appear to the right. All the while the use of simple typography and whitespace guide the user to the appropriate data set.

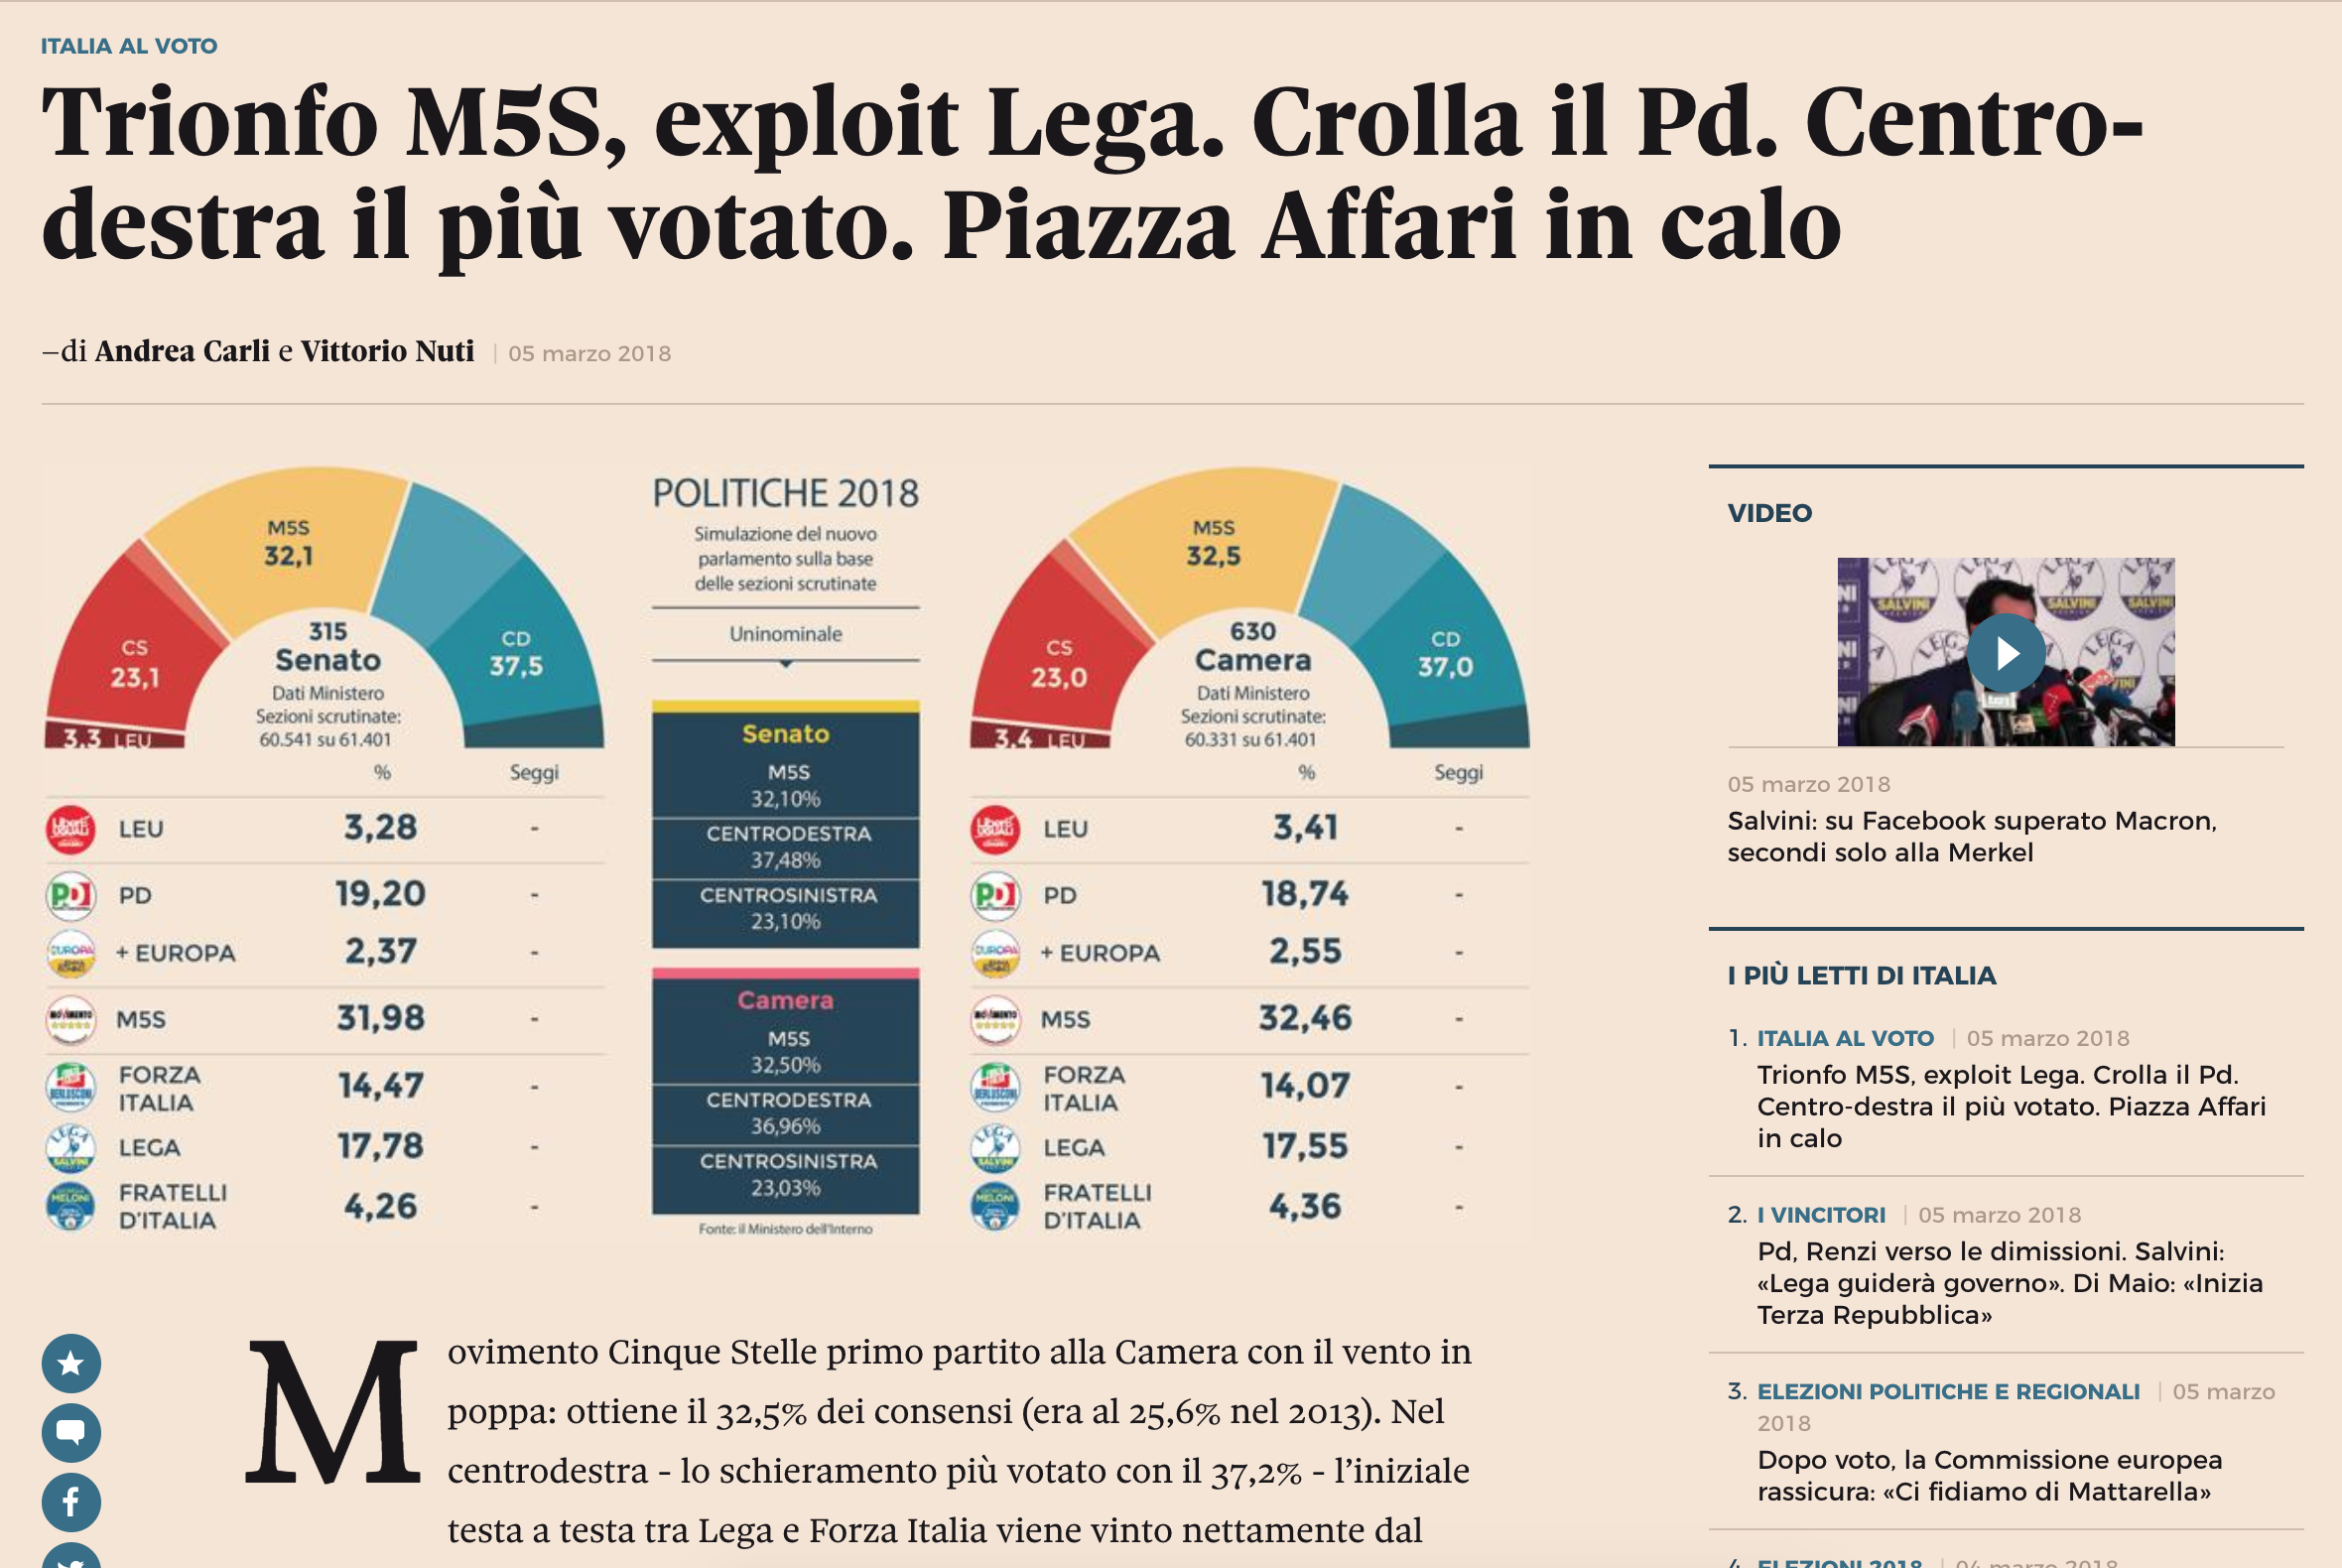
And lastly a screenshot of an article about the election results, none of which I can read. Here, instead of an interactive table or graphic, we have a static graphic showing the results. It certainly captures the results in this particular moment—exact seat numbers have not yet been released—but could grow stale as the day goes on. Although there very well could be a page with interactive results like this, but that I cannot find because, again, I cannot read Italian.

The design of the graphic is nice. It uses the popular half-circle arc to show who “crosses the finish line” in terms of blocs seating more than 50% of the chamber. But once again, I am most impressed by the clarity of the table and information displays through white space and typography. (Though I feel in this case white space should be more like light salmon-coloured space.)
Overall, the designers did a fantastic job of presenting the data and information, so well that a non-Italian could even figure it out.
Credit for the piece goes to the Il Sore 24 Ore graphics department.
