One of the important stories of last week that was not black hole related was that of the re-election of the Likud Party in Israel, a party headed by Benjamin Netanyahu. This will be his fourth consecutive time as prime minister plus a fifth back in the late 1990s. Of course, he is facing an expected arrest and charges on corruption, so how long he might remain in office is yet to be determined.
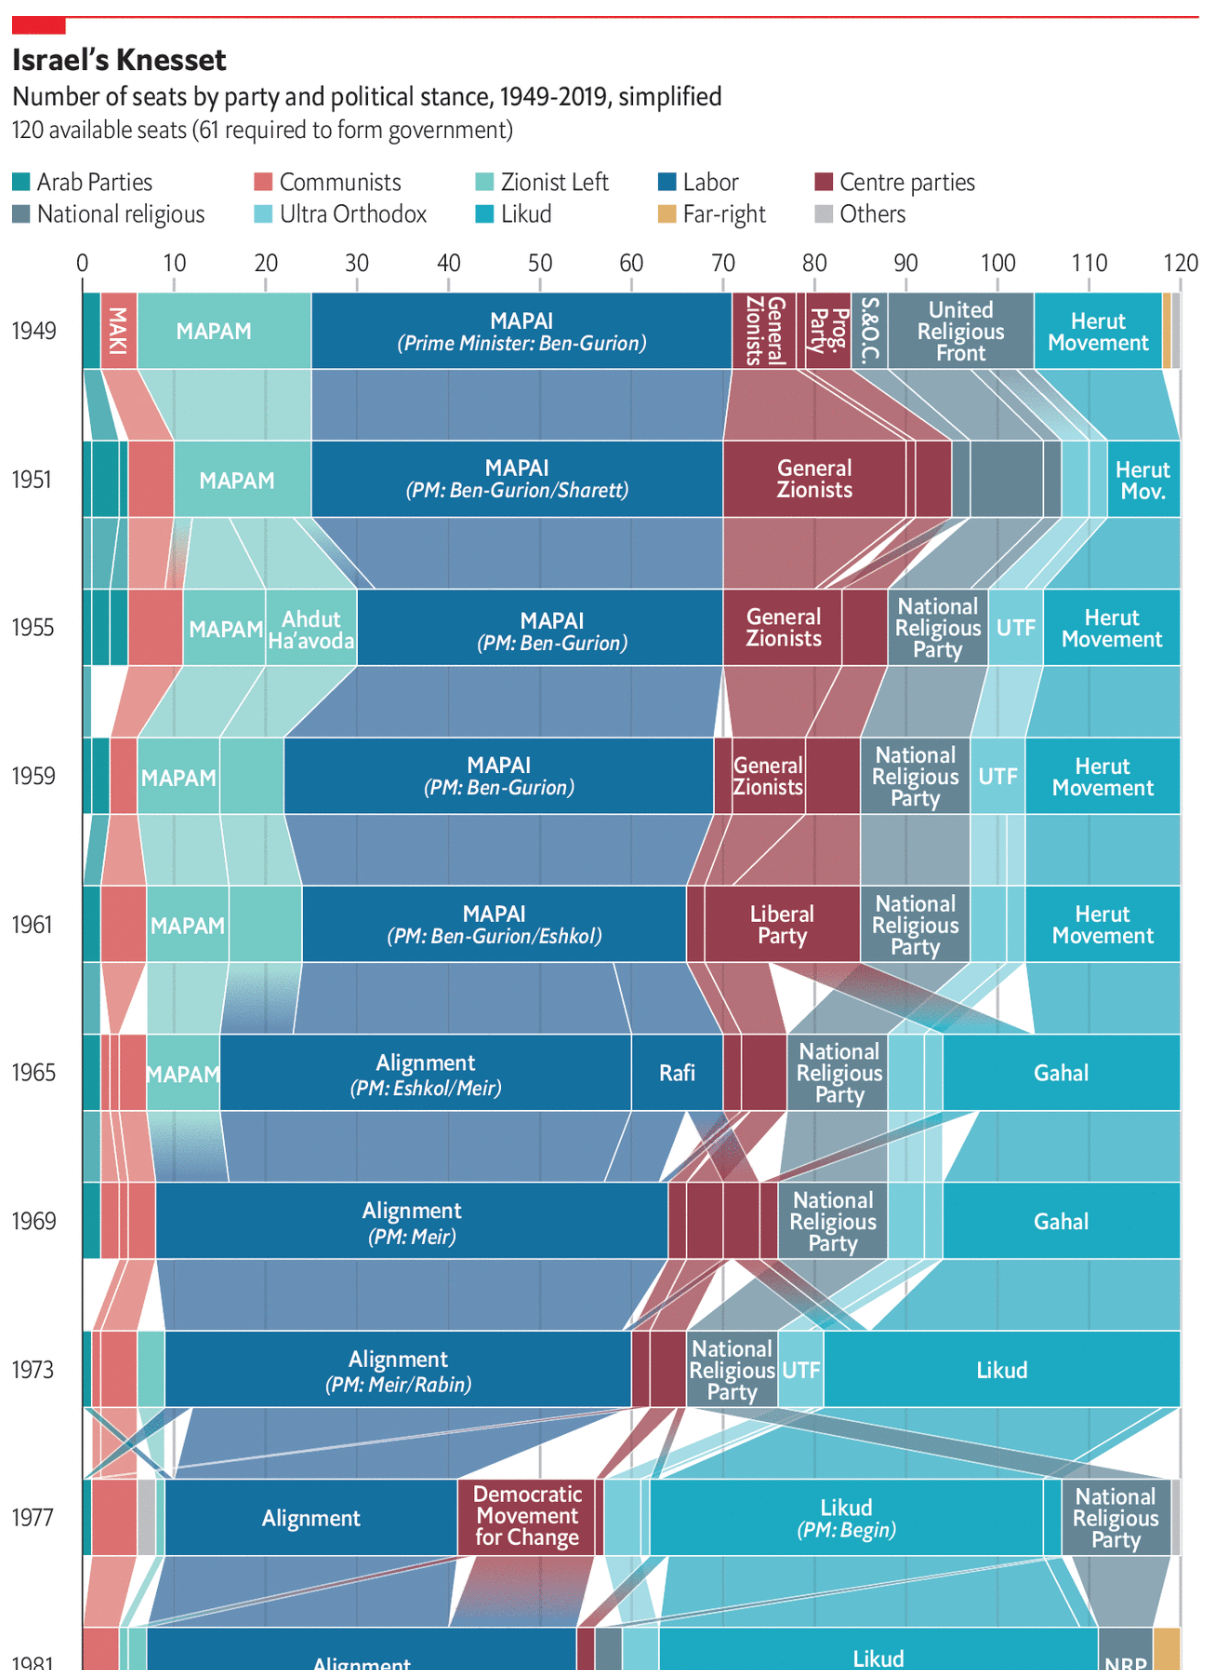
However, the Economist put together this great piece using a Sankey diagram showing the ebbs and flows of the various political parties in Israel since its founding.
It’s definitely not a two-party system…
Obviously, this is only a partial screenshot, but it does a great job showing those changes. Most impressive is the designers’ ability to show the continuity of the evolving parties and the name changes and the splits and recombinations.
Credit for the piece goes to the Economist Data Team.
On Sunday night I went to see the English rock band Muse perform here in Philadelphia. The concert was to support their latest album, but of course they played Starlight, a song which gave us its respective album’s title: Black Holes and Revelations.
Then on Wednesday, scientists announced that for the very first time, we have actually been able to take a photograph of a blackhole. This one is a supermassive black hole at the heart of the M87 galaxy, some 500 million trillion kilometres distant.
Hopes and expectations?
The bright light, or ring of fire, is the heated gas before falling beneath the event horizon, which here is the black disk. Beyond that point, the gravitational force is so strong that not even light can escape. And of course without light escaping to be seen, a black hole cannot be directly imaged. Instead, we have to look for its accretion disc.
It’s just cool.
Credit for the piece goes to the Event Horizon Telescope Collaboration.
Last week the New York Times published an article about carbon taxes, looking at their adoption around the world and their effectiveness. It is a fascinating article about how different countries have chosen to implement the broad policy idea and the various forms it can take. And, most importantly, how some of those policies can end up blunting the intended effect of carbon emission reduction.
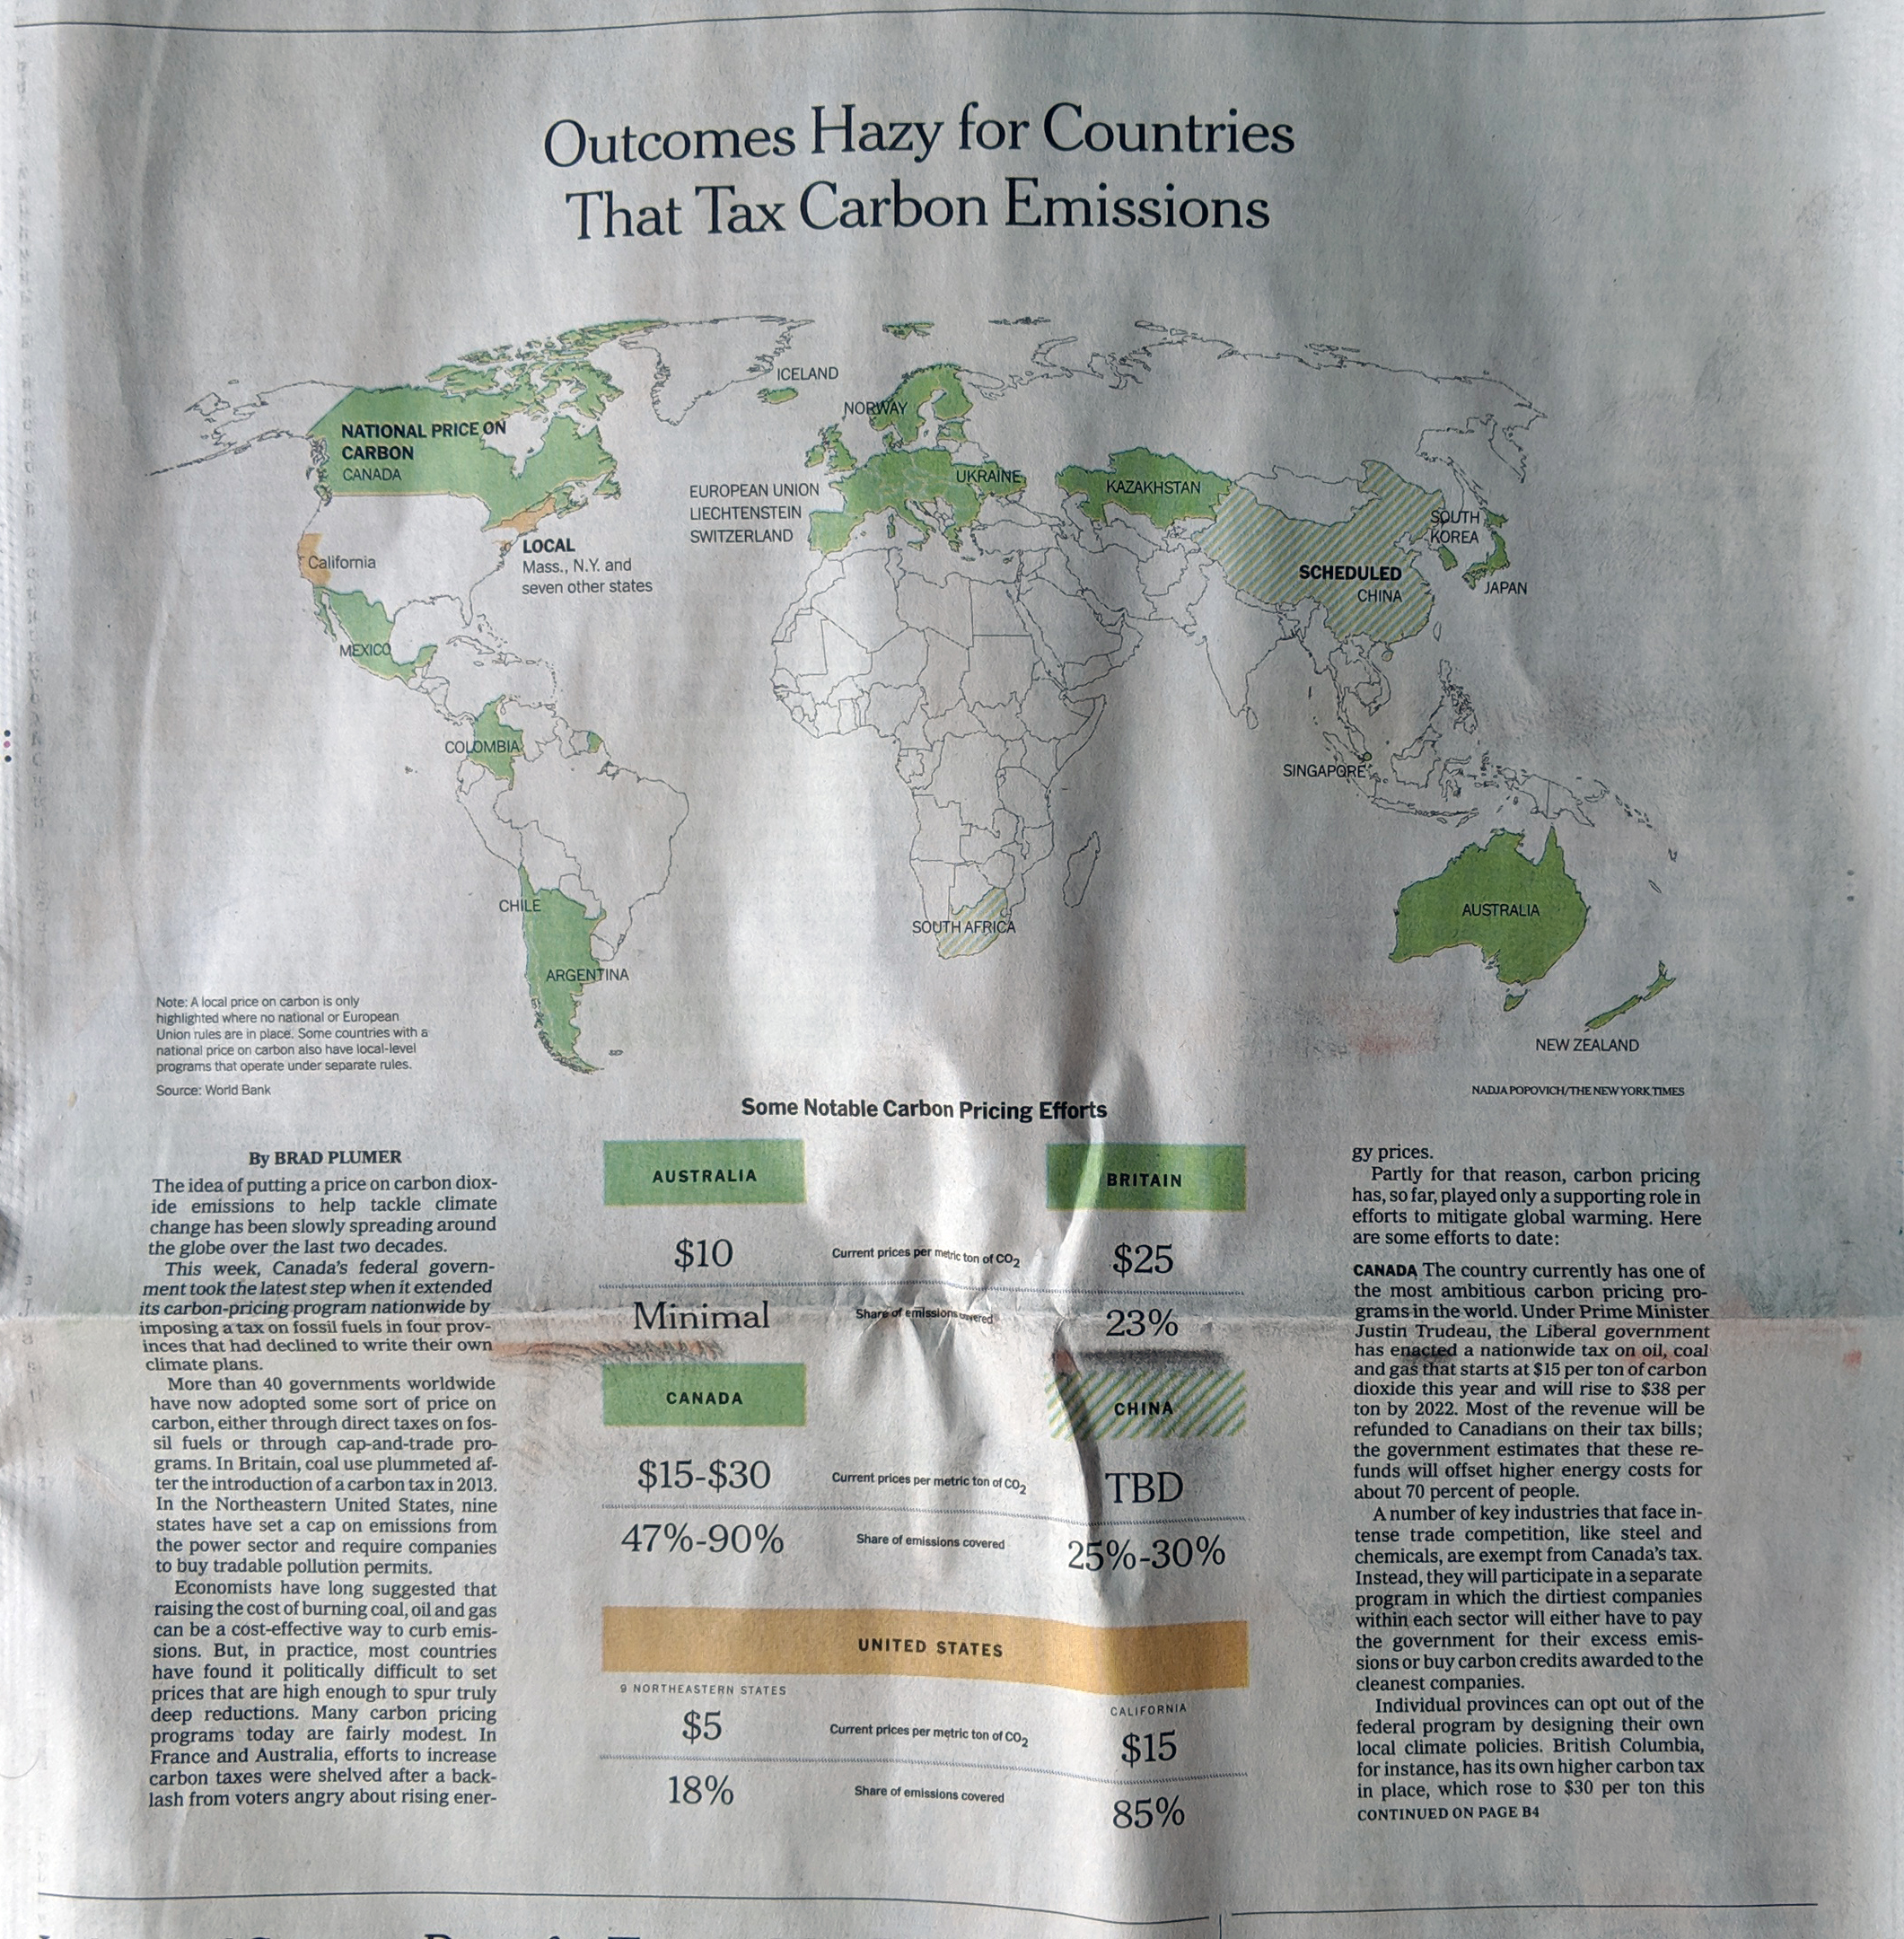
This, however, is about the print piece, because as I was flipping through the morning paper, I found the Business section had a world map above the fold. And we all know how I feel about big, splashy print graphics.
We could use some more green on this map
Here we have a pretty straight-forward piece. It uses a map to indicate which countries have adopted or are scheduled to adopt a carbon tax programme. The always interesting bit is how the federal system in the United States is represented. Whilst a carbon cap-and-trade deal failed in the US Senate in 2009, individual states have taken up the banner and begun to implement their own plans. Hence, the map shows the states in yellow.
There is nothing too crazy going on in the piece, but it is just a reminder that sometimes, as a designer, I love big splashy graphics to anchor an article.
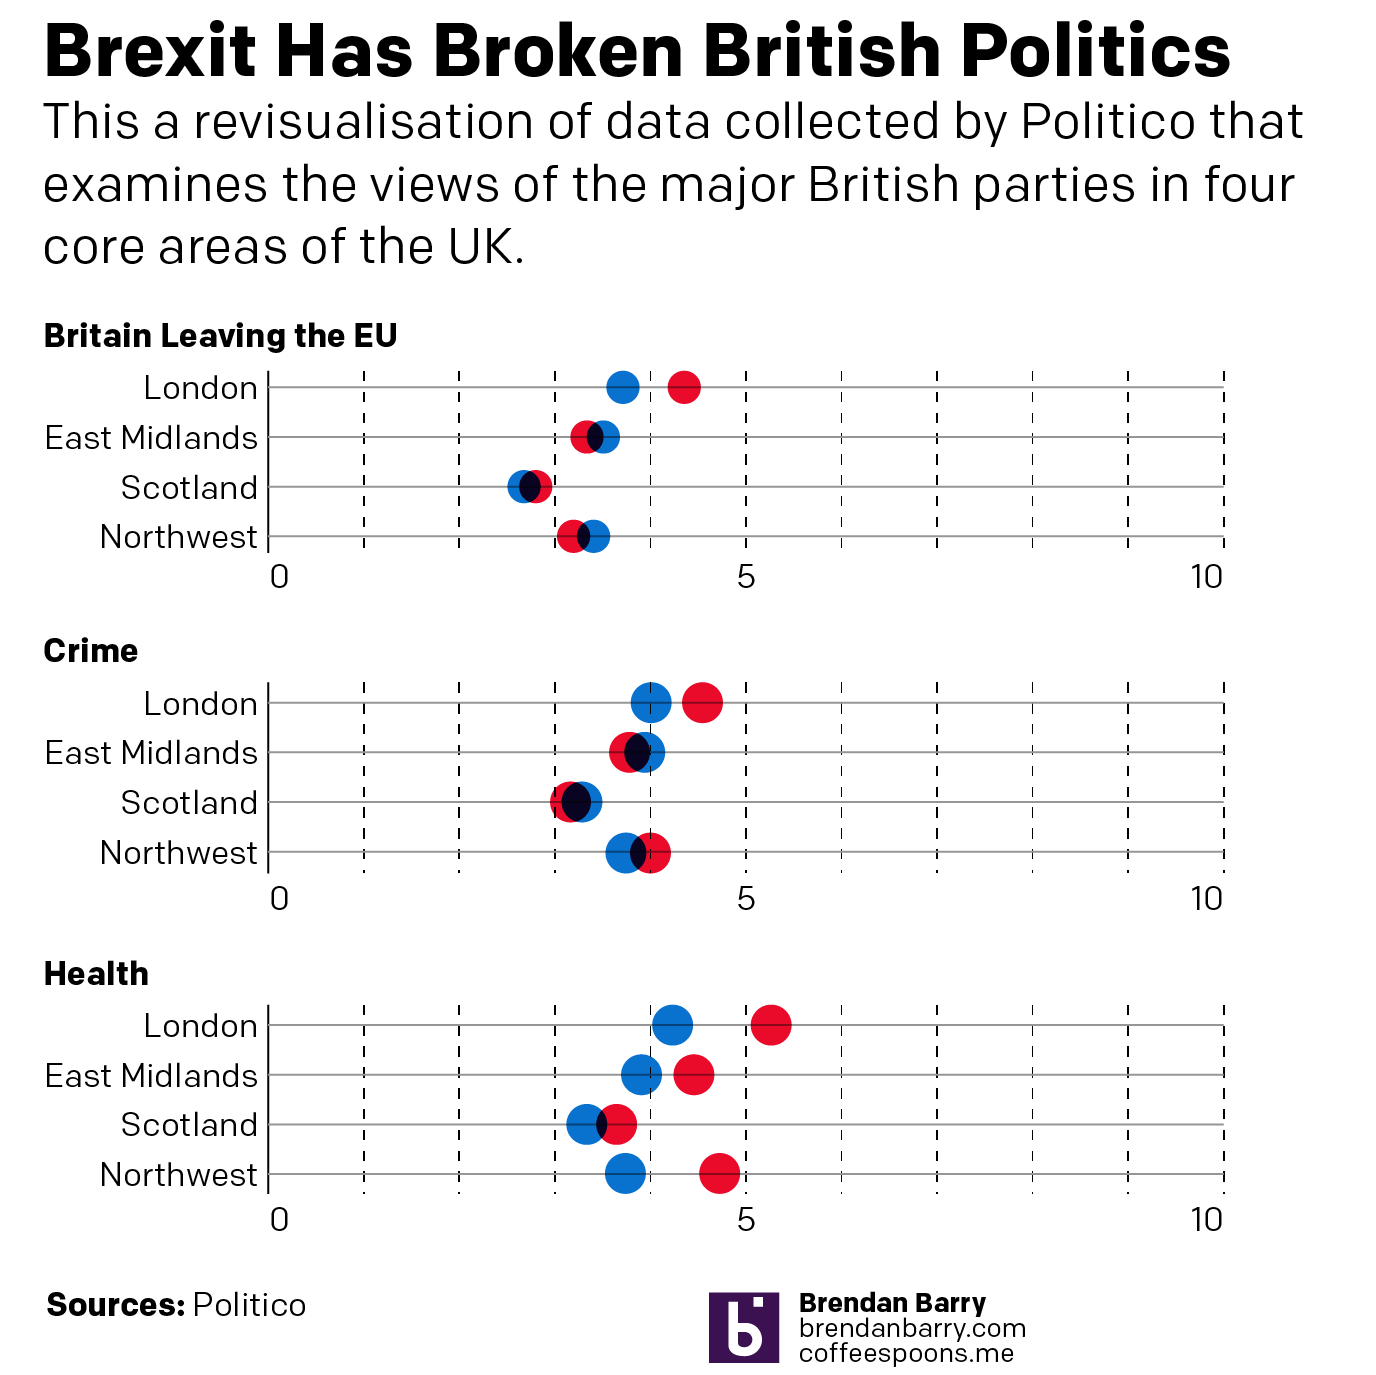
The United Kingdom crashes out of the European Union on Friday. That means there is no deal to safeguard continuity of trading arrangements, healthcare, air traffic control, security and intelligence deals, &c. Oh, and it will likely wreck the economy. No big deal, Theresa. But what do UK voters think about their leading political parties in this climate? Thankfully Politico is starting to collect some survey data from areas of marginal constituencies, what Americans might call battleground districts, ahead of the eventual next election.
And it turns out the Tories aren’t doing well. Though it’s not like Labour is performing any better, because polling indicates the public sees Corbyn as an even worse leader than Theresa May. But this post is more to talk about the visualisation of the results.
Of course I naturally wonder the perception of the smaller parties like the Liberal Democrats or Change UK (the Independent Group)
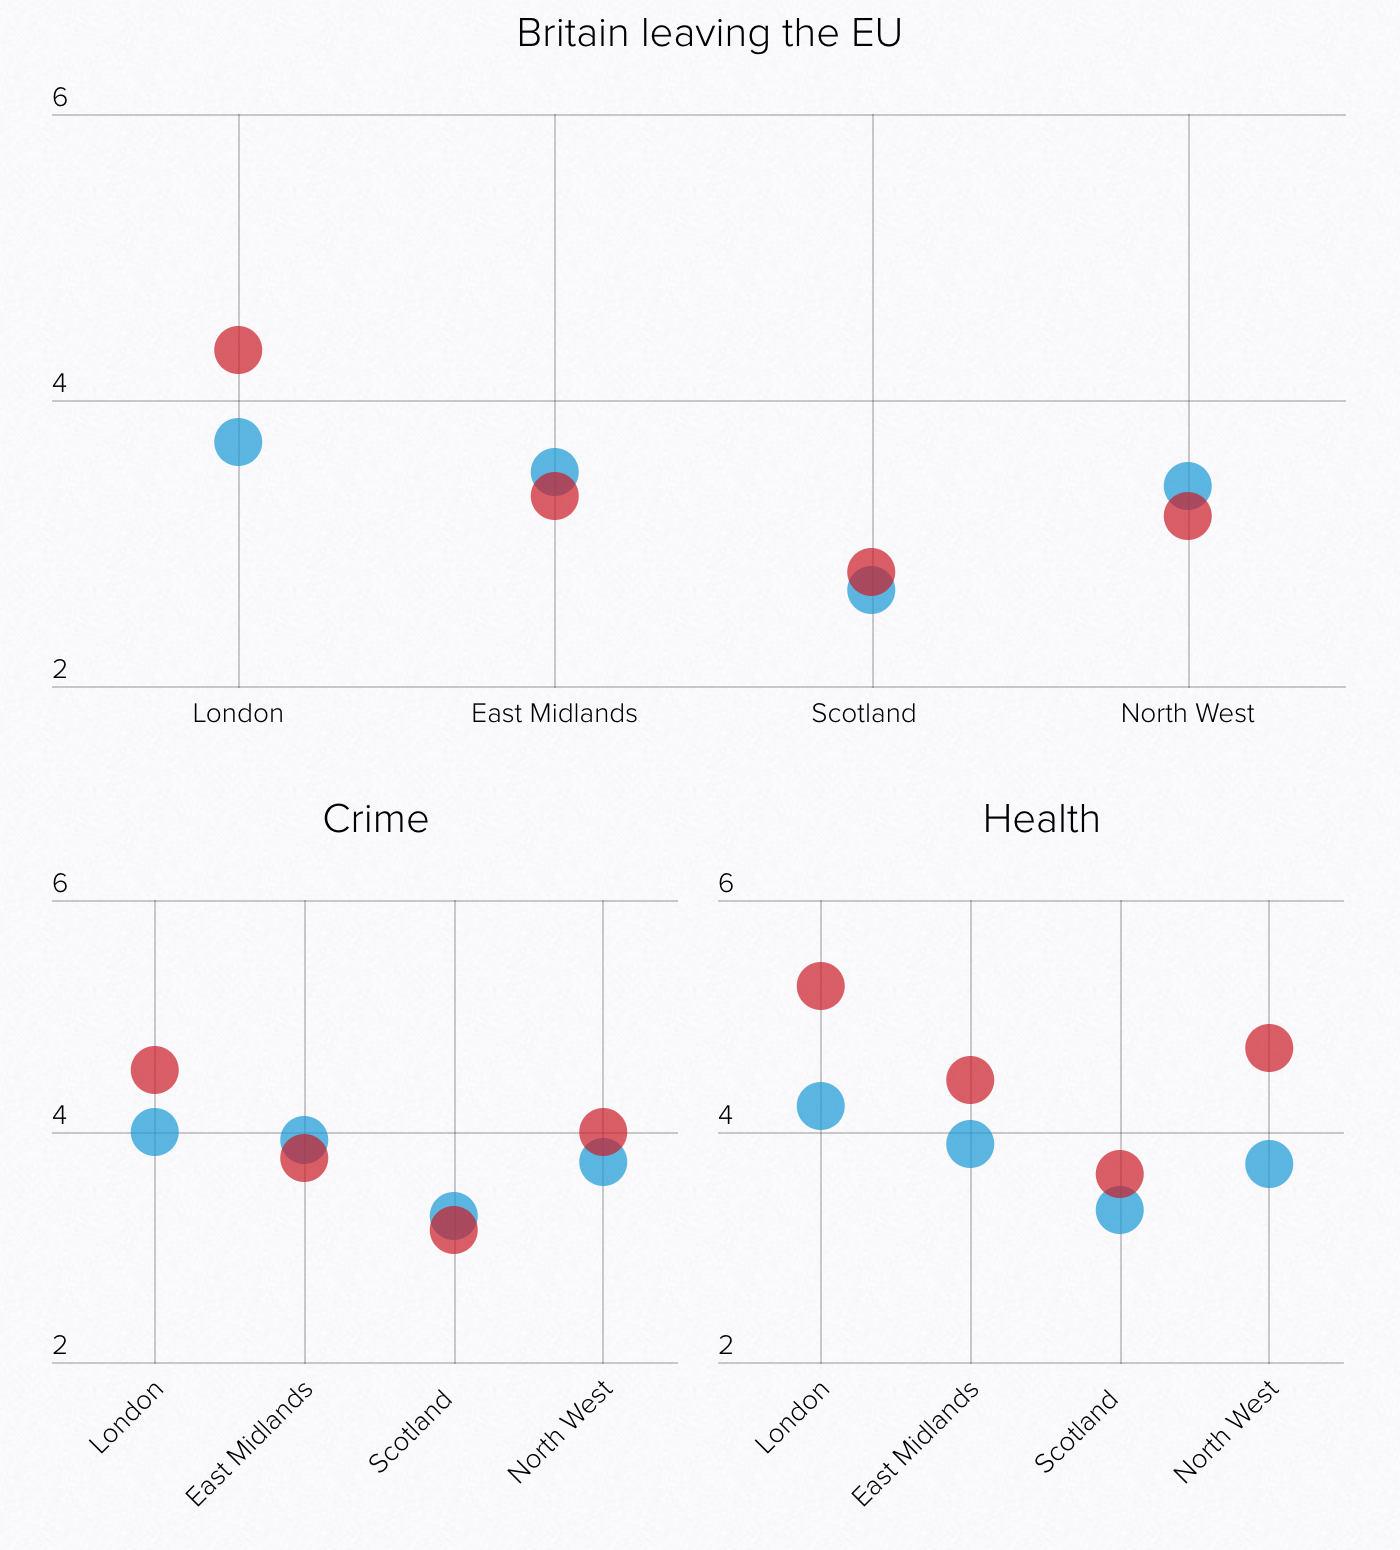
The graphics above are a screenshot where blue represents the Conservatives (Tories) and red Labour. The key thing about these results is that the questions were framed around a 0–10 scale. But look at the axes. Everything looks nice and evenly spread, until you realise the maximum on the y-axis is only six. The minimum is two. It gives the wrong impression that things are spread out neatly around the midpoint, which here appears to be four. But what happens if you plot it on a full axis? Well, the awfulness of the parties becomes more readily apparent.
Neither party looks very good here…
Labour might be scoring around a five on Health, but its score is pretty miserable in these other two categories. And don’t worry, the article has more. But this quick reimagination goes to show you how important placing an axis’ minimum and maximum values can be.
Credit for the piece goes to the Politico graphics department.
For some levity given today is Friday, let us get to the really contentious matters of late. Is the percentage sign acceptable in text? According to the AP, it now is. Thankfully, xkcd was on it and took a look at the acceptability of various forms of expressing a percentage.
For my frequent readers, it will be no big surprise that I am avid supporter of public transit, especially the railways. Consequently I was delighted when I read a non-Brexit piece in the Guardian yesterday that looked at public transit systems in several cities.
But it did so by comparing earlier plans or systems to those in existence today.
That’s definitely one time I’d like to live in the past.
Each design is slightly different and reflects the source material for the various cities. But I naturally selected the Philadelphia map. One of the biggest things to notice are the lack of trams/trolleys north of Girard and the addition of the River Line.
Yesterday I wrote about the failure in a Politico piece to include Alaska and Hawaii in a graphic depicting the “entire” United States. After I had posted it, I recalled an article I read in the Guardian that looked at the shape of the United States, using the term “logo map”. It compared what many would consider the logo map to the actual map of the United States.
Still no New Zealand…
I warn you, it is a long read. But it was worth it to try and reframe the idea of what does the United States look like?
Credit for the piece goes to the Guardian graphics department.
Last month Politico published an article called the Democrats’ Dilemma. It looked at what will likely be the crux of their debate for their 2020 candidates. Go moderate or hard left? The super simple version of the argument is that do you win by persuading independents and moderate Republicans to vote Democratic? Or do you win by ginning up the fervour of your liberal base and drive out the vote?
The article contrasts those approaches by looking at two neighbouring congressional districts. The first was won by Ilhan Omar, a Somali-American woman who has been at the centre of several causes célèbres in recent months. The second was won by a moderate, wealthy white man who has not really attracted any attention whatsoever.
But I don’t want to talk about the merits of either representative nor the fascinating split the article discusses. Instead, I want to look at a little piece of the graphics used in the article. It uses some simple stacked bar charts to compare and contrast the demographics of the representatives’ districts. Notably, they are different. But it goes on to compare and contrast them to the overall United States.
But what about New Zealand?
The first thing, I probably would have angled Mr. Phillips’ head so his head is straight, but that is a minor detail. The other thing I immediately noticed is a big pet peeve of mine. For the “Entire United States”, we have a map of the United States. Or do we?
What is missing? The entire states of Alaska and Hawaii, that’s what. I can understand not including Puerto Rico or other insular territories like the U.S. Virgin Islands because they are either not states or so small they would not appear visible at such a scale. However, Alaska and Hawaii are both integral parts of the United States. They are not marginal, like former Attorney General Jeff Sessions’ infamous quip about Hawaii being “some island in the Pacific”.
Perhaps at the above scale, Hawaii would be too small to appear—though I doubt it. But what about Alaska? It is the largest state. And Texas isn’t even a close second. So why is Alaska not included? Unfortunately—though fortunately for Politico, whose work I generally like—this is not a problem specific to Politico.
Even my own employer, the Federal Reserve Bank of Philadelphia, gets it wrong. One of their interactive data visualisation pieces, which for the record my team had nothing to do with, also completely omits Alaska and Hawaii in their map of the United States. And it’s a far larger map with ample space.
Still no New Zealand…
Including Alaska and Hawaii should not be afterthoughts. They are not second-class states. They are full constituent parts of the union. And if it is not easy to include them because they are not contiguous nor sharing the same continent, that should not obviate designers from including them in the United States.
Credit for the piece goes to the Politico’s design department and the Philadelphia Fed’s design department.
It is Monday, so it must be another Brexit vote day. And today we have Indicative Vote Day 2. If you recall from last week, the House of Commons wrestled control over parliamentary business away from the government and created a two-step process to try and see if any alternative to Theresa May’s Brexit plan can receive a workable, sustainable majority in the House.
The first step went about as well as could be expected. Nothing received a majority, but a customs union and a confirmatory vote by the public on the final deal both came very close to a majority: 8 and 27 votes, respectively. Likely, the vote today will be on those options.
But one reason for this lack of majority is that the idea of Europe has always fractured the Conservative Party. And in a recent piece by the Economist, we can see just how fractured the Tories have become.
The Tories are all over the plot
Maybe a little bit counterintuitively, this plot does not look at an MP’s opinion on Brexit, but just with whom they are more likely to vote. The clearest takeaway is that whilst Labour remains relatively united, the Tories are in a small little divisions across the field.
In terms of design, there is not much to comment upon. It is not a scatter plot in terms of the placement of the dots does not refer to Brexit opinions, as I mentioned. It is more about the groupings of MPs. And in that sense, this does its job.
Credit for the piece goes to the Economist Data Team.
Information design has largely settled on a few key forms to communicate data. One is the error bar. But xkcd explores what can happen when we take error bars…to infinity.