Piece, Larsen C

When I was in high school in 2002, it was big news when one of the three Larsen ice shelves in Antarctica, Larsen B, collapsed. And then when I was at university, the band British Sea Power wrote a song titled “Oh Larsen B” that I have always enjoyed.

Now Larsen B was not the first Larsen ice shelf to collapse. That dubious honour belongs to Larsen A, which collapsed in 1995. But, Larsen B will not be the last as the third, Larsen C, is now on the verge of collapse. This graphic from Adrian Luckman, reproduced by the BBC, illustrates how the rift calving the shelf has seen accelerated growth recently.
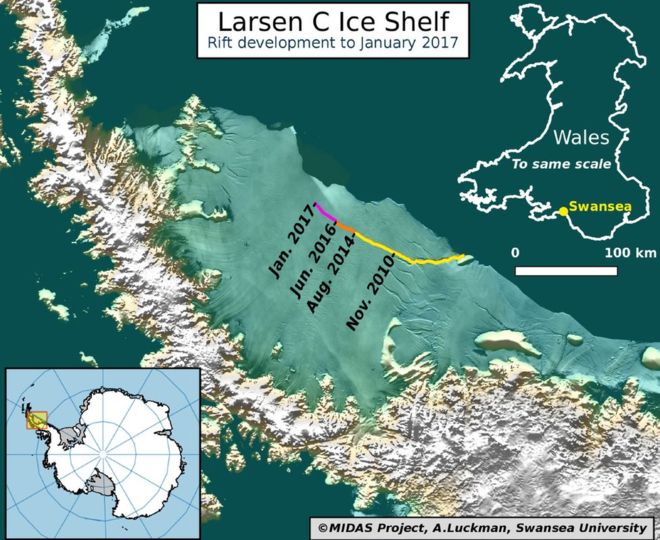
The rift's growth has accelerated lately
The rift’s growth has accelerated lately

I believe the colours could have been designed a bit better to show more of the acceleration. The purple fades too far into the background and the yellow stands out too much. I would be curious if the data existed to create a chart showing the acceleration.

The inclusion of the map of Wales works well for showing the scale, especially for British audiences. In other words, an iceberg 1/4 the size of Wales will be released into the Southern Ocean. For those not well versed in British geography, that means an iceberg larger than the size of Delaware. That’s a big iceberg.

Credit for the piece goes to Adrian Luckman.

Climate Change

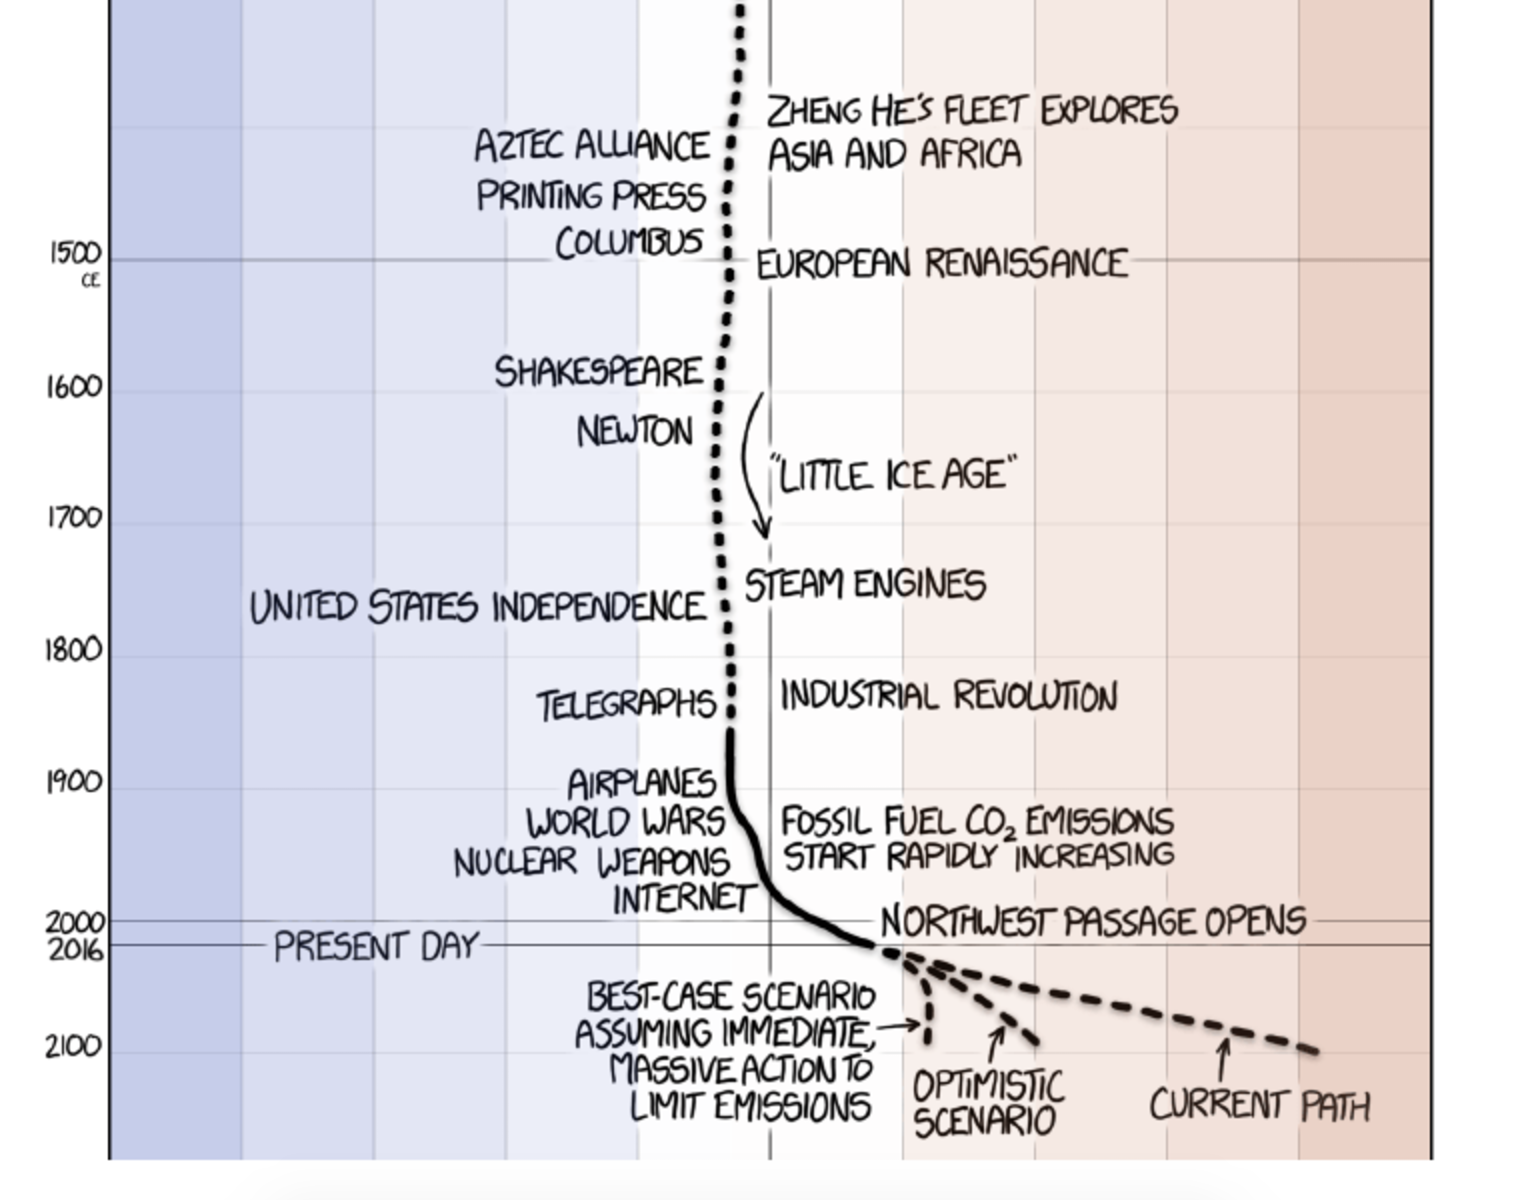
So this is the last Friday before the election next Tuesday. Normally I reserve Fridays for less serious topics. And often xkcd does a great job covering that for me. But because of the election, I want today’s to be a bit more serious. Thankfully, we still have xkcd for that.

Recent temperature history

The screenshot above gets to the point. But the whole piece is worth a scroll-through and so it goes at the end. Credit for the piece goes to Randall Munroe.

Earth's global average temperature
Earth’s global average temperature

Raining Maps Monday

One of the things I like about Chicago’s WGN network is its weather blog. They often include infographic-like content to explain weather trends or stories. But as someone working in the same field of data visualisation and information design, I sometimes find myself truly confused. That happened with this piece last Friday.

Pay attention to the map in the upper-right

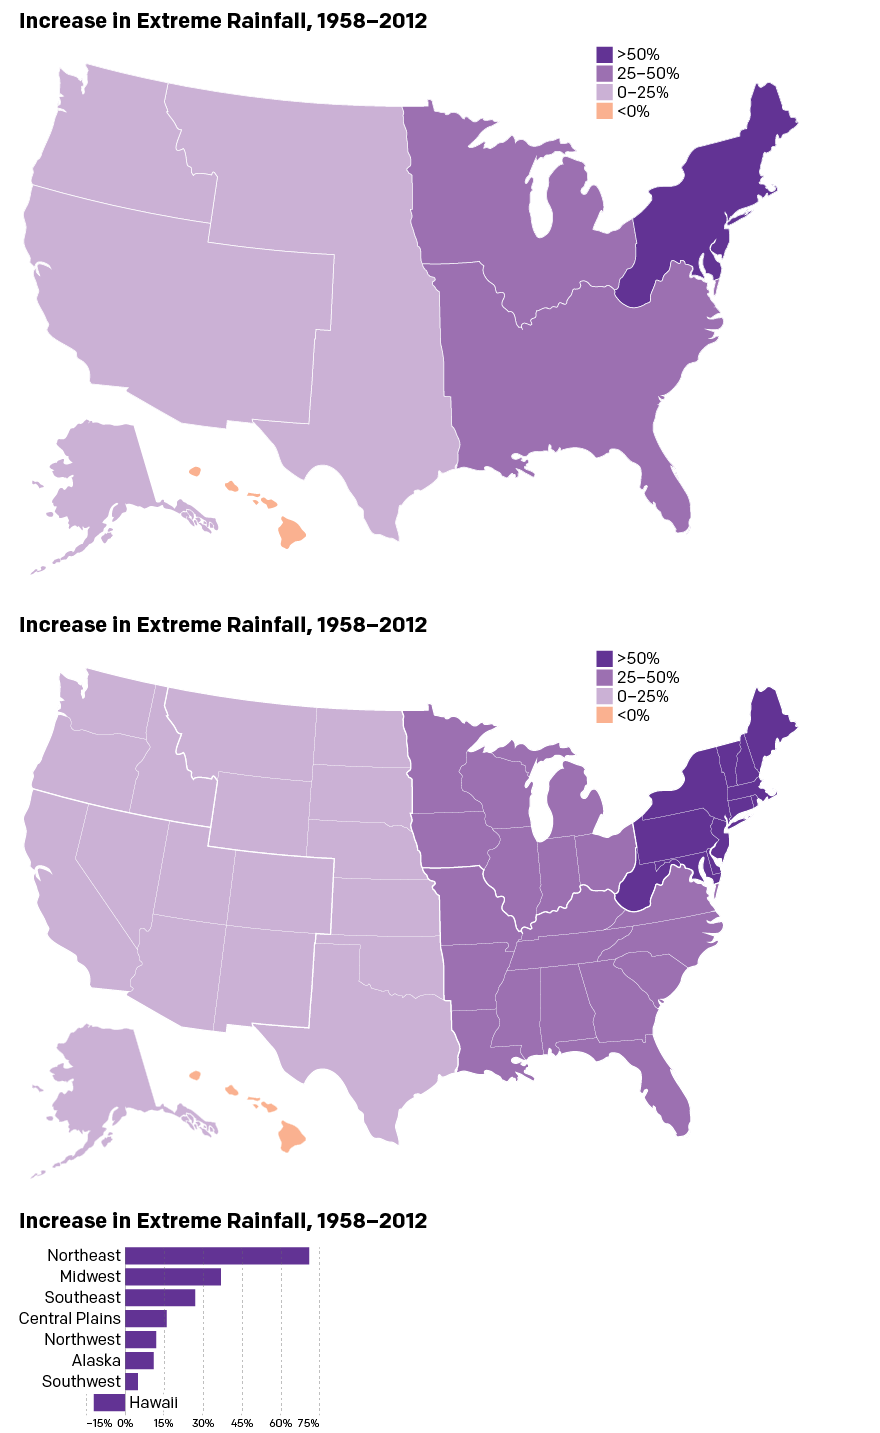
The map in the upper-right in particular caught my attention and not in the good way. The overall piece discusses the heavy rainfall in the Chicago area on Thursday and the map looks at the percentage increase in extreme weather rainfall precipitation. All so far so good. But then I look at the map itself. I see blue and thing blue > water > rainfall. The darker/more the blue, the greater the increase. But, no—check out Hawaii. So blue means less rainfall. But also no, look at the Midwest and Southeast. So does green mean anything? Beyond being all positive growth, not that I can tell. As best I can tell, the colour means nothing in terms of rainfall data, but instead delineates the regions of the United States—noting of course they are not the standard US Census Bureau regions.

So here is my quick stab at trying to create a map that explains the percentage growth. I have included a version with and without state borders to help readers distinguish between states and regions.

My take on the map
My take on the map

And what is that at the bottom? A bar chart of course. After all, with only eight regions, is a map truly necessary especially when shown at such an aggregate level? You can make the argument that the extreme rainfall has, broadly speaking, benefitted the eastern half of the United States. But, personally speaking, I would prefer a map for a more granular set of data at the state or municipality level.

Credit for the piece goes to Jennifer Kohnke and Drew Narsutis.

Climate Change in Charts

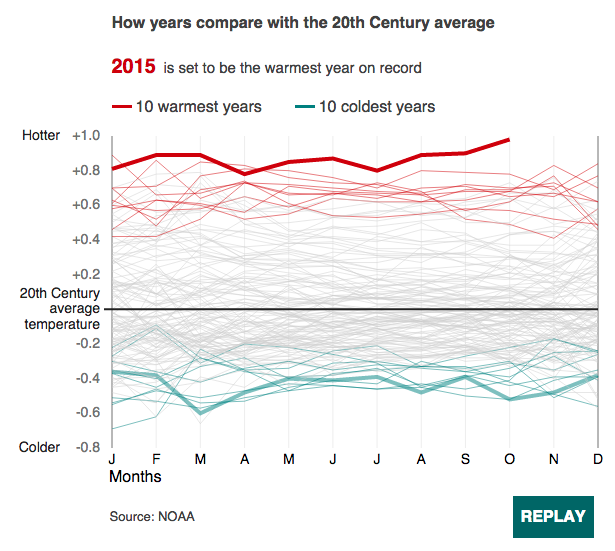
So yesterday we reimagined a less-than-stellar BBC chart. Today, we look at a good chart from the BBC about climate change, timed to coincide with the start of the Paris climate talks. This comes from an article with six charts related to climate change, but it is the best in my mind.

The trend…not so good.

Nothing but nice design here with the use of colour to highlight the top ten hottest and coldest years over the last 225+ years. But it really comes alive when animated and tells the story how those coldest years occurred at the beginning of the set and the hottest are among the most recent years.

Credit for the piece goes to Emily Maguire,  Tom Nurse, Steven Connor, and Punit Shah.

The Future of Climate Change

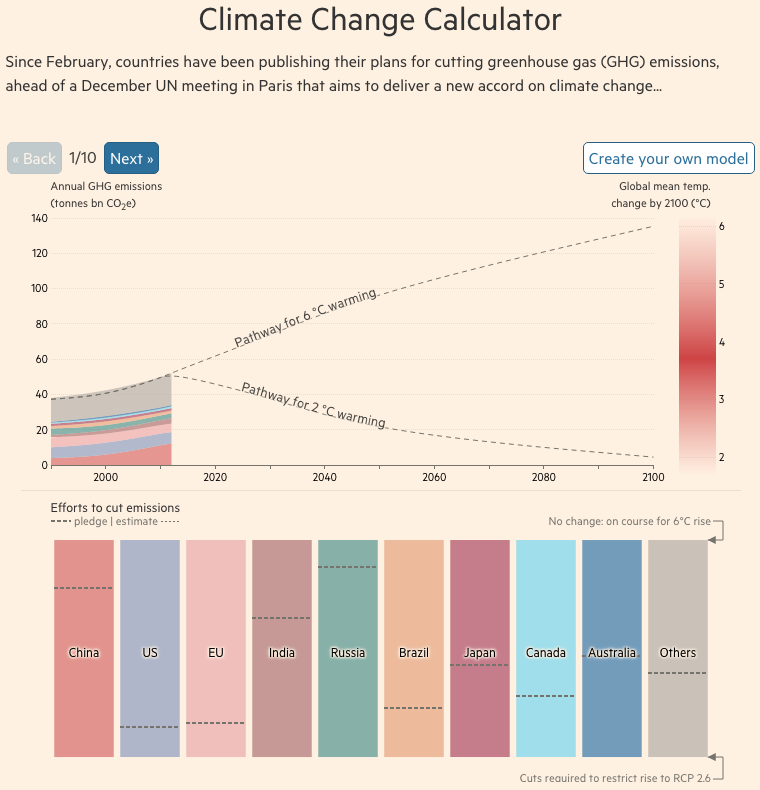
At the end of the month the world will gather in Paris, France for the next round of climate change talks. In advance of the talks, the Financial Times put together this model of how emissions reductions will help—or not—get climate change under control. The piece is two-fold. The first is a ten-step narrative that showcases the tool’s split of the time series into short-, medium-, and long-term impacts and how those work in the best and worst case scenarios. But it then allows the user to jump right on in and create their own scenarios.

Is it getting hot out there?

Credit for the piece goes to John Burn-Murdoch and Pilita Clark.

Water Level on Lake Michigan

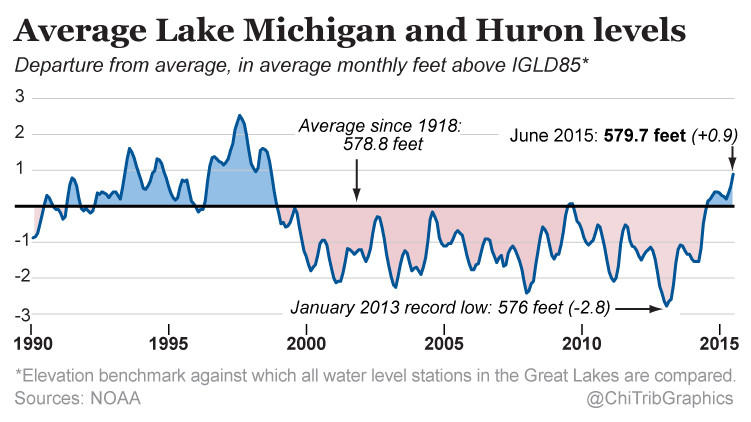
Today’s a little piece for those of you who follow me from the Chicago area. It turns out that in the last 30 months, the water level of Lake Michigan has risen three feet. Despite what some people think, Lake Michigan is not an ocean—I have overheard conversations in my neighbourhood about people who went “swimming in the ocean today” and want to show them a map that points out the Atlantic is almost a thousand miles away—and is not under the same threat as the coast via melting icecaps. The Great Lakes are instead impacted by other regional and cyclical patterns, e.g. El Niño. This article by the Chicago Tribune makes use of this small but clear line chart in its discussion of those very factors.

Water levels for Lakes Michigan and Huron

Credit for the piece goes to the Chicago Tribune’s graphics department.

It’s Melting! It’s Melting!

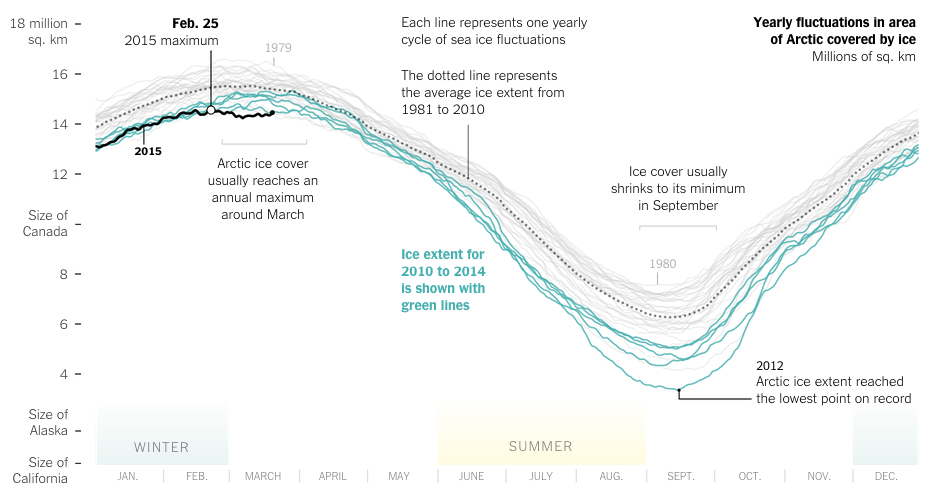
Spring has finally arrived. And that means that far to your humble author’s north, the sea ice in the Arctic is beginning to recede from its annual maximum coverage. However, this year’s coverage was the smallest since satellite records began in 1979. The New York Times covers the story in a nice article with two big data pieces. The first is a really nice map—not shown—that looks at this year’s coverage compared to average extents.

The really nice part, however, is a line chart of historical ice coverage from 1979 through to the current date. While the piece is not interactive, the annotations in the graphic do a nice job explaining the different lines and outliers. Overall, a solid piece.

Annual cycle of Arctic ice coverage

Credit for the piece goes to Derek Watkins.

When the Baltimore Oriole Abandons Baltimore

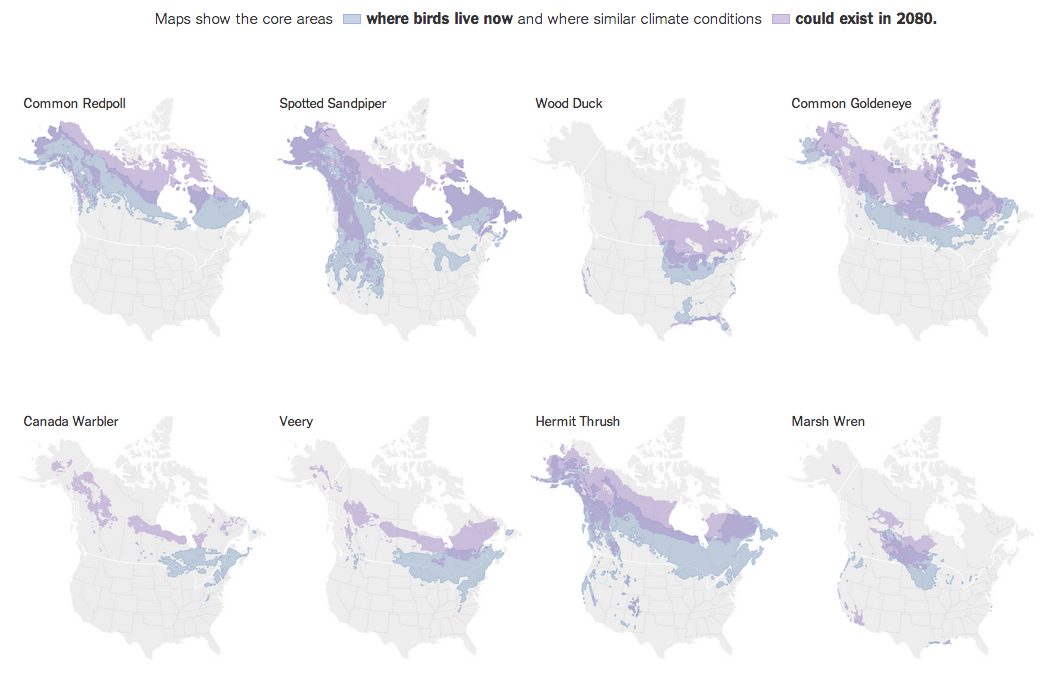
Climate change has more of an impact than just extreme weather. For one, not all weather will necessarily be warmer. Two, animals and plants will be affected in terms of their natural habitat. The New York Times recently put together a piece about the impact of climate change upon birds. And it turns out that in less than a century, it is projected that the Baltimore Oriole will no longer find its preferred climate in Baltimore, but rather further north.

Where the birds are and aren't
Where the birds are and aren’t

Credit for the piece goes to K.K. Rebecca Lai, Larry Buchanan, and Derek Watkins.

Impact of Climate Change

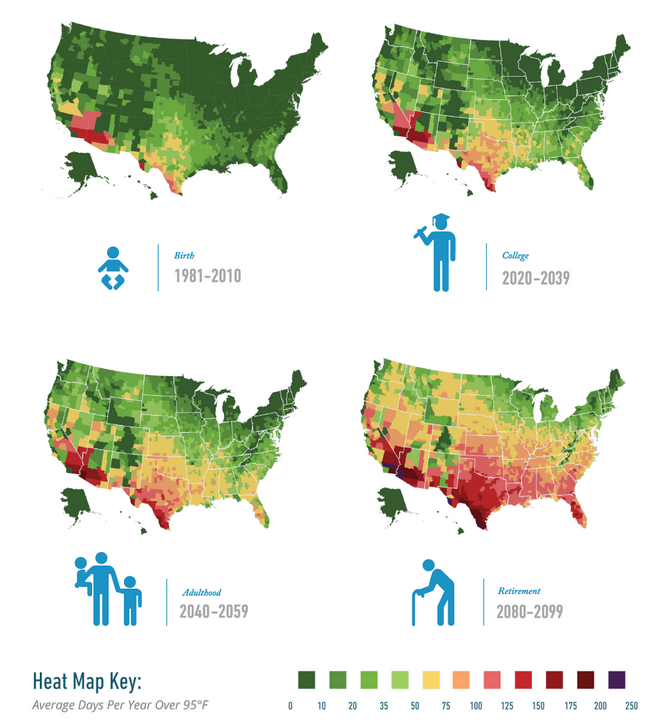
As someone who likes cooler weather, climate change sucks. Because that generally means warmer weather. Yes, yes, I know it means equally good chances for extreme cold temperatures and in general more extreme weather, but mostly I hate hot weather. So a new report by Risky Business Project, a group led by former New York mayor Michael Bloomberg, Henry Paulson, and Tom Steyer, looks to quantify some of the impact.

But in short, nothing good is going to happen. And basically, I will never move to the South.

Impact of climate change

Credit for the piece goes to the graphics team behind Risky Business.

Carbon Emissions

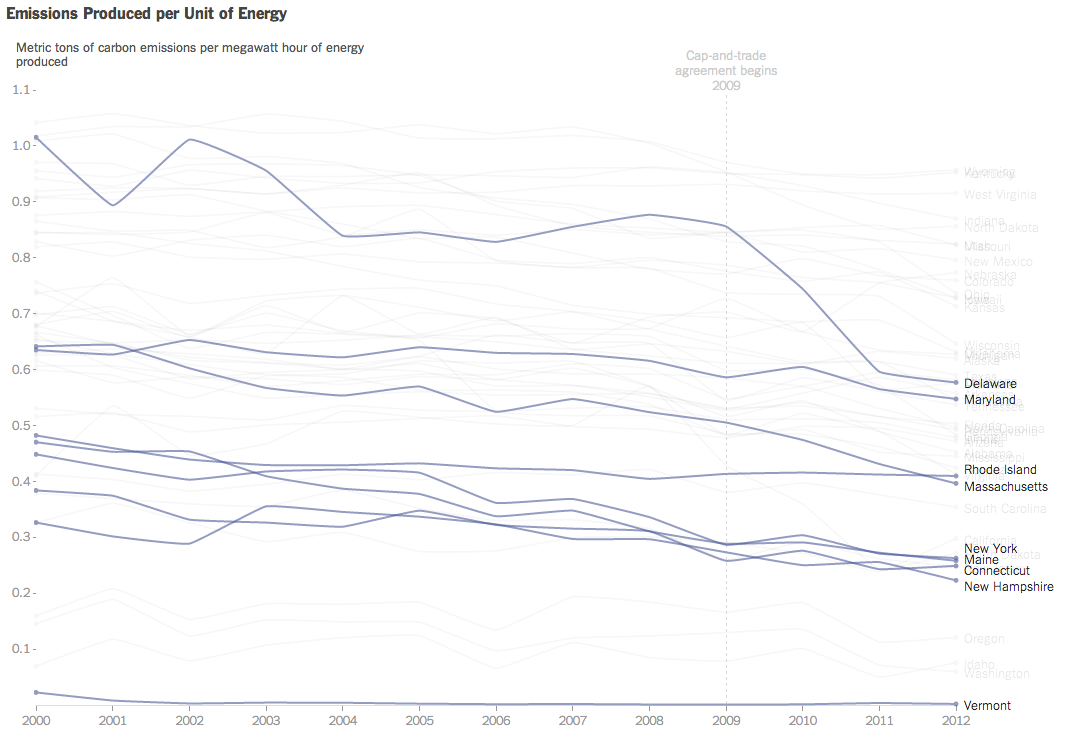
President Obama announced new regulations to be enforced by the EPA that aim to reduce carbon emissions. Principally, the expected reduction will come through state-by-state measures to meet new federally mandated targets. Each state will have the ability to find different means of achieving the cuts, e.g. building more solar plants or nuclear plants or implementing cap-and-trade schemes.

Consequently, the New York Times published this interactive graphic that examines the carbon emissions and energy prices of states. The charts default to a highlight of several Northeast states already participating in a cap-and-trade scheme. The top component charts emissions on a per unit of energy over time while the bottom charts the price of energy.

Carbon emissions over time

Credit for the piece goes to Hannah Fairfield and Derek Watkins.