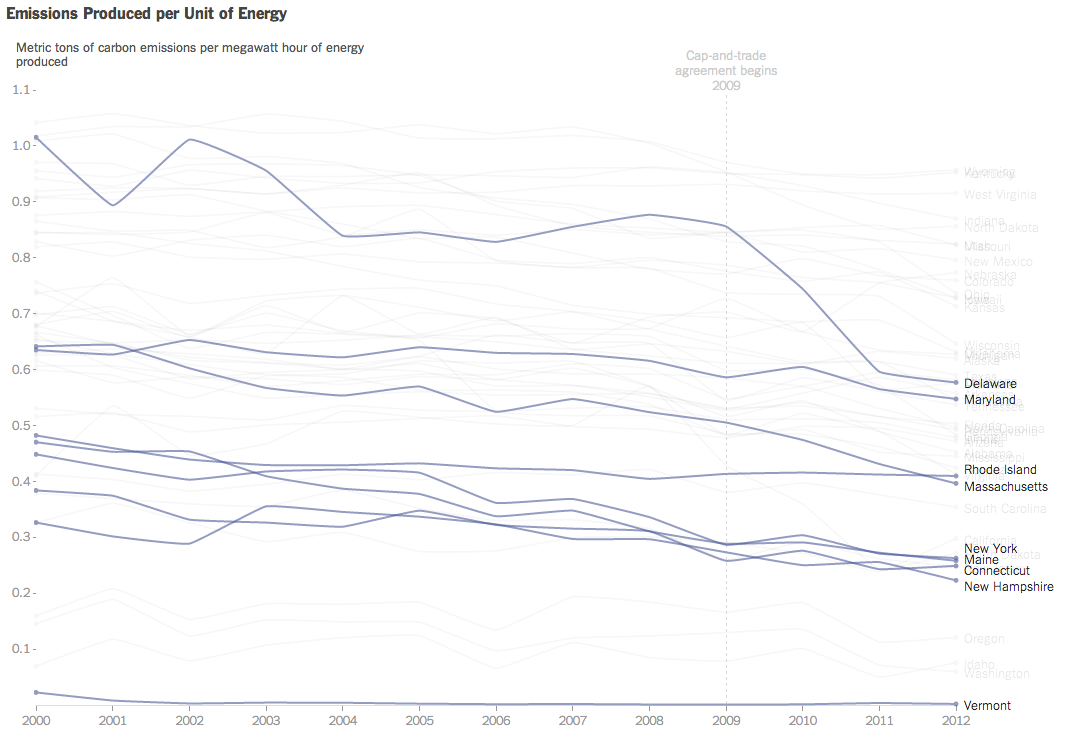
President Obama announced new regulations to be enforced by the EPA that aim to reduce carbon emissions. Principally, the expected reduction will come through state-by-state measures to meet new federally mandated targets. Each state will have the ability to find different means of achieving the cuts, e.g. building more solar plants or nuclear plants or implementing cap-and-trade schemes.
Consequently, the New York Times published this interactive graphic that examines the carbon emissions and energy prices of states. The charts default to a highlight of several Northeast states already participating in a cap-and-trade scheme. The top component charts emissions on a per unit of energy over time while the bottom charts the price of energy.

Credit for the piece goes to Hannah Fairfield and Derek Watkins.
