The Science of Cherry Blossoms

The Washington Post explains the science—or is it art—of the cherry blossom in D.C. though an illustrated video. Certainly this is literally more illustrative in concept than some other posts here, but the illustrations nonetheless match the audio explanations and parallel nicely with the aesthetic qualities of the cherry trees.

the early stages
the early stages
along the tidal basin

Drawings by Patterson Clark and narration by AJ Chavar.

Heritage Maps

From FlowingData comes a post to an interactive piece by Bloomberg that looks at the geographic distribution of different heritage—read heritage, neither race nor ethnicity—groups. (Its choice of groups, however, is slightly contentious as it omits several important ones, including African-Americans.)

I would say that a typical map like this would simply plot the percent of each county, state, or other sub-division for the selected heritage group. Much like below, as I chose the Irish.

Irish heritage
Irish heritage

Bloomberg’s piece is a bit more interesting than that because of the ability to compare two groups, to see where they overlap and where they diverge. In doing so, they created a divergent choropleth that can show the subtleties and nuances of settlement patterns.

Irish vs German
Irish vs German

Credit for the piece goes to David Yanofsky.

Bringing 19th Century Mapping Techniques to the 21st Century

Charles Booth was a 19th century social scientist living in Britain. He famously investigated poverty and mapped out which parts of London were teeming with vicious, lower-class criminals or well-to-do upper class folks. Today, one might use a simple choropleth style to paint whole swathes of London by postal districts or constituencies or some such. But, Booth went street-by-street and house-by-house colouring blocks of London’s residential areas until he arrived at a map far more complex—and thus ultimately more telling—of the intricacies of London’s social structure.

from Booth's original map

Oliver O’Brien has created a modern take on Booth’s approach to investigate the housing demographics of the UK, which ignores the large areas of the British countryside that are devoid of homes and thus focuses on the denser residential areas of the UK’s major cities.

Eastern London
Eastern London
Barking and Dagenham

Censuses seem to be a natural dataset for such work, but I wonder if in the future we will be able to apply such data visualisations to other geographically-tied data.

Busting Bunkers

There is quite a lot of talk these days about the possibility of Israel, either with or without American assistance, launching an attack on Iran to halt the further development of its nuclear programme. The trouble is that Israel may not have the weapons necessary to carry out a successful attack, but the US has quite the arsenal. And one of the most useful, for just such a task is the Massive Ordnance Penetrator.

The National Post created an infographic to look at the bomb and just how it might be used if the US should decide to use it.

Bomb options
Bomb options

Credit for the piece goes to Mike Faille and Richard Johnson.

Senate Polarity

Earlier this month I posted about how the New York Times looked at the polarisation of the US Senate. Now the National Journal has another, similar visualisation attempting to explain the political gridlock that was picked up by the Atlantic.

Senate Polarity
Senate Polarity

For those wondering, the National Journal ranks senators on their conservativeness–liberalness by their votes and that is the plotted data.

Credit for the piece goes to the National Journal.

How Popular Is Your Home State?

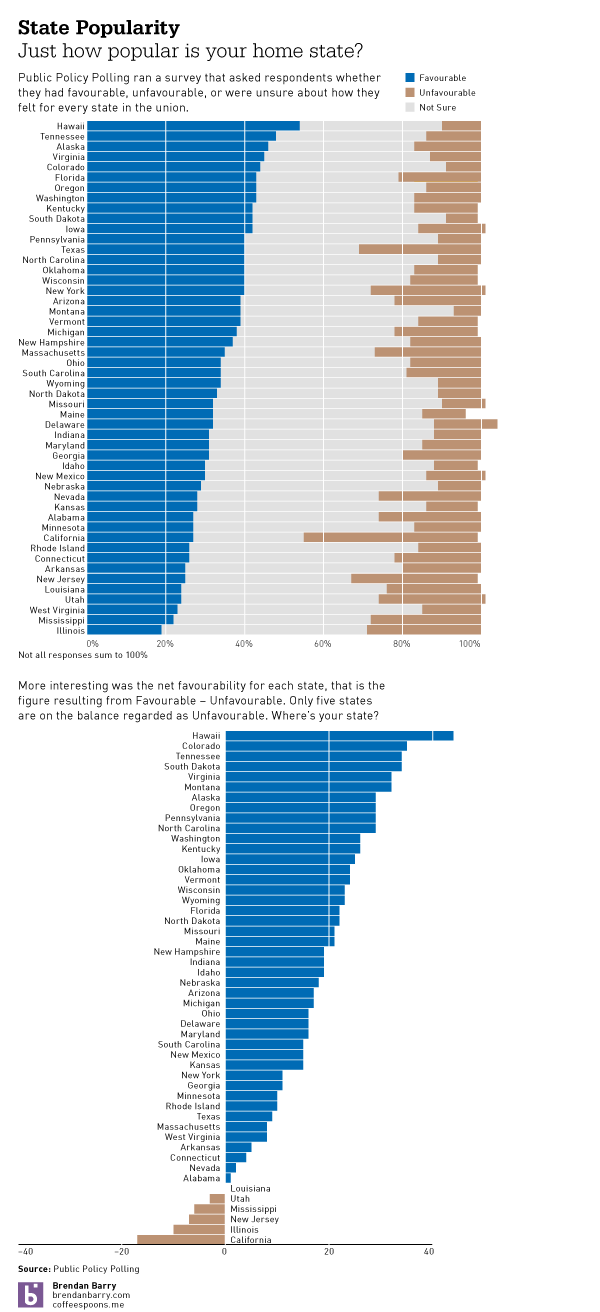
Public Policy Polling had a survey in February where they polled respondents on whether they had favourable or unfavourable attitudes towards states, or if they were not sure. As a Pennsylvania transplant to Illinois, I can say that Pennsylvania came out a bit better than Illinois. But how about your state?

State Popularity
State Popularity

A Not So Smart Smartphone Chart

This piece in the Globe and Mail of Toronto looks at smartphone usage by operating system through a comparison of Canada to both the United States and Japan.

Smartphone use in Canada

While I understand the need for aesthetic distinction from having an entire page of bar charts, these ring or donut charts are a touch misleading. Because of the space between rings, the radius of each circle from the central Android icon is significantly increased. This of course proportionally scales up the length of each segment within the rings. In short, it becomes difficult to compare segments of each ring to the corresponding segments on the other rings without looking at the datapoint. And if you need to look at the datapoint, one could argue that the infographic has failed from the standpoint of communication of the data.

Beneath is the original (with the legend edited to fit into my cropping) with two very simple (and hasty) reproductions of the data as straight pie charts placed next to each other and then as clusters of bar charts grouped beneath each other. I leave it to you the audience to decide which is easiest to decode.

The original ring chart with legend moved
Alternate visualisation types

Credit for the Globe and Mail piece goes to Carrie Cockburn.

Delivery Routes

Sunday in the New York Times, an article on bicycle delivery had an accompanying infographic. It detailed the dinner route of the article’s main individual. The piece is an interesting use of small multiples to provide a timeline of a route, while each new delivery maintains the old paths for reference. And from a data perspective, I found it good to acknowledge the one instant where the follower lost contact with the delivery man.

Delivery routes
Delivery routes

Politics Moves Further to the Extremes

In case you were wondering, yes, Virginia, politics in the United States are becoming more polarised. Olympia Snowe, the moderate Republican senator from Maine, is not running for re-election. And so the Senate is left without one more centrist counterweight to an extreme. To try and show how extreme, this graphic from the New York Times plots how often senators voted with their party.

Senators voting with their party

While the chart does not have a marker for the average of each Congress, everyone can see the general trend line. Up. And up means less compromise. And less compromise means getting less done.