Brexit Trilemma Update

This week is the Conservative Party Conference in Manchester where the Tories unveil their government programmes and platforms. Naturally it has been overshadowed by allegations that Boris Johnson groped one (maybe two) reporters at a dinner in 1999. Just prior to that scandal, however, there was another. In this, Johnson was allegedly having an affair with an American businesswoman for whom he then arranged lucrative business deals whilst in office as the Mayor of London. Johnson has been referred to a police unit for further investigation in that matter. Sounds like some, you might say, golden parallels to…someone or something.

But today’s big news about the government’s plans is that they might have one regarding Brexit. And that plan is to essentially create a hard border between Northern Ireland and Ireland, violating certainly the spirit if not the letter of the Good Friday Agreement that brought the end to the Troubles.

Why is this a big deal? Well, one, remember all the debates during the Brexit Referendum campaign about the Irish border, how the different groups had different solutions to this fundamental problem?

Oh wait, yeah, nobody ever brought this up. Sorry.

So back to my trilemma graphic. I’ve updated it to show which two sides of the triangle Boris Johnson seems to be choosing. To be fair, as I’ve said many times, the UK cannot have all three points of the triangle. They need to pick two. And so, unlike Theresa May, Johnson is at least picking two. My problem is that this was never discussed during the Brexit debates and it seems a rather drastic decision to not have it be confirmed by the people since they never explicitly voted on it.
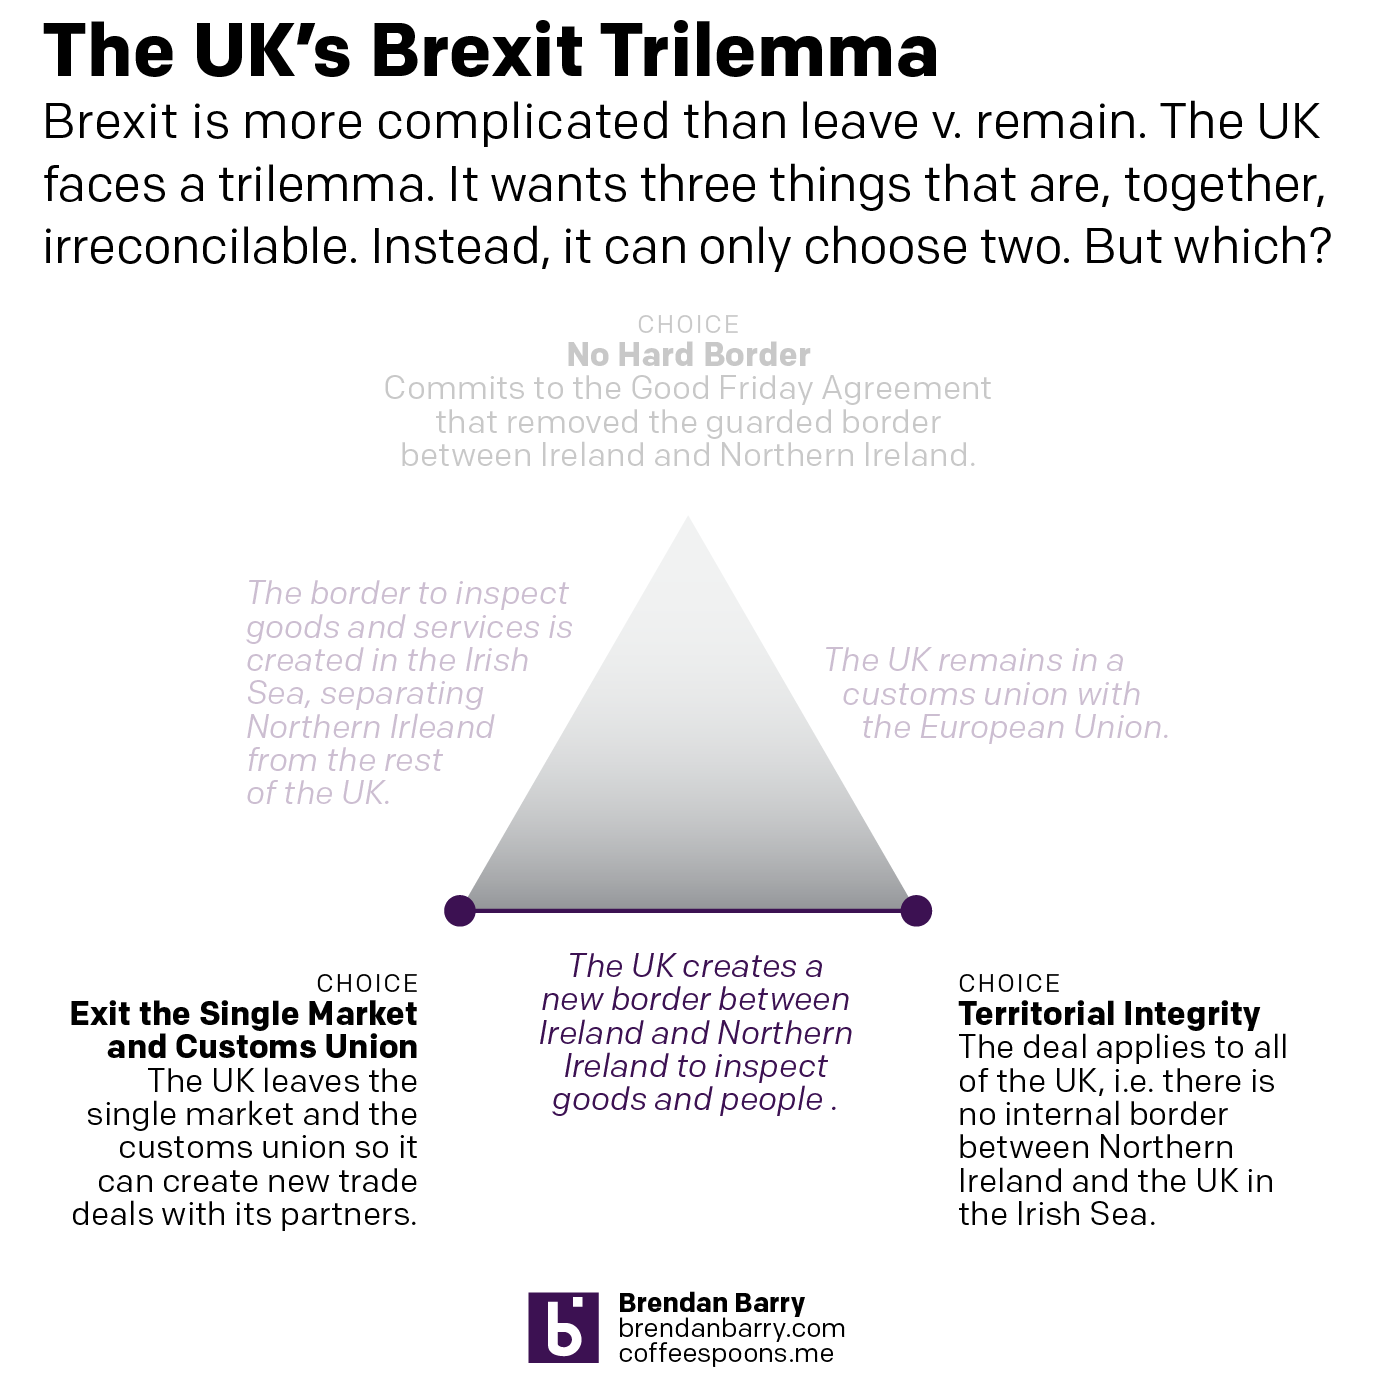
You may not like it, but at least Johnson is picking sides…

Credit for the graphic is mine.
Brexit Crazyness Continues

The British Supreme Court ruled today that Boris Johnson unlawfully advised the Queen to prorogue Parliament. And because the advice was unlawful, the act was therefore unlawful. And because the act was unlawful, the effects of said act were unlawful. And because the effects were unlawful, said effects are null and void. So, you know, prorogation never happened.

So the Prime Minister has misled the Queen. He has failed to pass all but one bill in Parliament (it was a bill for the restoration of the Palace of Westminster totally unrelated to Brexit). He lost three seats, one via a by-election and two by defecting MPs. And then he purged 21 MPs from his party to completely obliterate his working majority. In any other year, this would be cause for the immediate resignation of the Prime Minister. Instead he is sticking around in New York to give a speech about, what else, Brexit, before flying back to London tonight (Eastern US time).

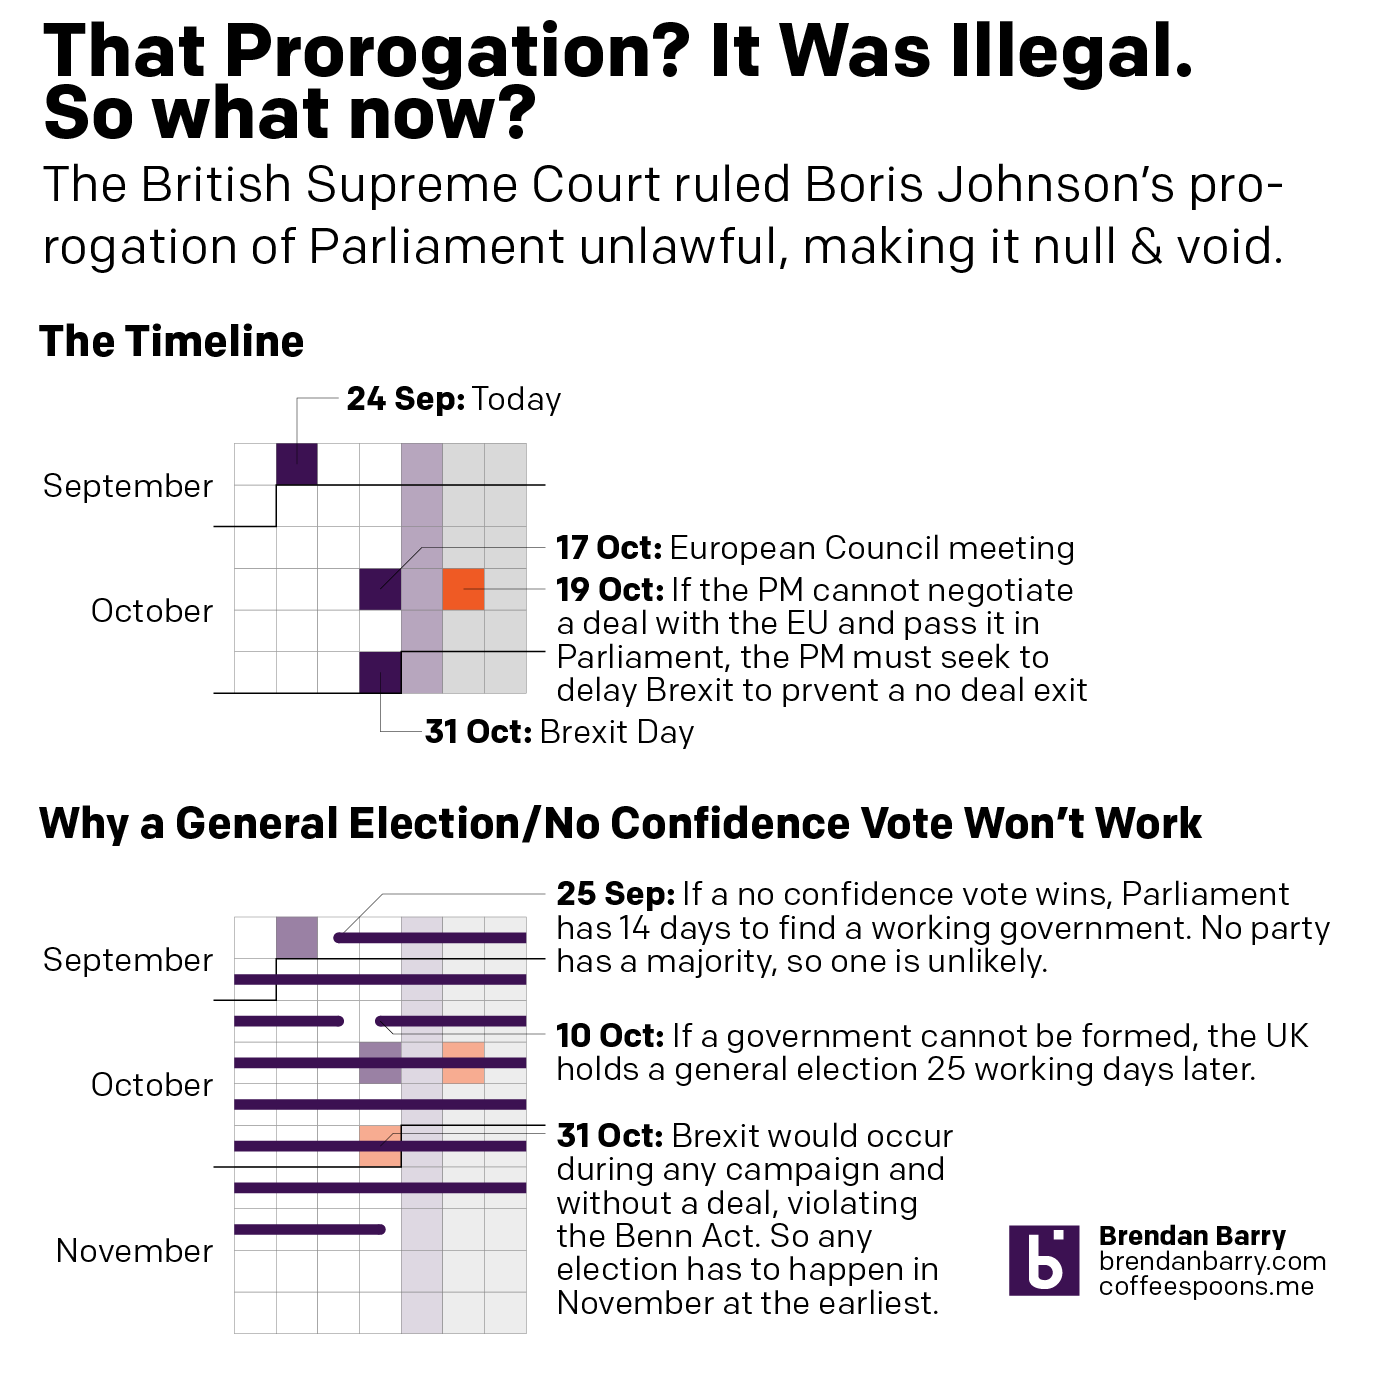
So what’s next? Who really knows. This has never before happened in the history of the United Kingdom. But one possible option is that the opposition parties may hold a no confidence vote. But there will be significant pressure against that, because, as my graphic shows, any election that would likely result, would mean Brexit happening with Parliament dissolved. And that would, ahem, defeat the entire purpose of preventing a No Deal Brexit. Consequently, a no confidence vote or general election is unlikely. (Unless, the opposition and Tory rebels can agree to a non-Jeremy Corbyn caretake prime minister, e.g. Ken Clarke or Margaret Beckett.)

Omnishambles. Even Iannucci couldn't have made this stuff up.
Omnishambles. Even Iannucci couldn’t have made this stuff up.

Regardless, get ready for a crazy day of Parliamentary procedure tomorrow.

Prorogation of Parliament

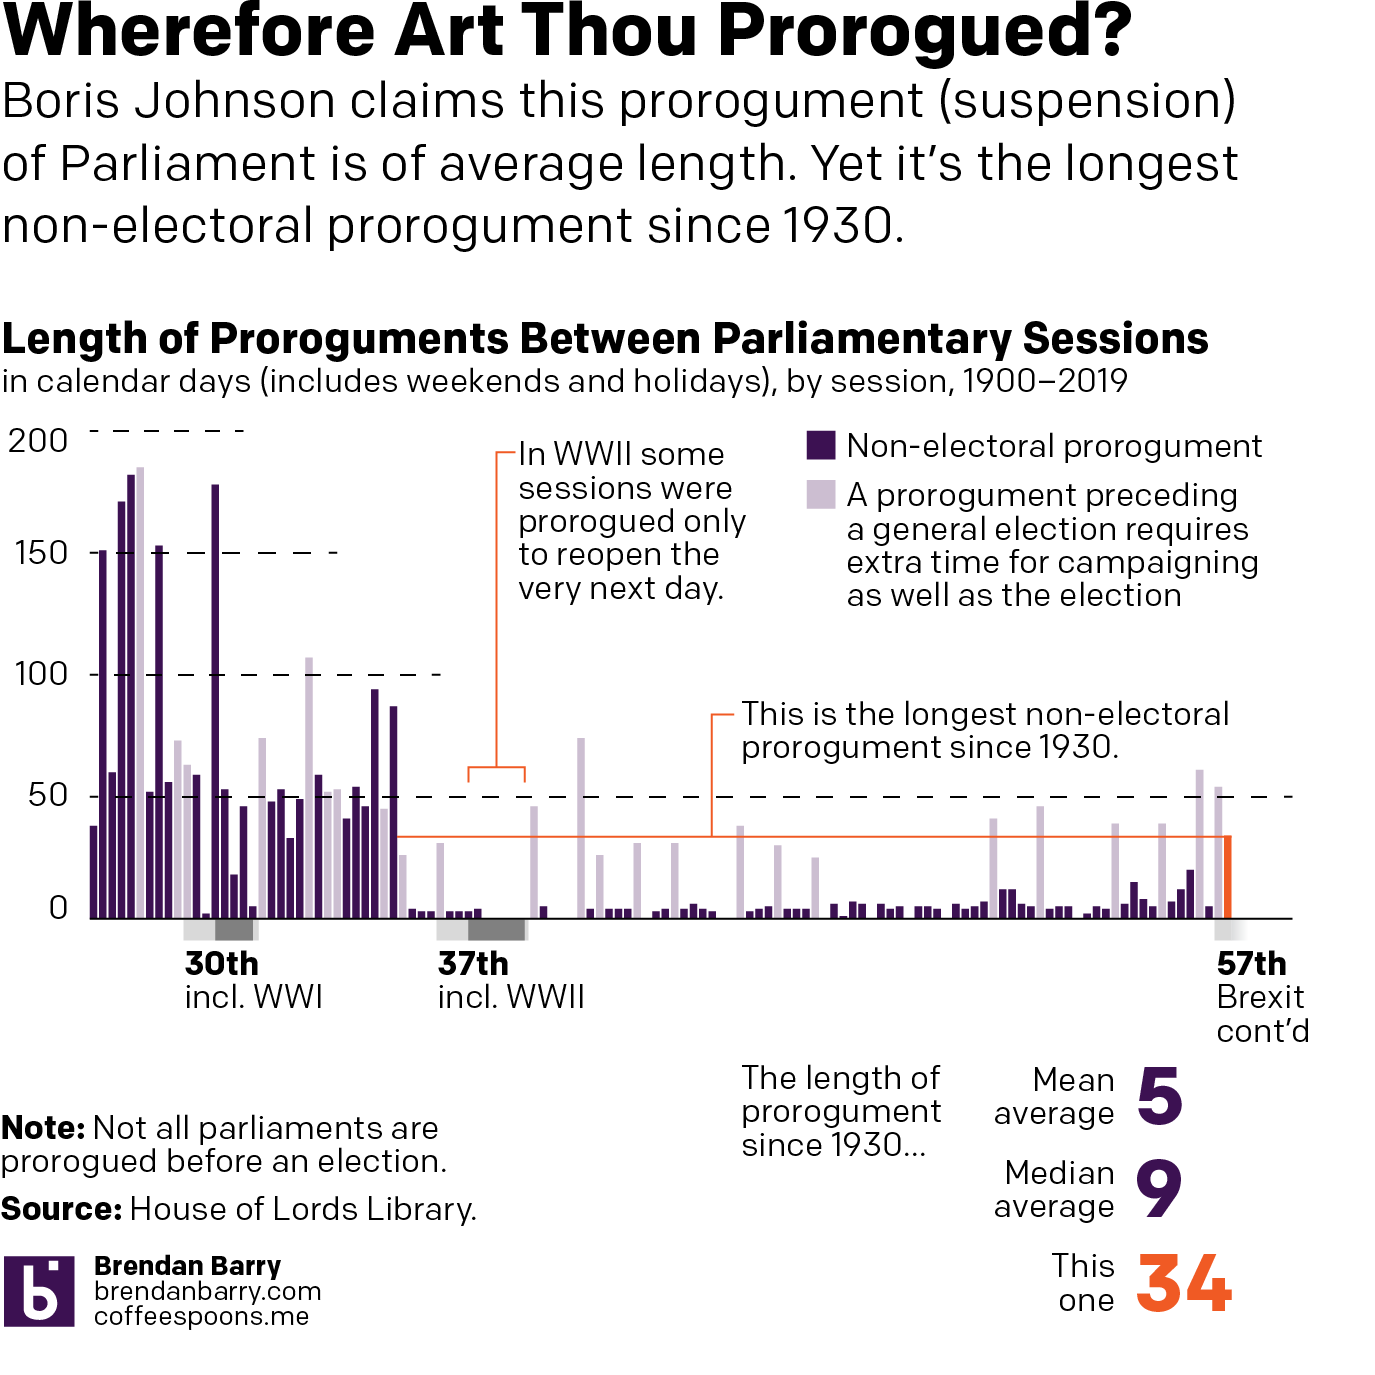
If you’re among my British/European audience, you are probably well aware Boris Johnson has prorogued, or suspended, Parliament. He and cabinet ministers stated it was a normal, average-length prorogation to prepare for a Queen’s Speech. (The Queen’s Speech is the formal opening of a new session of Parliament that sets out a new legislative agenda and formally closes/kills any unpassed legislation from the old session.) Except that in documents revealed in a Scottish court case, we now know that the real reason was to shut down Parliament to prevent it from interfering in Boris’ plans for a No Deal Brexit. And just this morning the Scottish High Court did indeed rule that the prorogation is illegal. The case now moves to the UK Supreme Court.

But I want to focus on the other claim, that this is a prorogation of average length. Thankfully instead of having to do a week’s hard slog of data, the House of Lords Library posted the data for me. At least since 1900, and that works well enough for me. And so here we go.

Back to the 1930s?
Back to the 1930s?

So yeah, this is not an average prorogument. If you look at only proroguments that do not precede a general election—you need time for the campaigning and then hosting the actual election in those cases—this is the longest prorogument since 1930. (Also, a Parliament does not necessarily need to be prorogued before it is dissolved before an election. And that happened quite often in the 1960s, 70s, and 80s.)

And as I point out in the graphic, Parliament was prorogued during the depths of World War II to start new legislative sessions. But in those cases, Parliament opened the very next day, during a time of national crisis. One could certainly make the argument that Brexit is a national crisis. So wherefore the extraordinarily long prorogument? Well, quite simply, Brexit.

Credit for the piece goes to me.

It’s Boris Time, Baby

Today Boris Johnson begins his premiership as the next prime minister of the United Kingdom. He might not be popular with the wide body of the British population, but he is quite popular with the Conservative base.

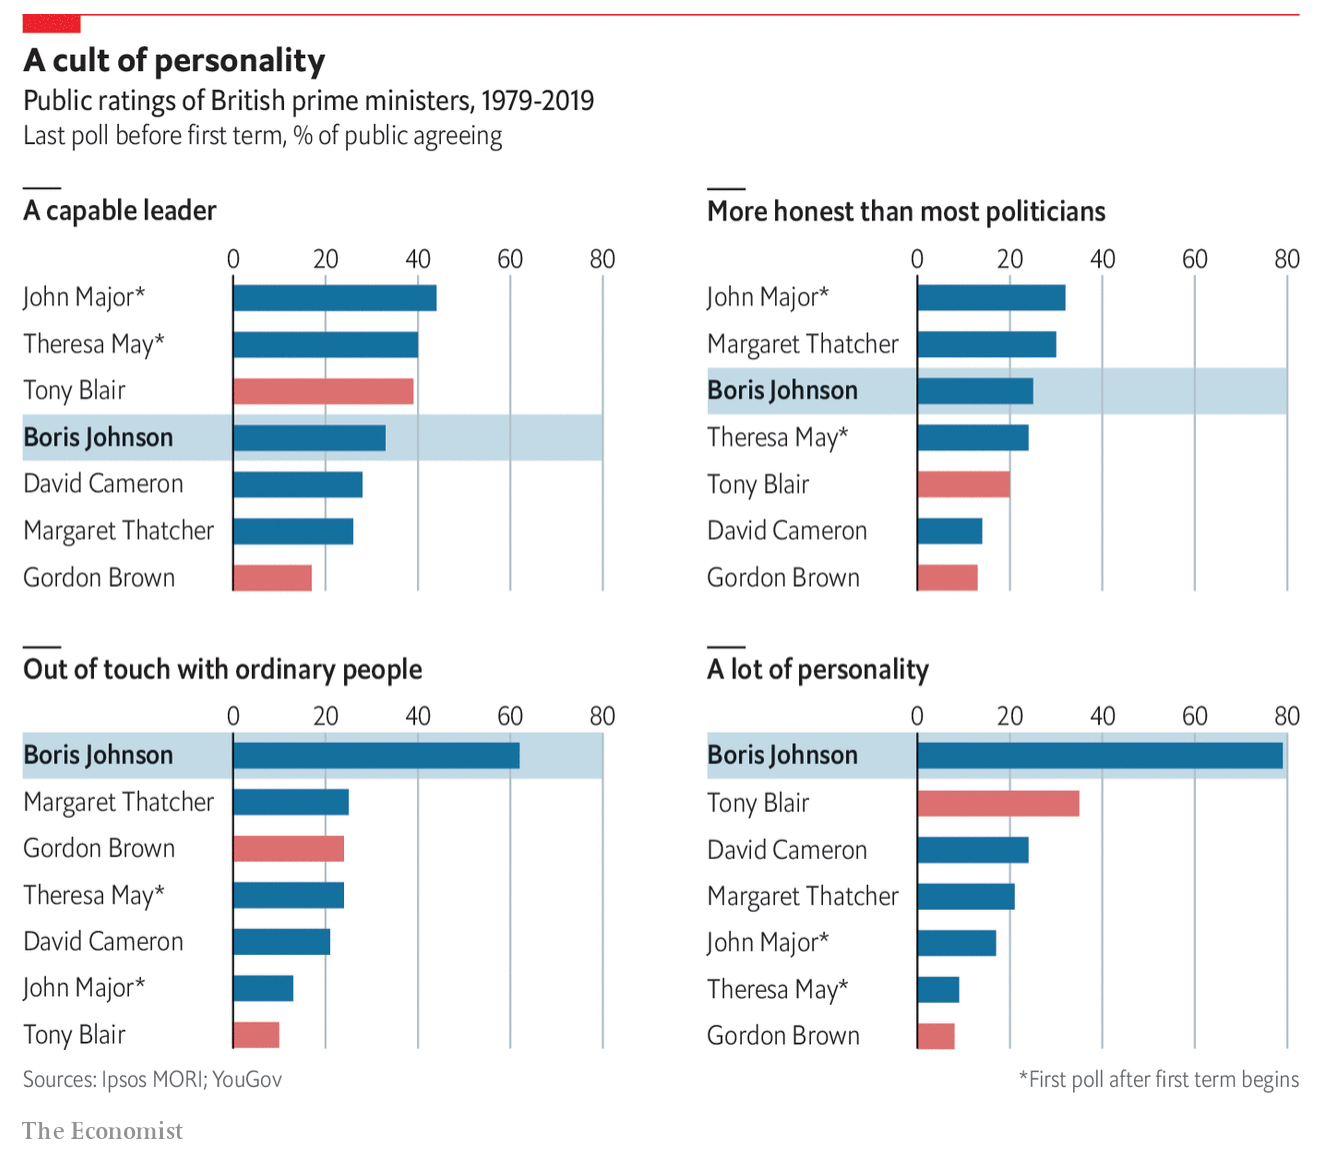
The Economist looked at how Boris polled on several traits, e.g. being more honest than most politicians, compared to his prime minister predecessors before they entered office. And despite being broadly unpopular outside the Tories, he still polls better than most of his predecessors.

Boris rates higher than many previous prime ministers before they came to power

Design wise, it’s a straight-forward use of small multiples and bar charts. I find the use of the light blue bar a nice device to highlight Boris’ position amongst his peers.

But now we see where Boris goes, most importantly on Brexit.

Credit for the piece goes to the Economist graphics department.

The Tory Leadership Race: The Favourite and All the Also Rans

This piece was published Monday, so it’s one round out of date, but it still holds true. It looks at the betting odds of each of the candidates looking to enter No. 10 Downing Street. And yeah, it’s going to be Boris.

That's a pretty sizable gap
That’s a pretty sizable gap

The thing that strikes me as odd about this piece however, is note the size of the circles. Why are they larger for Boris Johnson and Rory Stewart? It cannot be proportional to their odds of victory or else Boris’ head would be…even bigger. Is that even possible? Maybe it relates to their predicted placement of first and second, the two of which go to the broader Tory party for a vote. It’s really unclear and deserves some explanation.

The graphic also includes a standard line chart. It falls down because of spaghettification in that all those also rans have about the same odds, i.e. slim, to beat Boris.

Perhaps the most interesting thing to follow is who will be the other person on the ballot. But then who remembers Andrea Leadsom was the runner up to Theresa May?

Credit for the piece goes to the Economist graphics department.

The Tory Leadership Process

Today is another day in the Tory leadership election that will eventually see approximately 120,000 members of the Conservative Party electing the next prime minister of the 66,000,000 people living in the United Kingdom. The remaining candidates need at least 33 votes from MPs to move on. Those and/or the last place candidate will be eliminated. The question today is whether Dominic Raab, Sajid Javid, and Rory Stewart can move to the next round along with the front runner Boris Johnson and his two not-really-close-but-someone-has-to-be-a-significant competitors, Jeremy Hunt and Michael Gove.

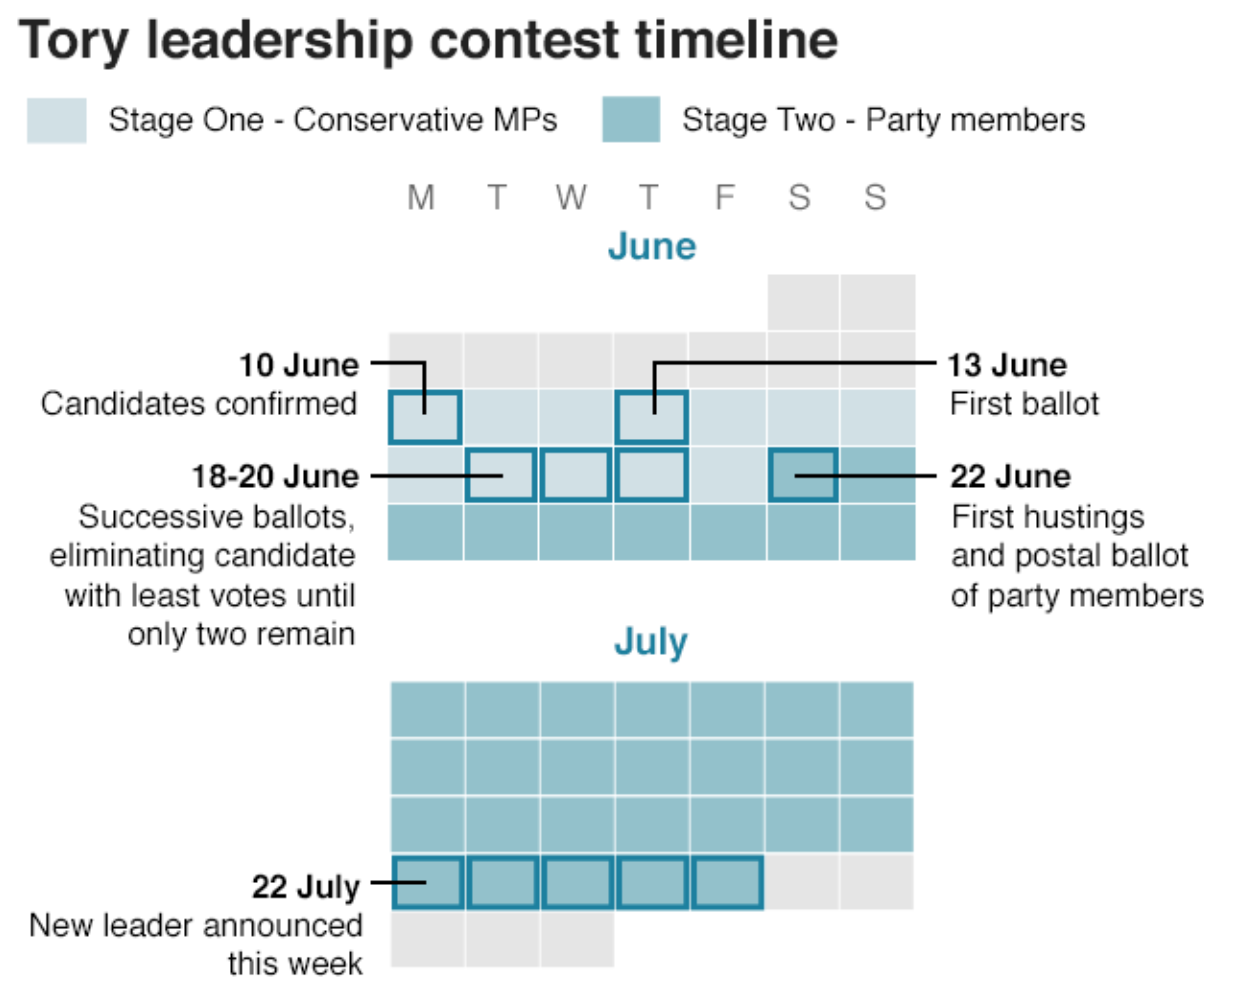
But what happens after today’s vote? The BBC created a graphic explaining it all.

Oh yeah, and Brexit is still happening.

It’s a simple concept: a calendar that uses shades and outline boxes to highlight particular dates.

But the elephant in this particular Westminster cloakroom is that the Tories are using all this time whilst the Brexit clock keeps ticking down to 31 October.

Credit for the piece goes to the BBC graphics department.

Abortion by State

In case you did not hear, earlier this week Alabama banned all abortions. And for once, we do not have to add the usual caveat of “except in cases of rape or incest”. In Alabama, even in cases of rape and incest, women will not have the option of having an abortion.

And in Georgia, legislators are debating a bill that will not only strictly limit women’s rights to have an abortion, but will leave them, among other things, liable for criminal charges for travelling out of state to have an abortion.

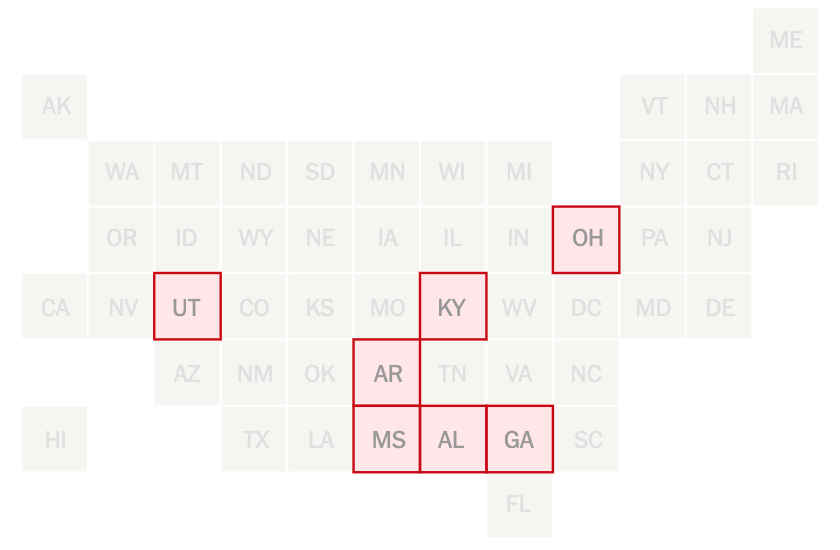
Consequently, the New York Times created a piece that explores the different abortion bans on a state-by-state basis. It includes several nice graphics including what we increasingly at work called a box map. The map sits above the article and introduces the subject direct from the header that seven states have introduced significant legislation this year. The map highlights those seven states.

We've been calling these box maps. It's growing on me.
We’ve been calling these box maps. It’s growing on me.

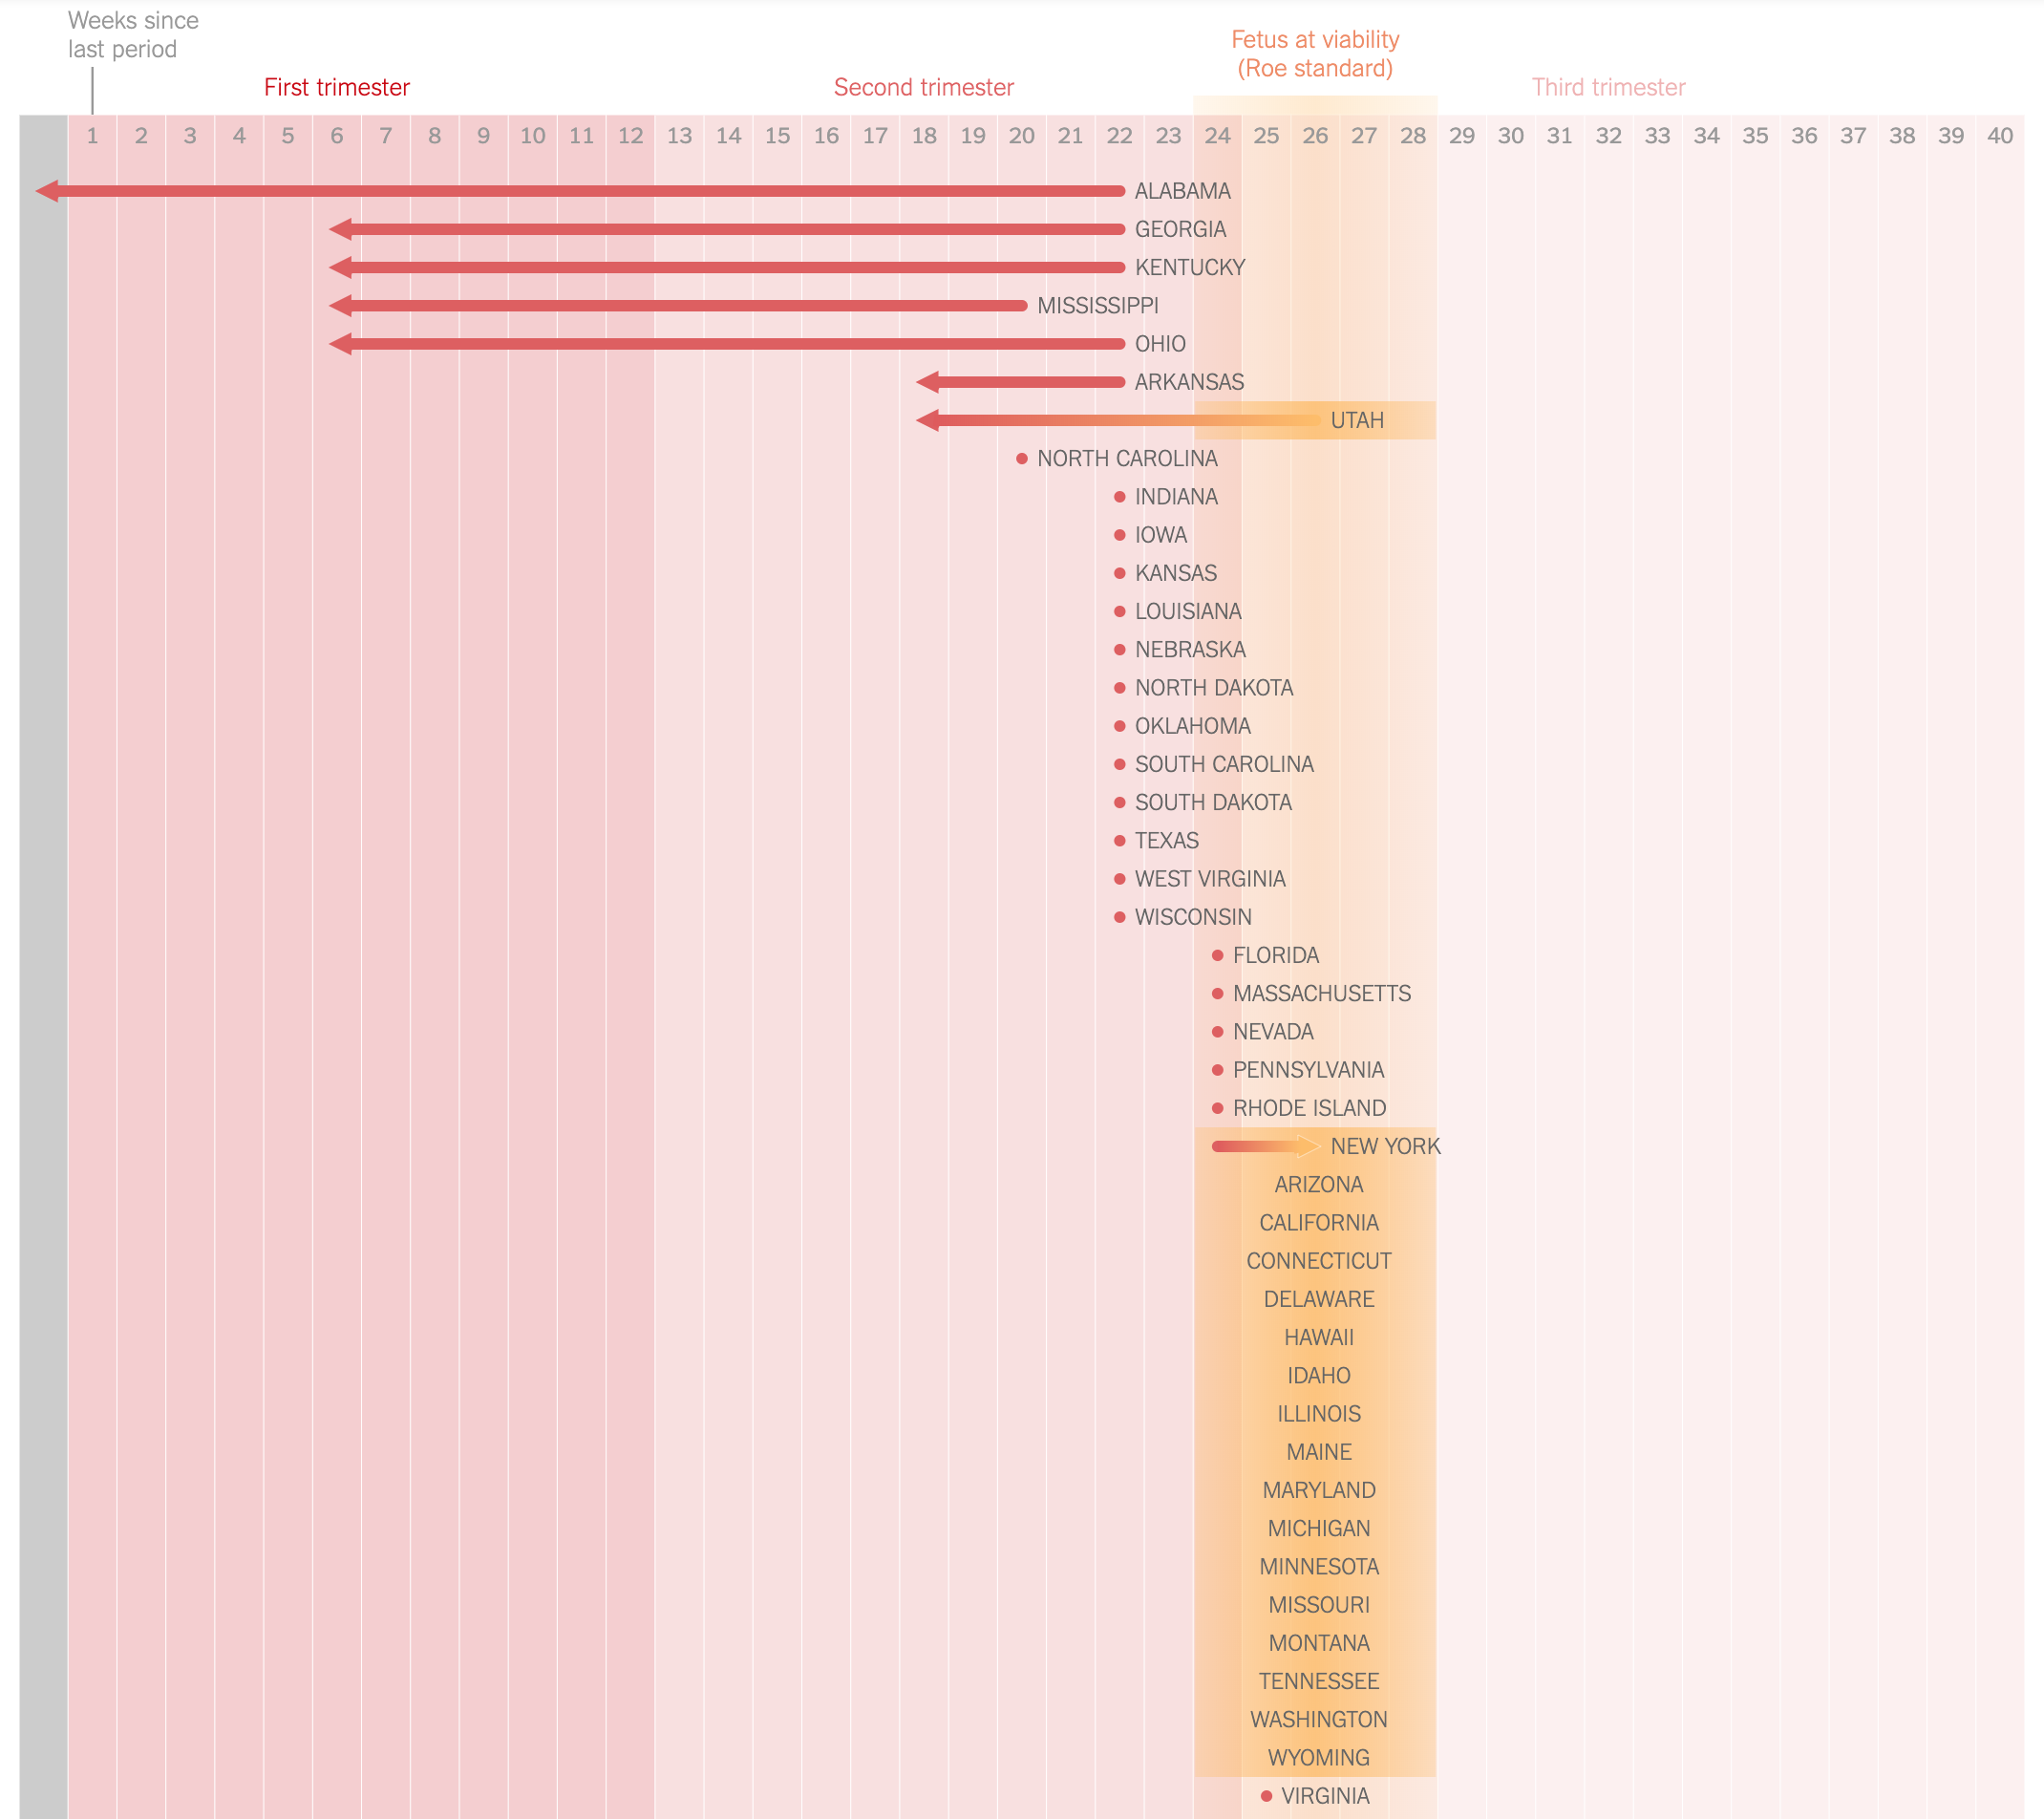
The gem, however, is a timeline of sorts that shows when states ban abortion based on how long since a woman’s last period.

There are some crazy shifts leftward in this graphic…

It does a nice job of segmenting the number of weeks into not trimesters and highlighting the first, which traditionally had been the lower limit for conservative states. It also uses a nice yellow overlay to indicate the traditional limits determined by the Roe v. Wade decision. I may have introduced a nice thin rule to even further segment the first trimester into the first six week period.

We also have a nice calendar-like small multiple series showing states that have introduced but not passed, passed but vetoed, passed, and pending legislation with the intention of completely banning abortion and also completely banning it after six weeks.

Far too many boxes on the right…

This does a nice job of using the coloured boxes to show the states have passed legislation. However, the grey coloured boxes seem a bit disingenuous in that they still represent a topically significant number: states that have introduced legislation. It almost seems as if the grey should be all 50 states, like in the box map, and that these states should be in some different colour. Because the eight or 15 in the 2019 column are a small percentage of all 50 states, but they could—and likely will—have an oversized impact on women’s rights in the year to come.

That said, it is a solid graphic overall. And taken together the piece overall does a nice job of showing just how restrictive these new pieces of legislation truly are. And how geographically limited in scope they are. Notably, some states people might not associate with seemingly draconian laws are found in surprising places: Pennsylvania, Illinois, Maryland, and New York. But that last point would be best illustrated by another box map.

Credit for the piece goes to K.K. Rebecca Lai.

The Summary of the Mueller Report

When Robert Mueller submitted his report a few weeks ago, some interested parties declared it a witch hunt that had wasted time and money. Except, it had done the opposite of that. It had laid bare Russia’s interference in our elections and the contacts between Russian government and quasi-government officials and Trump campaign officials. Said officials then lied about their contacts and, along with other crimes discovered during the course of the investigation, either pleaded guilty or were convicted. And while a few trials are still underway, we also now know 12 other cases have been referred to prosecutors but they remain under wraps.

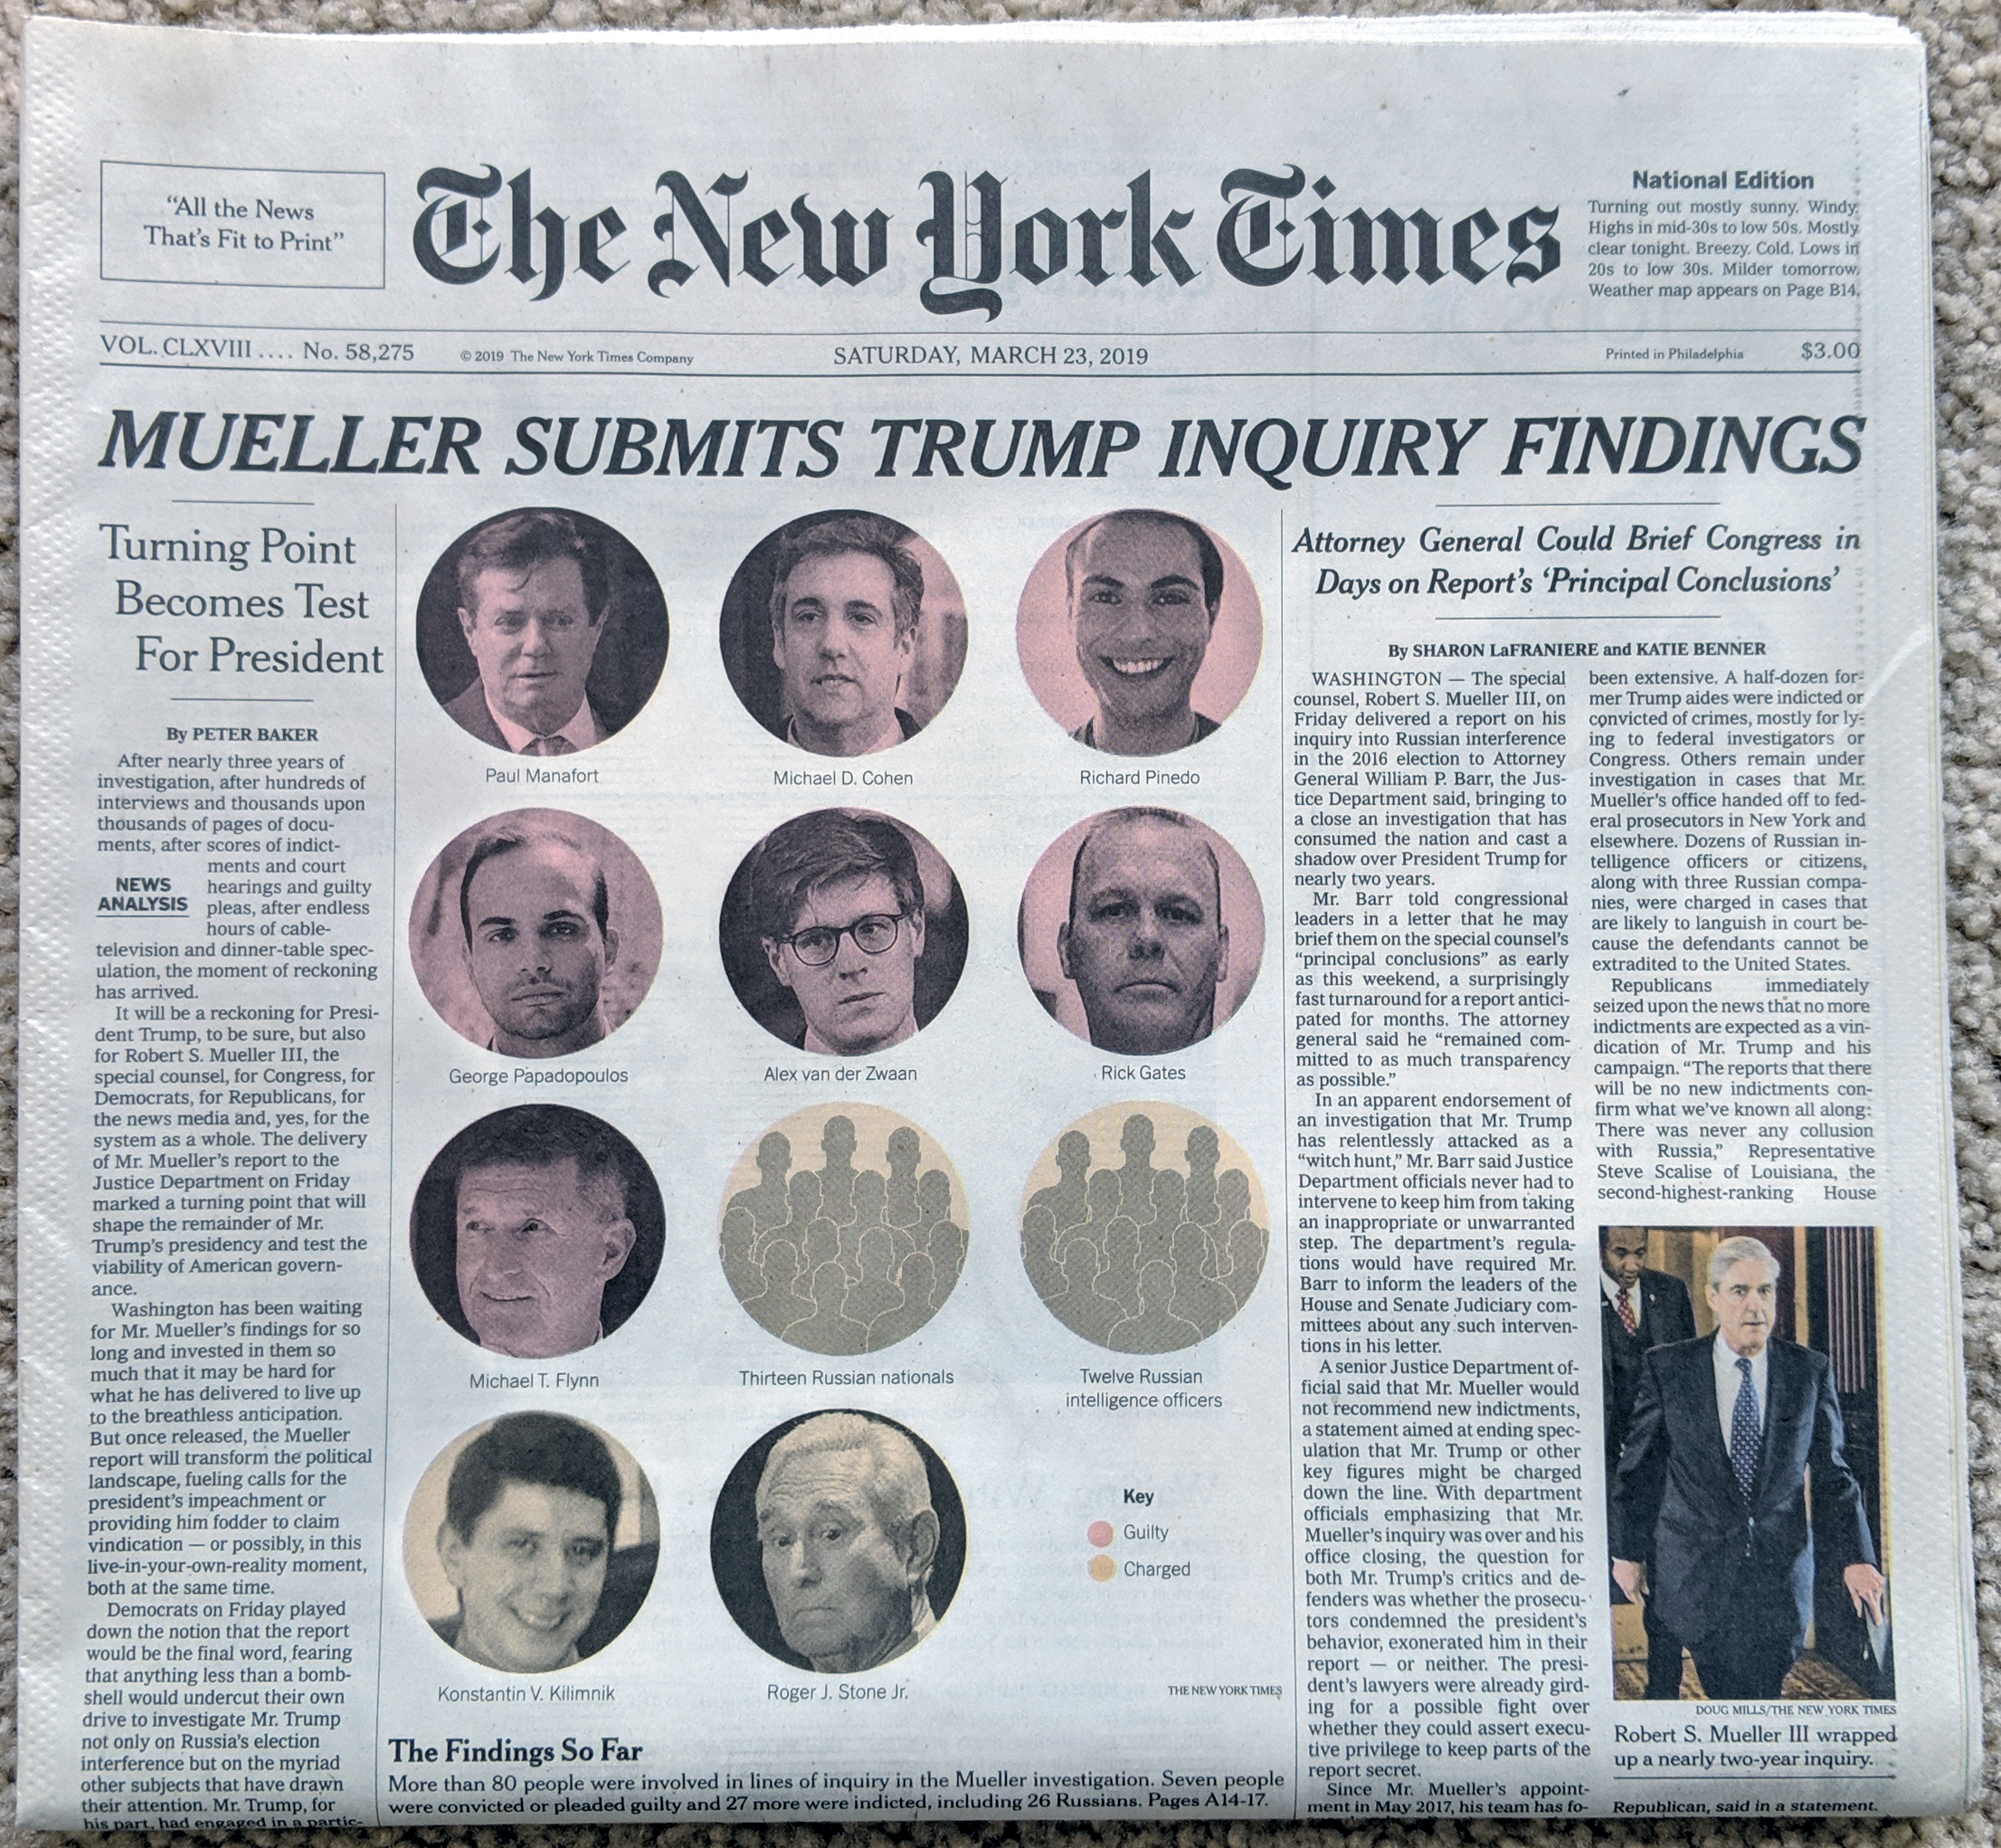
At the time of submission, the New York Times was able to create this front page graphic.

There's some shady shit going on here.
There’s some shady shit going on here.

It highlighted the key figures in the report’s investigation and identified their current status. Many of those charged, essentially all the Russians, are unlikely to ever stand trial because Russia will not extradite them.

Inside the piece we had two full pages covering the report. The graphics were rather simple, like this, although as these were black and white pages, colouring the photographs was not an option. Instead, the designers simply used headers and titles to separate out the rogues’ gallery.

Not exactly the pages on which you want your name…

This wasn’t a complicated piece, but it made sense as one of the first pieces. For months we had been told the investigation was “wrapping up soon”, or words to that effect. Then, out of nowhere, it finally did. In one day, and crucially without the actual report yet, work like this reminded us that the report had, in fact, achieved its purpose.

Credit for the piece goes to the New York Times graphics department.

Israeli Electoral History

One of the important stories of last week that was not black hole related was that of the re-election of the Likud Party in Israel, a party headed by Benjamin Netanyahu. This will be his fourth consecutive time as prime minister plus a fifth back in the late 1990s. Of course, he is facing an expected arrest and charges on corruption, so how long he might remain in office is yet to be determined.

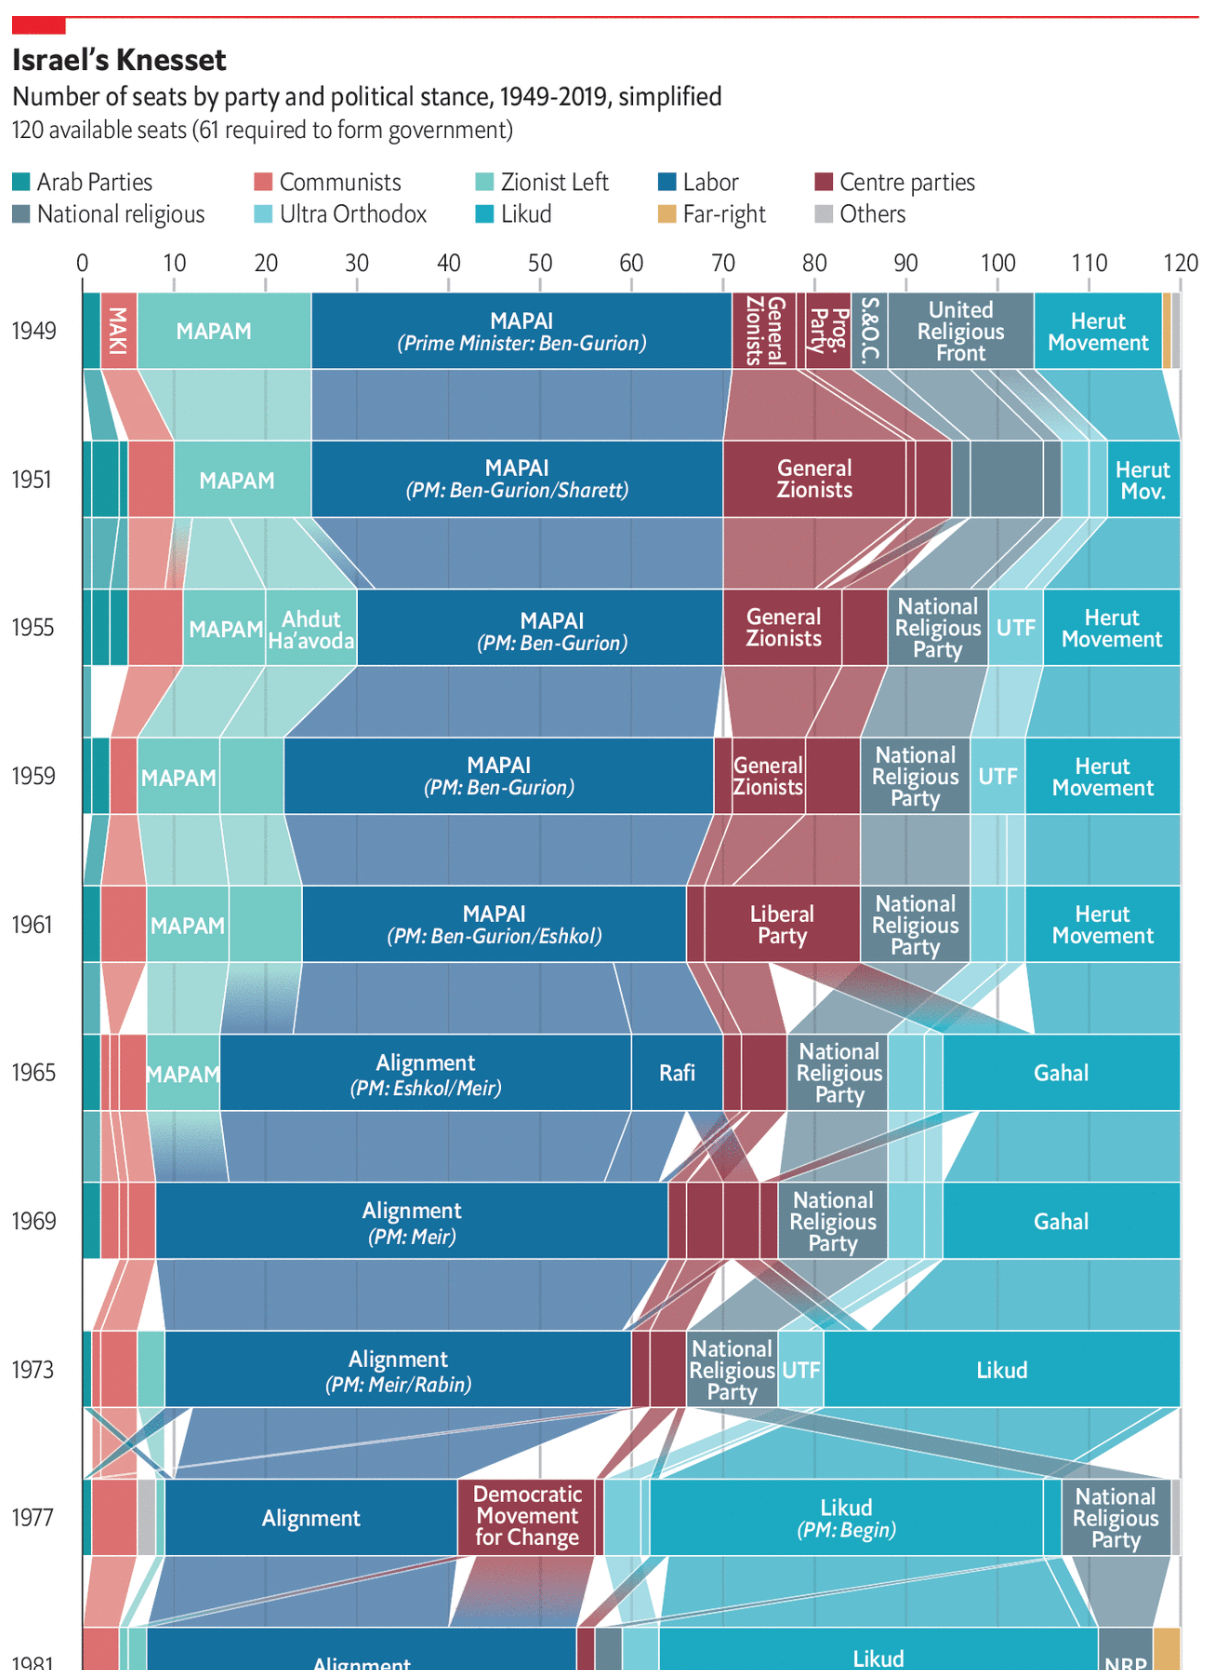
However, the Economist put together this great piece using a Sankey diagram showing the ebbs and flows of the various political parties in Israel since its founding.

It's definitely not a two-party system…
It’s definitely not a two-party system…

Obviously, this is only a partial screenshot, but it does a great job showing those changes. Most impressive is the designers’ ability to show the continuity of the evolving parties and the name changes and the splits and recombinations.

Credit for the piece goes to the Economist Data Team.

How Does the UK View Their Political Parties?

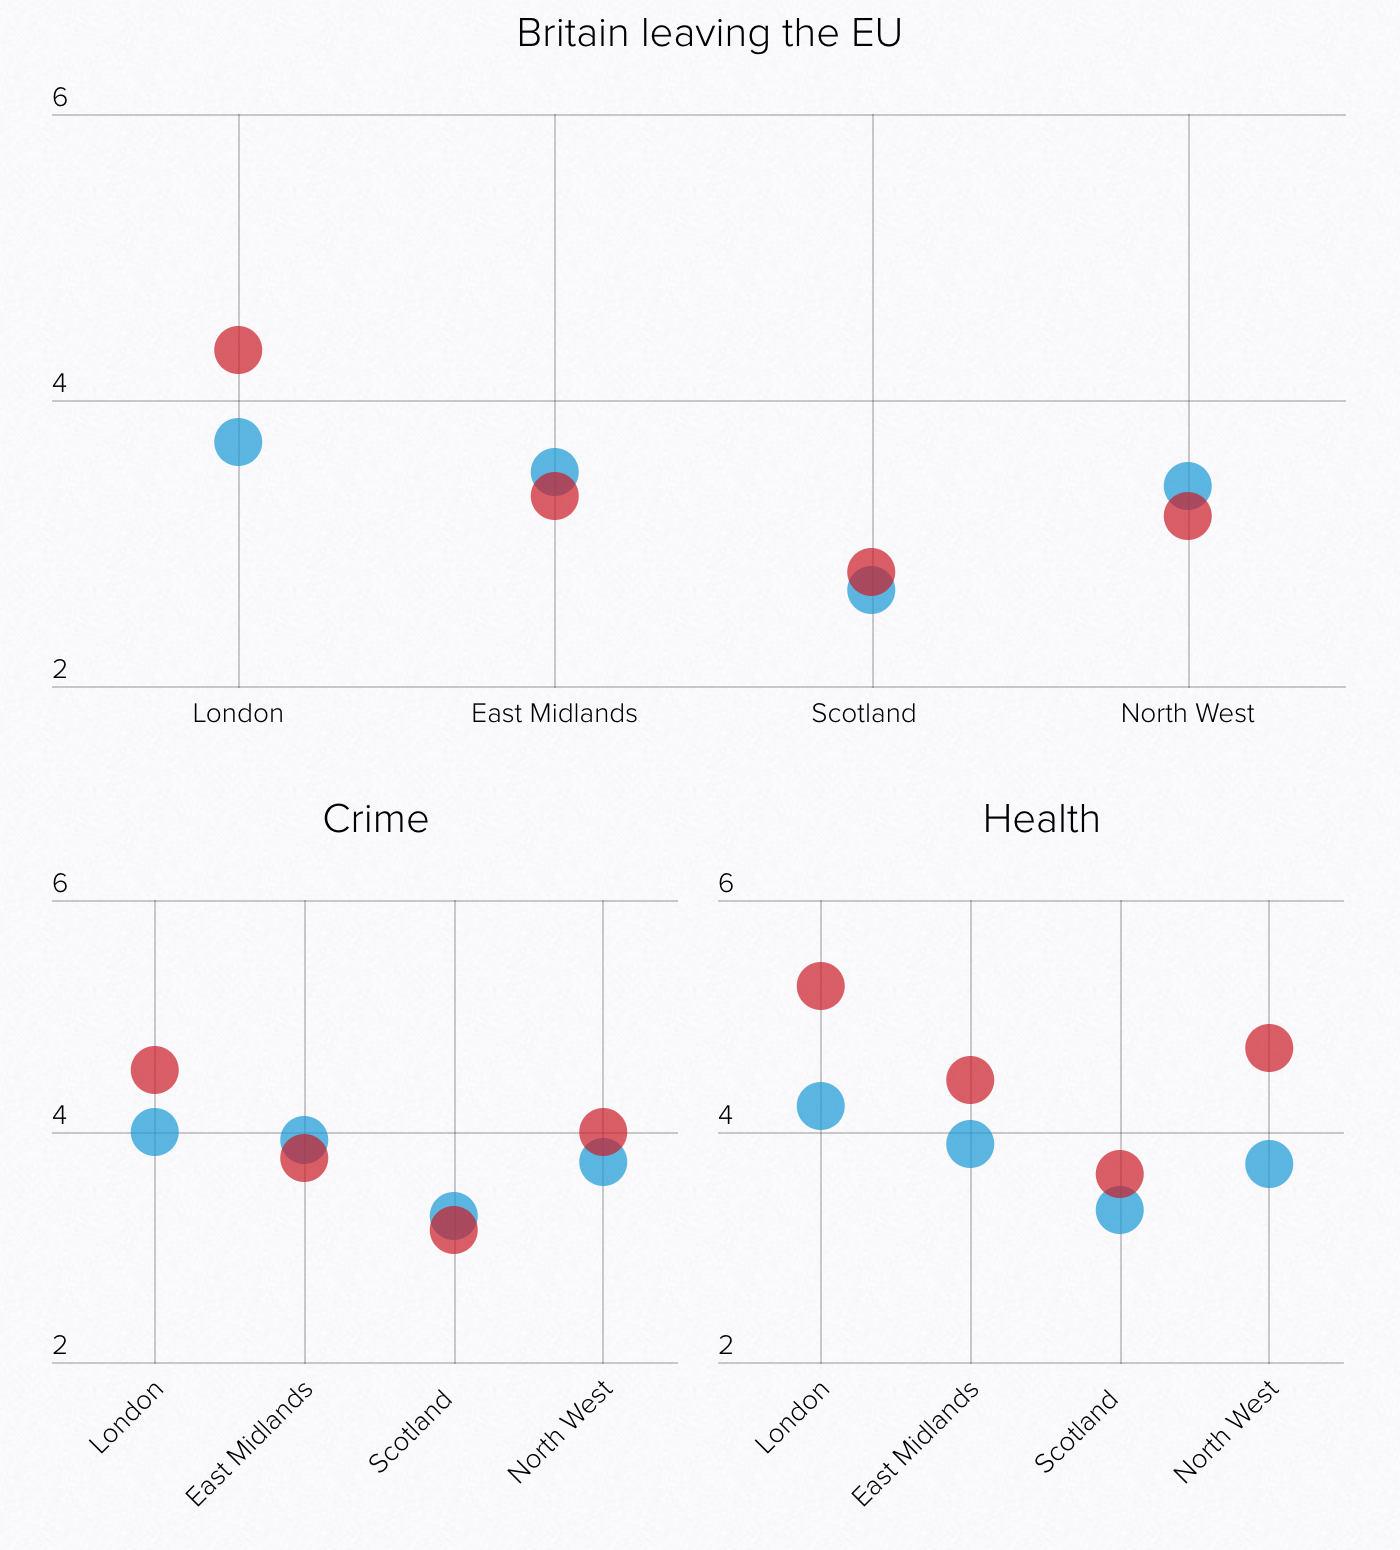
The United Kingdom crashes out of the European Union on Friday. That means there is no deal to safeguard continuity of trading arrangements, healthcare, air traffic control, security and intelligence deals, &c. Oh, and it will likely wreck the economy. No big deal, Theresa. But what do UK voters think about their leading political parties in this climate? Thankfully Politico is starting to collect some survey data from areas of marginal constituencies, what Americans might call battleground districts, ahead of the eventual next election.

And it turns out the Tories aren’t doing well. Though it’s not like Labour is performing any better, because polling indicates the public sees Corbyn as an even worse leader than Theresa May. But this post is more to talk about the visualisation of the results.

Of course I naturally wonder the perception of the smaller parties like the Liberal Democrats or Change UK (the Independent Group)

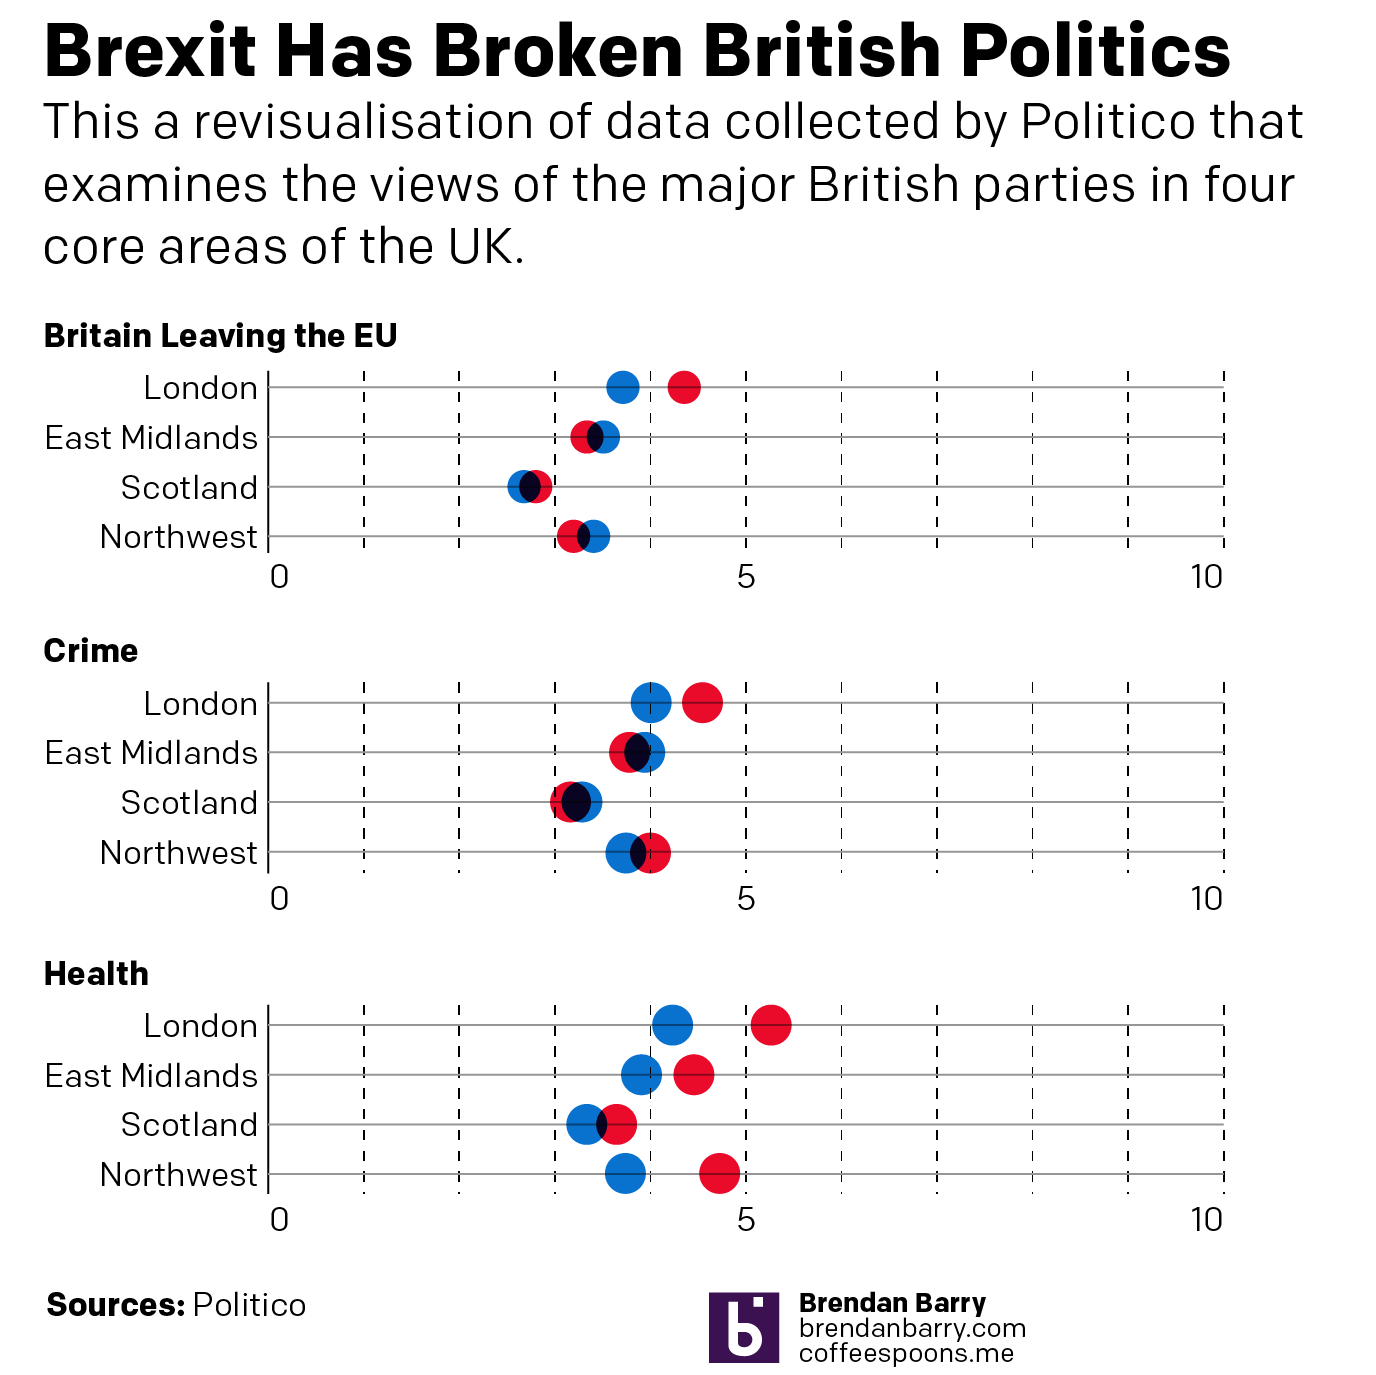
The graphics above are a screenshot where blue represents the Conservatives (Tories) and red Labour. The key thing about these results is that the questions were framed around a 0–10 scale. But look at the axes. Everything looks nice and evenly spread, until you realise the maximum on the y-axis is only six. The minimum is two. It gives the wrong impression that things are spread out neatly around the midpoint, which here appears to be four. But what happens if you plot it on a full axis? Well, the awfulness of the parties becomes more readily apparent.

Neither party looks very good here…

Labour might be scoring around a five on Health, but its score is pretty miserable in these other two categories. And don’t worry, the article has more.  But this quick reimagination goes to show you how important placing an axis’ minimum and maximum values can be.

Credit for the piece goes to the Politico graphics department.