State Level Action on Gun Control

A few months ago I covered an editorial piece from the New York Times that looked at all the action, by which I mean inaction, the federal government had taken on gun violence in the wake of some horrific shootings. Well on Saturday the Washington Post published an article looking at how there has been action on the state level.

Where is Pennsylvania?

It used a series of small multiple maps of the United States with states represented as tiles or boxes. States are coloured by whether they took action in one of six different categories. It is a pretty simple and straightforward design that works well.

The only thing I am unsure about is whether the colours are necessary. A single colour could be used effectively given that each map has a clear title directly above it. Now, if the dataset were to be used in another chart or graphic alongside the maps where the types of action were combined, then colours could be justified. For example, if there was a way to see what actions a state had taken, i.e. pivot the data display, the different colours could show what from the set the state had done.

And in Pennsylvania’s case, sadly, that is nothing.

Credit for the piece goes to Amber Phillips.

Still a Loyalist

As most of you know, I am what would have been called a loyalist. That is, I disagree with the premise of the American Revolution. People often mistake that as saying I think Americans should be British. No, although I personally would not mind that. Instead, America would likely have been a lot more like Canada and it would have obtained its independence peacefully through an organic, evolutionary process leading to, likely, some kind of parliamentary democracy.

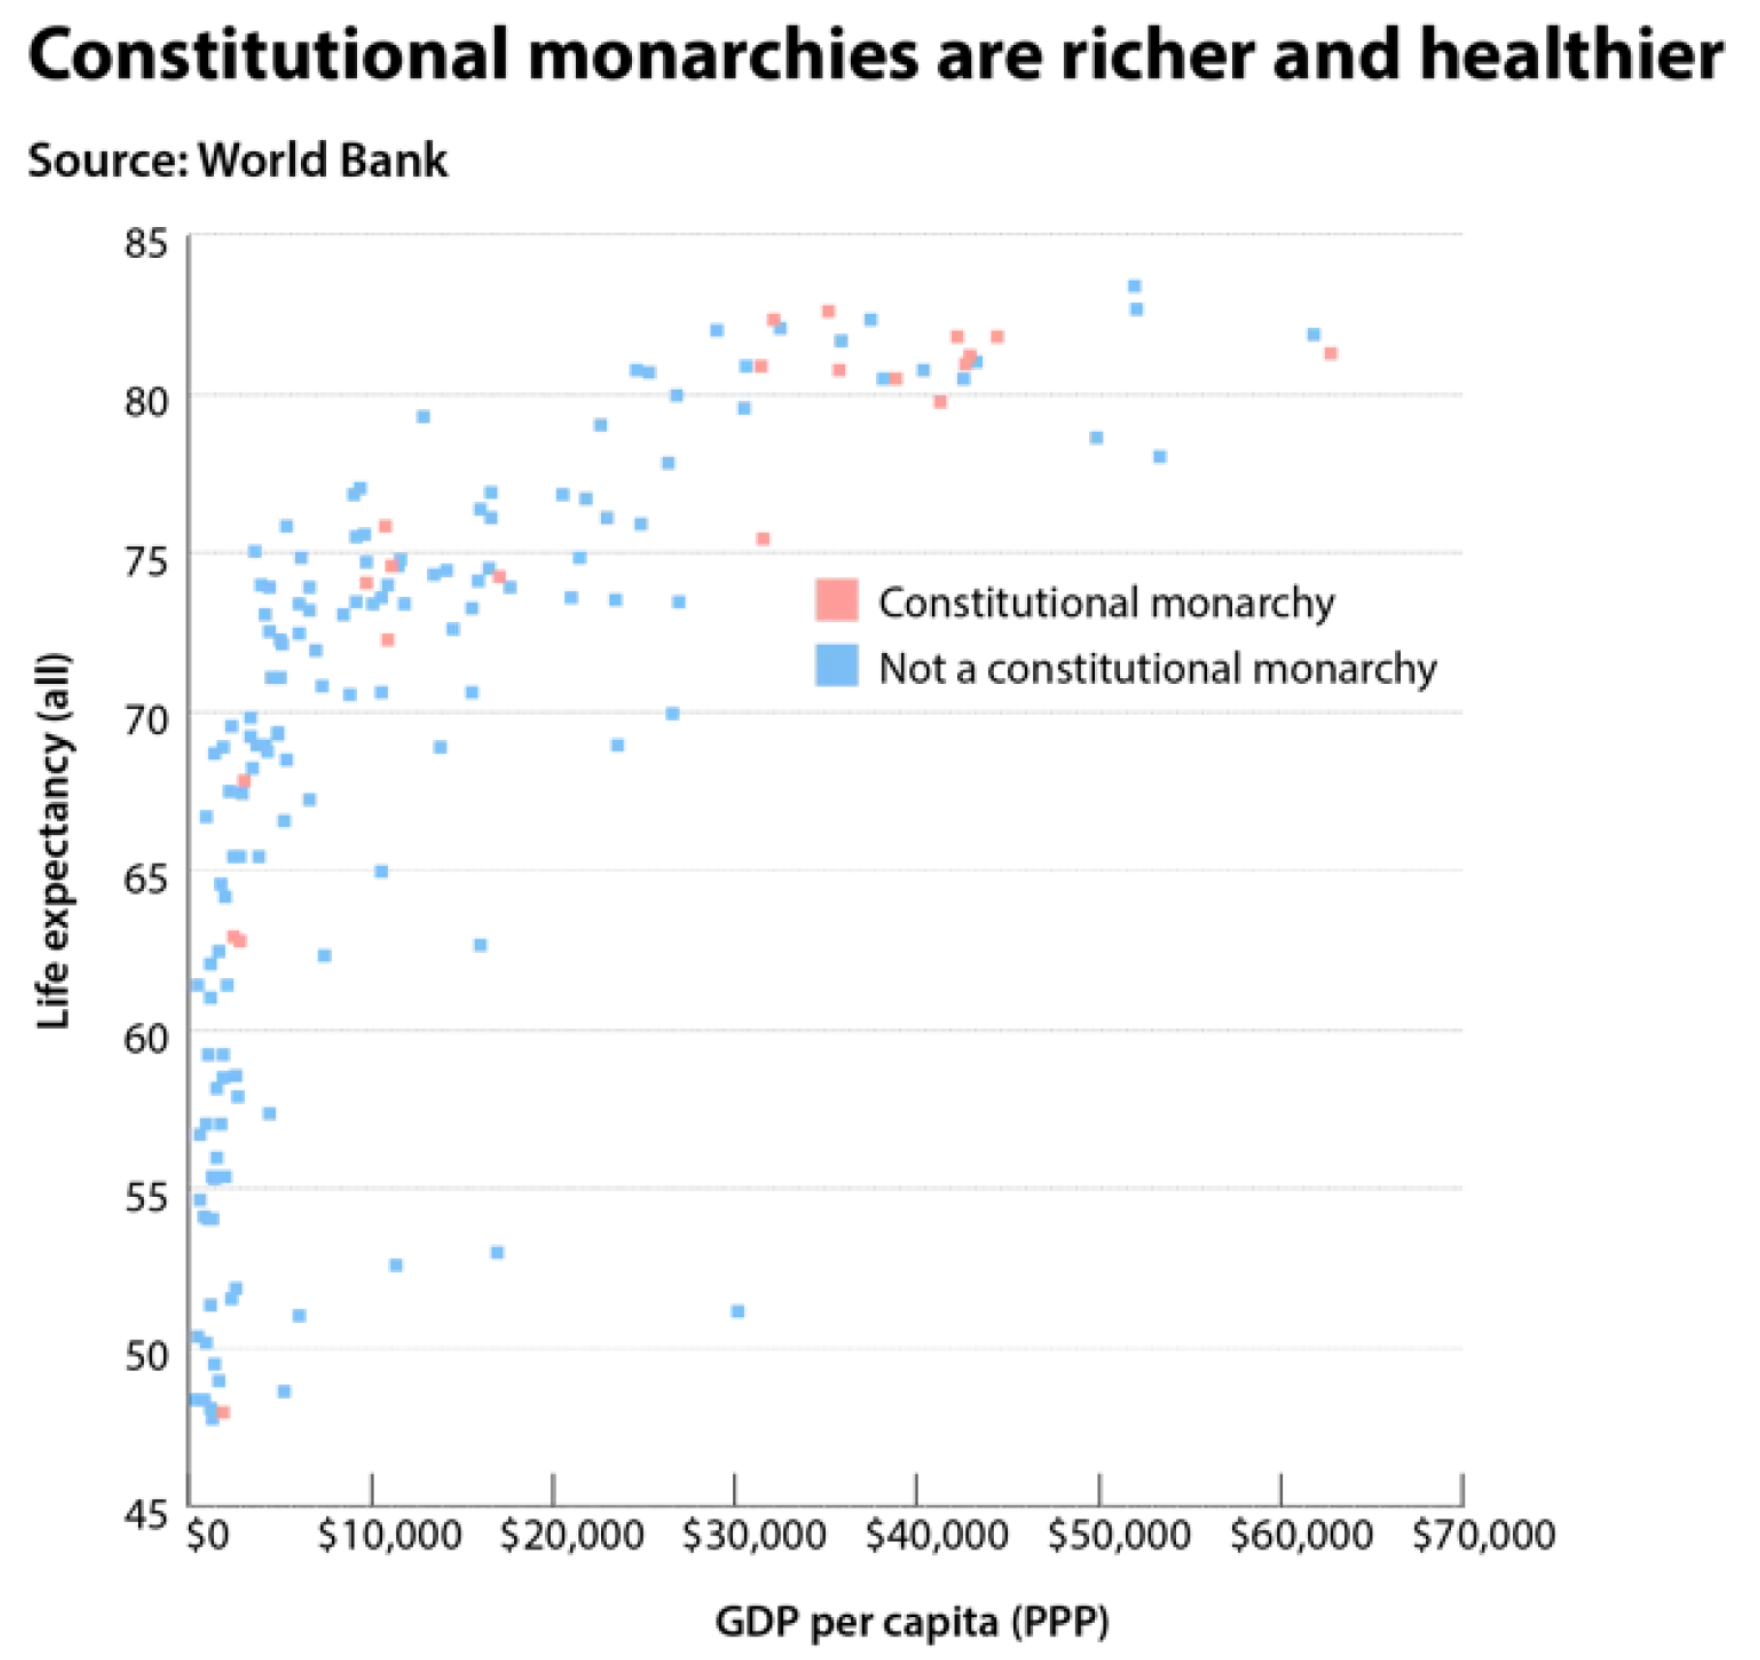
Every year, somebody digs up articles people have written about why the Revolution was a bad idea. I have seen a lot of them. But I had not seen this Washington Post article that looked at constitutional monarchies. It was published during the whole royal baby buzz back in 2013. It examines why constitutional monarchies are not so bad, and might even be better than presidential republics.

God save the Queen
God save the Queen

The above graphic is far from great. The same goes for the other graphic in the article. I probably would have added more emphasis on the constitutional monarchies as they get overwhelmed by the number of non-constitutional monarchies s in the scatter plot. That could be through a brighter blue or keeping the pink and setting the rest to a light grey. I perhaps would have added a trend line.

Credit for the piece goes to Dylan Matthews.

Trade with Canada

Yesterday we looked at trade with China. Today, we look at Canada, allegedly ripping off America. But what does the data say? Thankfully the Washington Post put together a piece looking at just that topic. And it uses a few interesting graphics to explore the idea.

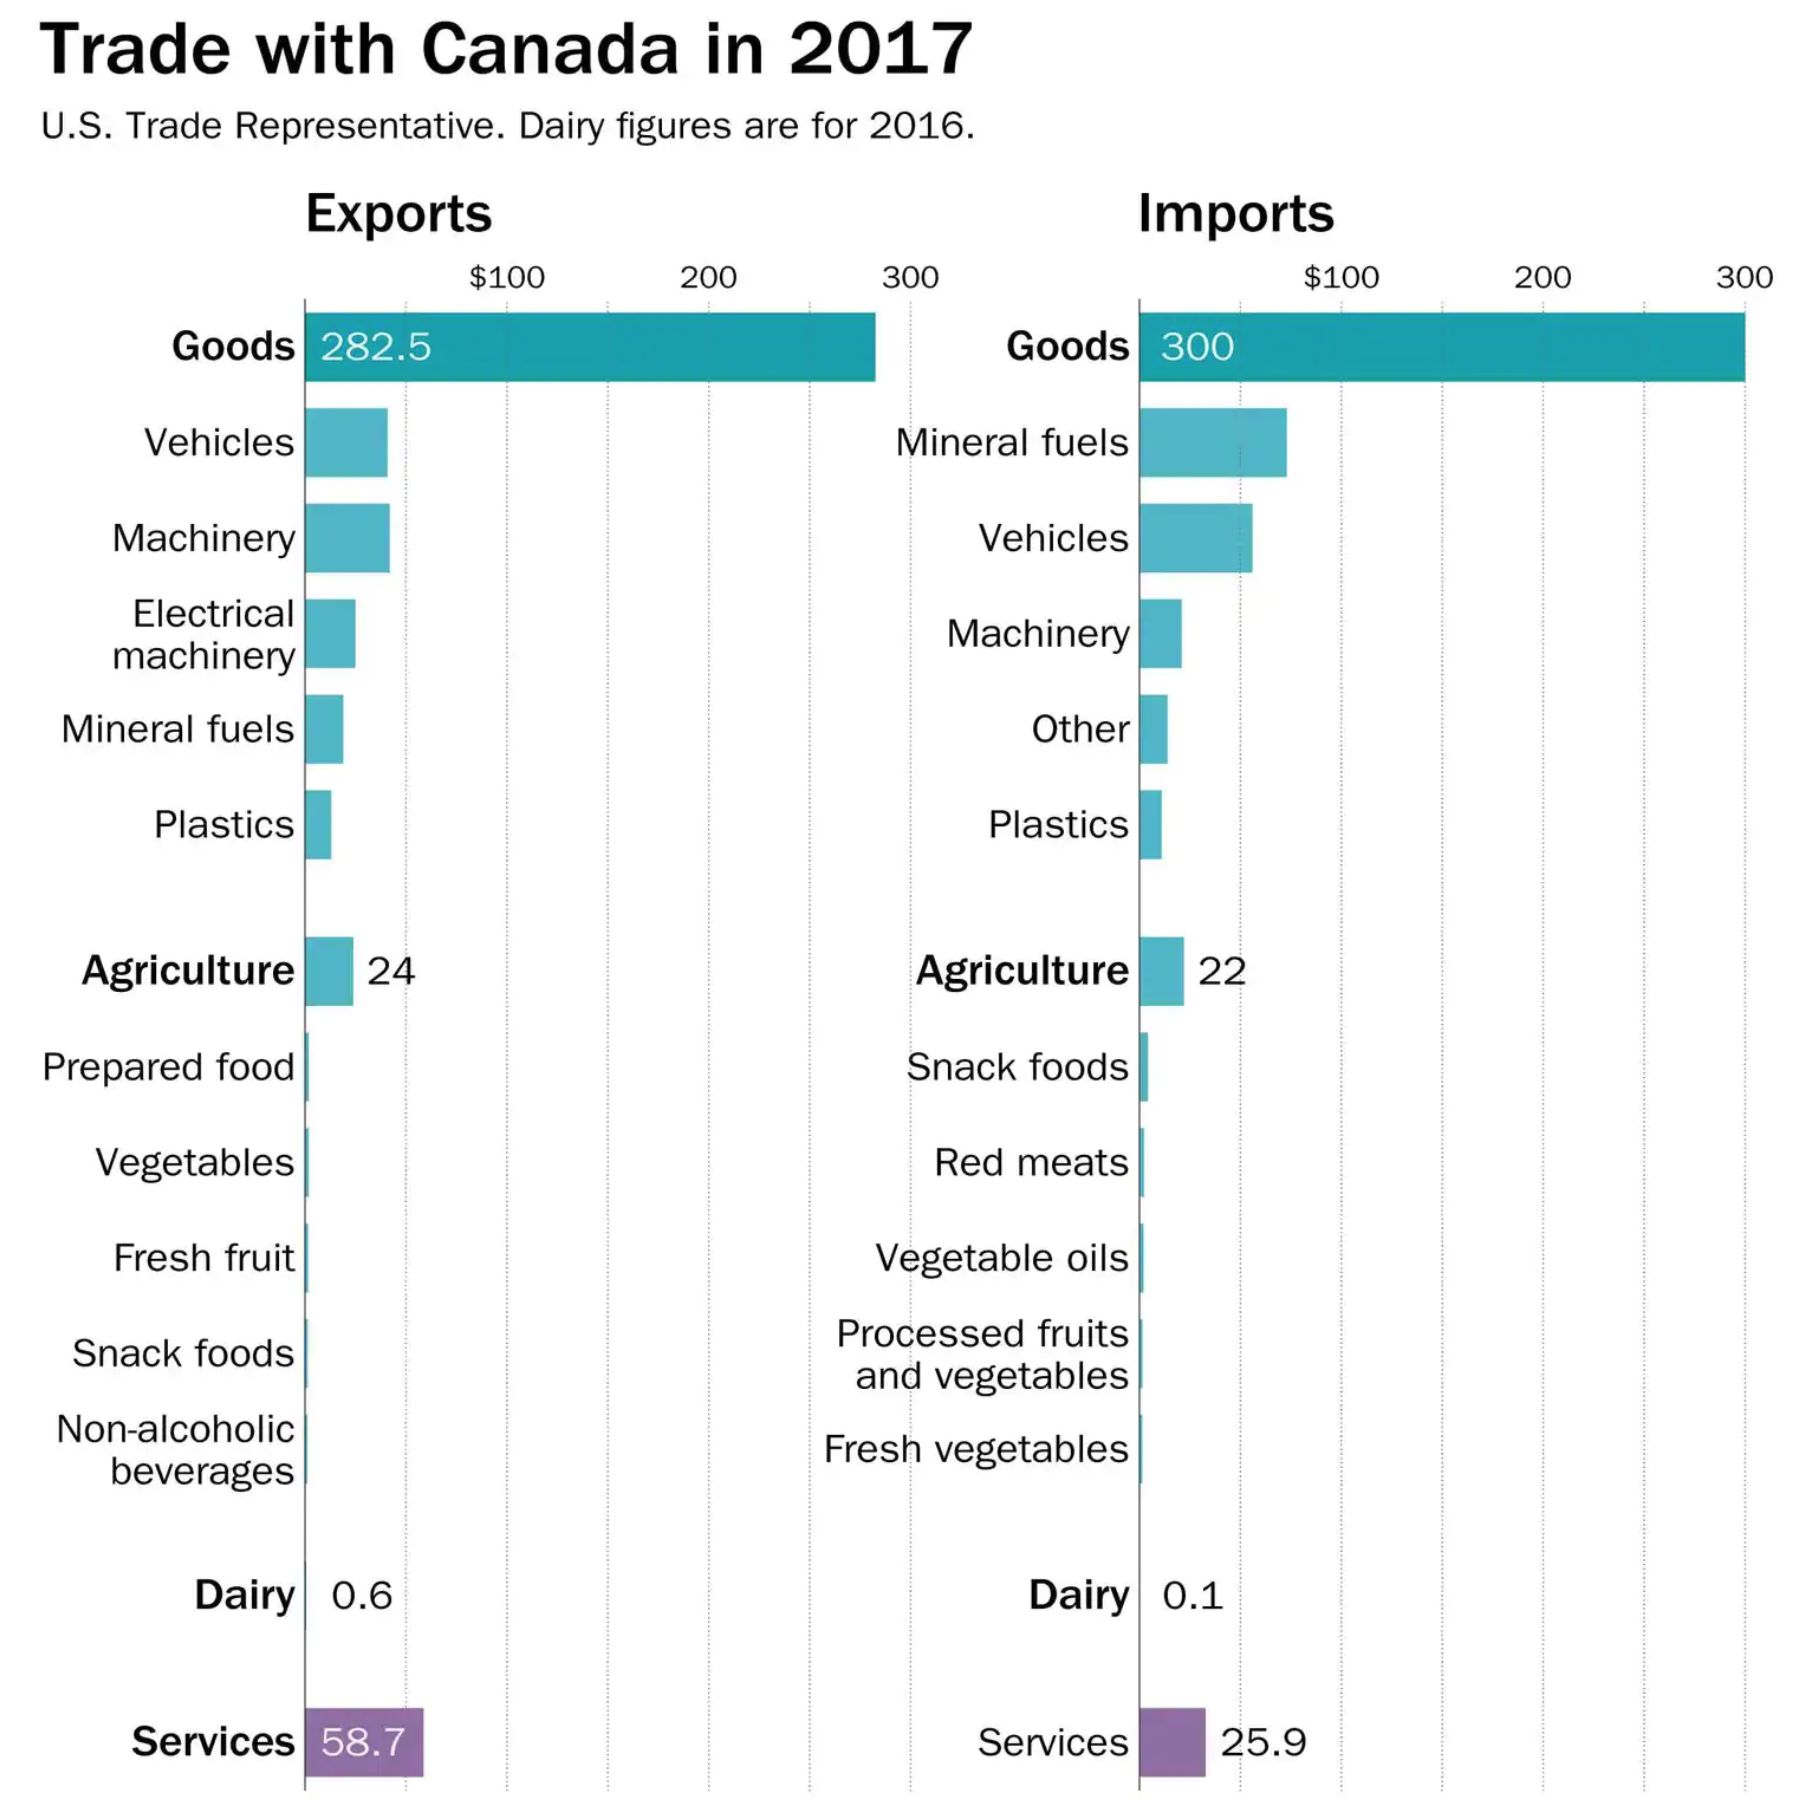
The easiest and least controversial graphic is that below, which breaks down constituent parts of our bilateral trade.

The article also points out that very small dairy section, which is one focus of the administration's complaints. But look how tiny it is…
The article also points out that very small dairy section, which is one focus of the administration’s complaints. But look how tiny it is…

Note that the graphic does not just show the traditional goods part of the equation, but also breaks out services. And as soon as you consider that part of the economy the US trade deficit with Canada turns from deficit into surplus.

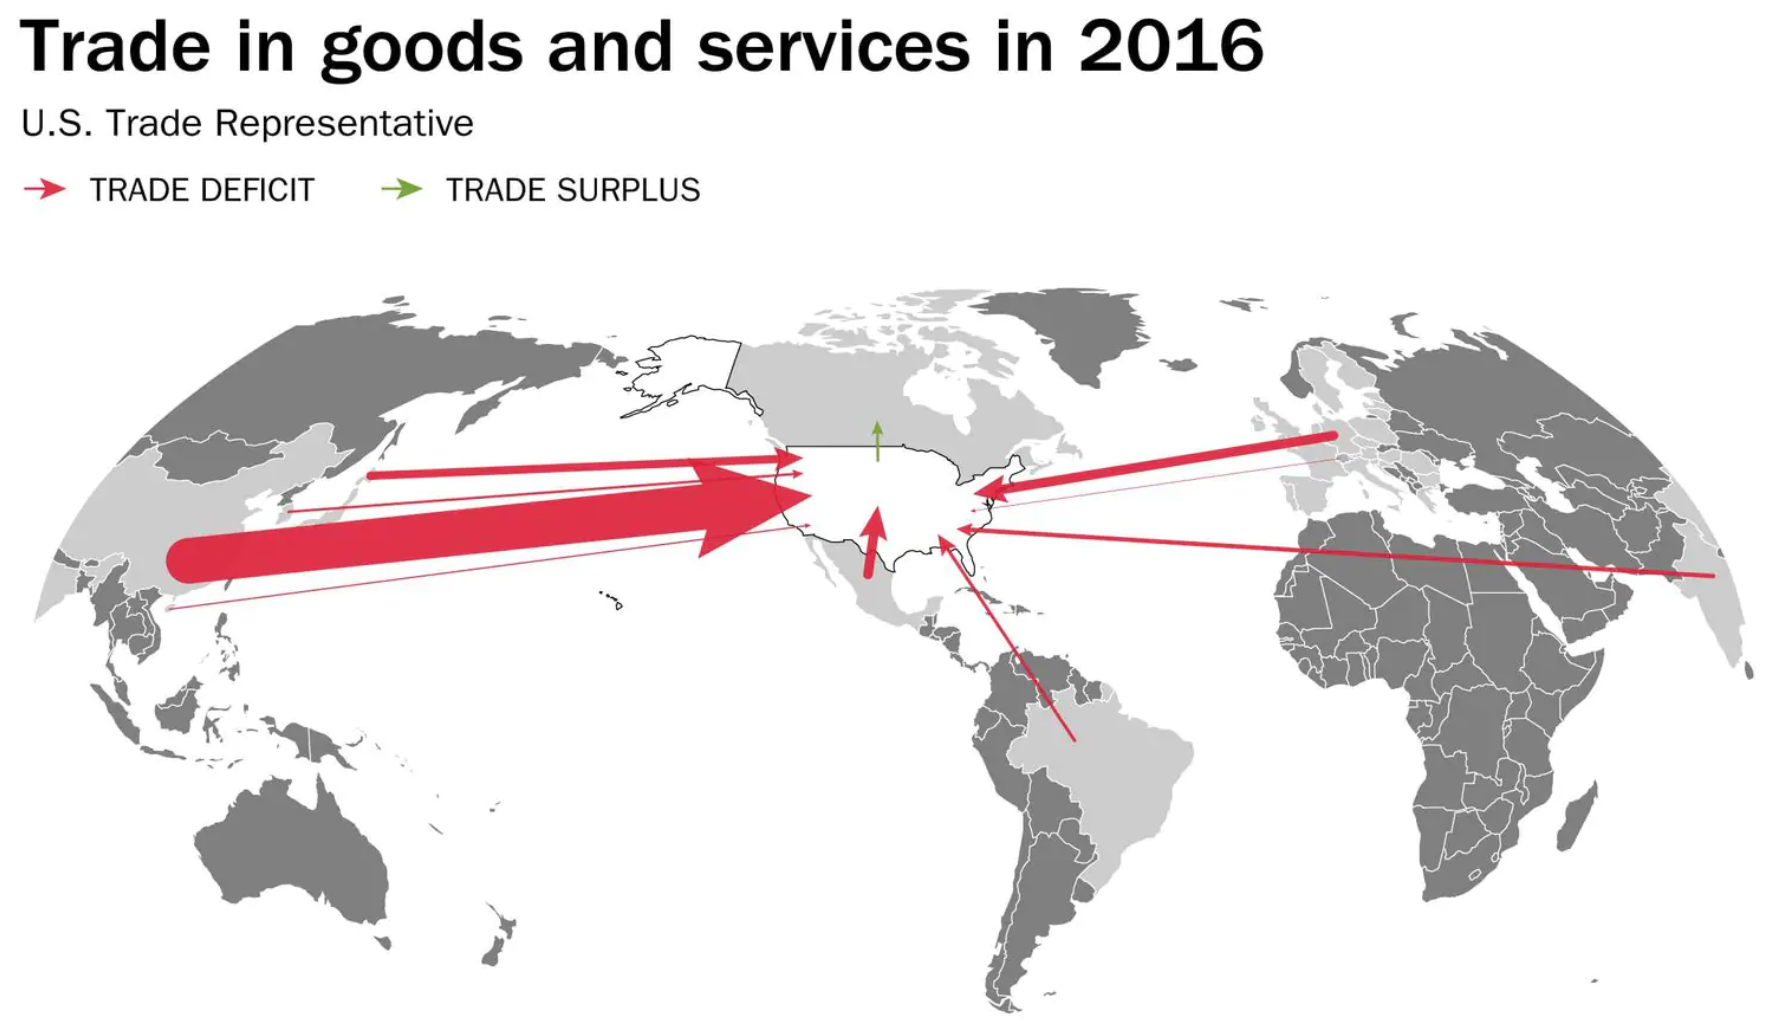
But the graphic also uses a pair of maps to look at that same goods vs. goods and services split.

The centre of it all…

Parts of the design of the map like the colours, meh. But the designers did a great job by breaking the standard convention of placing the Prime Meridian at the centre of the map. Instead, because the United States is the story here, the map places North America at the map’s centre. It does lead to a weird fracturing of the Asian continent, but so long as China is largely intact, that is all that matters to the trade story.

This all just goes to show that it is important to begin a conversation about policy with facts and understand the actual starting point rather than the perceived starting point.

Credit for the piece goes to Philip Bump.

Turning the Midwest Red

Continuing with election-y stuff, I want to share a fascinating map from the Washington Post. The article came out last week, and it is actually incredibly light in terms of data visualisation. By my count, there were only two maps. The article’s focus is on interviews with Trump voters in 2016 and how their opinions of the president have changed over the last year or so. If you want to read it, and you should as it is very well written, I will warn you that it is long. But, to the map.

I may have used an even lighter shade for 2012 counties…

What I loved about this map is how it flips the usual narrative a bit on its head. We talk about how much a candidate won a county in 2016, or even how much the vote shifted in 2016. And anecdotally we talk about “ancestral Democrats” flipping to Trump. But this map actually tries to chart that. It reveals the last time a county actually voted for a Republican presidential candidate—the darker the red, the further back in time one has to go.

Counties that vote Democratic are white, because why do we need them for this examination. Omitting them was a great design decision. Much of the country, as we know or can intuit, voted Republican in 2012 for Mitt Romney. But what about before then? You can see how the upper Midwest, along the Mississippi River, was a stronghold for Democrats with some counties going as far back as the 1980s or earlier. And then in 2016 they all flipped and that flipping was most significant there—of some additional interest to me are the counties in Maine, the Pacific Northwest, and along Lake Erie near Cleveland.

In short, this was just a brilliantly done map. And it sets the tone for the rest of the article, which is interviews with residents of those counties called out on the map.

Credit for the piece goes to Andrew Braford, Jake Crump, Jason Bernert and Matthew Callahan.

Pennsylvania Primary Night

Surprise, surprise. This morning we just take a quick little peak at some of the data visualisation from the Pennsylvania primary races yesterday. Nothing is terribly revolutionary, just well done from the Washington Post, Politico, and the New York Times.

But let’s start with my district, which was super exciting.

The only thing to write home about is how the Republican incumbent dropped out at the last moment and was replaced by this guy…

Moving on.

Each of the three I chose to highlight did a good job. The Post was very straightforward and presented each office with a toggle to separate the two parties. Usually, however, this was not terribly interesting because races like the Pennsylvania governor had one incumbent running unopposed.

Mango is represented by what colour?

But Politico was able to hand it differently and simply presented the Democratic race above the Republican and simply noted that the sitting governor ran unopposed. This differs from the Post, where it was not immediately clear that Tom Wolf, the governor, was running unopposed and had already won.

Clean and simple design. No non-sense here.

The Times handled it similarly and simultaneously displayed both parties, but kept Wolf’s race simple. The neat feature, however, was the display of select counties beneath the choropleth. This could be super helpful in the midterms in several months when key races will hinge upon particular counties.

The Republican primary for the PA governorship has been ugly

But where the Times really shines is the race for Pennsylvania’s lieutenant governor. Fun fact, in Pennsylvania the governor and lieutenant governor do not run as a ticket and are voted for separately. This year’s Democratic incumbent, Mike Stack, does not get on with the governor and had a few little scandals to his name, prompting several Democrats to run against him. And the Times’ piece shows the two parties result, side-by-side.

Pennsylvania's oddest race this time 'round
Pennsylvania’s oddest race this time ’round

Credit for the Post’s piece goes to the Washington Post graphics department.

Credit for Politico’s piece goes to Politico’s graphics department.

Credit for the Times’ piece goes to Sarah Almukhtar, Wilson Andrews, Matthew Bloch, Jeremy Bowers, Tom Giratikanon, Jasmine C. Lee and Paul Murray, and Maggie Astor.

Kilauea Eruption

As a kid, volcanoes fascinated me. The idea that the molten core of the Earth can bubble its way up to and then erupt from the cold crusty surface of the planet still fascinates me. Of course, volcanoes can also have drastic impacts on people, both at the grand scale of impacting global climate to the smaller and more personal scale of someone’s home destroyed by a lava flow.

And unfortunately for residents of Hawai’i that personal destruction is unfolding across a development called Leilani Estates. The Washington Post has a nice piece detailing the geography of the area and showing how quickly things can change.

Earth is powerful
Earth is powerful

The article uses the photo above to illustrate the distance the lava flow travelled in only a few days. It also shows how precariously sited the homes are.

Only because I am so fascinated by these kinds of stories, I hope the Post continues to expand its content with pieces like this exploring the eruption and those of other volcanoes in the area.

Credit for the piece goes to Laris Karklis and Lauren Tierney.

To Infinity—

Wait, wrong film.

No, this weekend is Infinity War. Which is definitely not led by a Buzz Lightyear. For those of you who don’t know, Infinity War is sort of the culmination of ten years of Marvel superhero films, called the Marvel Cinematic Universe, that started with 2008’s Iron Man. Infinity War is the 19th film and brings together more than 30 main characters—and I believe I’ve read elsewhere as many as 85 when you count minor/side characters—into one two-part film. Yes, this will undoubtedly end on a cliffhanger leading into next year’s film.

If we assume each film is two hours (and I don’t think a single one has been under two hours), we are talking about 38 hours of film to watch to catch up before Friday’s release. Because both the previous Avengers films were 2h20m, I think we can round that up to at least an even 40. You know, a full work week.

Well, if your bosses won’t let you watch Marvel films all week, the Washington Post put together a nice interactive timeline that tries to sum it all up for you.

All the characters…but far from true.

What is really neat about the piece, beyond helping me recall just what happened ten years ago, you can filter the timeline based on character and major plot points.

What would be really neat, though I assume someone has already done it, is a social network map showing how all these disparate groups were before this weekend’s film. Get on that, internet.

Credit for the piece goes to Sonia Rao and Shelly Tan.

Tech Economies in the USA

Earlier this March the Washington Post published a piece looking at the twenty finalist contenders for the second Amazon headquarters. Specifically it explored how the cities rank in metrics that speak to a city’s technology and innovation economy.

That in and of itself, while incredibly fascinating, is not noteworthy in and of itself. Though I will say the article’s online title is neatly presented, split half-and-half with the vertical graphic showing the cities ranked.

I really like how this title space received a special design.

But the point that was really neat was the interactivity that followed. Here you can see a dropdown from which the user selects a city of interest—surprise, surprise we are looking at Philadelphia. From that point on, the piece keeps the selected city highlighted in every graphic that follows.

Looking at Philly
Looking at Philly

Again, that is nothing truly surprising, but it is neat to see. What would have taken it to the next step is if each of those associated paragraphs were tailored to the specific city. Instead, they appear to be general paragraphs.

But overall, it does a really nice job of comparing the twenty cities—it’s actually fewer because both Washington and New York have multiple sites per metro area—across the different metrics.

The only part that left me scratching my head a bit was the colour choice. I am not certain that it needs the blue-green to yellow-green palette. Those colours seem defined by a city’s placement on the overall list and I am not convinced that the piece would not have still worked if they had been only a single colour, using another colour to define the selected city.

Credit for the piece goes to Darla Cameron and Jonathan O’Connell.

Pennsylvania 18th Congressional District: The Special Election

Today is Tuesday, 12 March. And that means a special election in the 18th congressional district of Pennsylvania, located in the far southwest of the state, near Pittsburgh.

Long story short, the district is uber Republican. But, the long-time Republican congressman, the avowedly pro-life type, was caught urging his mistress to abort their unborn child. Needless to say, that did not go over so well and so he resigned and now here we are with a veteran state legislator and veteran who calls himself “Trump before there was Trump” running for the Republicans and another veteran but also former federal prosecutor involved with fighting the opioid epidemic running for the Democrats.

Now about that uber Republican-ness. It is so much so that Democrats didn’t even run candidates in 2014 and 2016. And then in 2016, Trump won the district by 20 percentage points. But the polls show the Republican, Rick Saccone, with a very narrow lead within the margin of error. That in and of itself is tremendous news for Democrats in Pennsylvania. But what if Conor Lamb, the Democrat, were to actually somehow pull off a victory?

Well the Washington Post put together a great piece about how it really might not matter. Why? Because of that whole redistricting thing that I talked about. Neither Saccone nor Lamb live in the district that will replace today’s 18th.

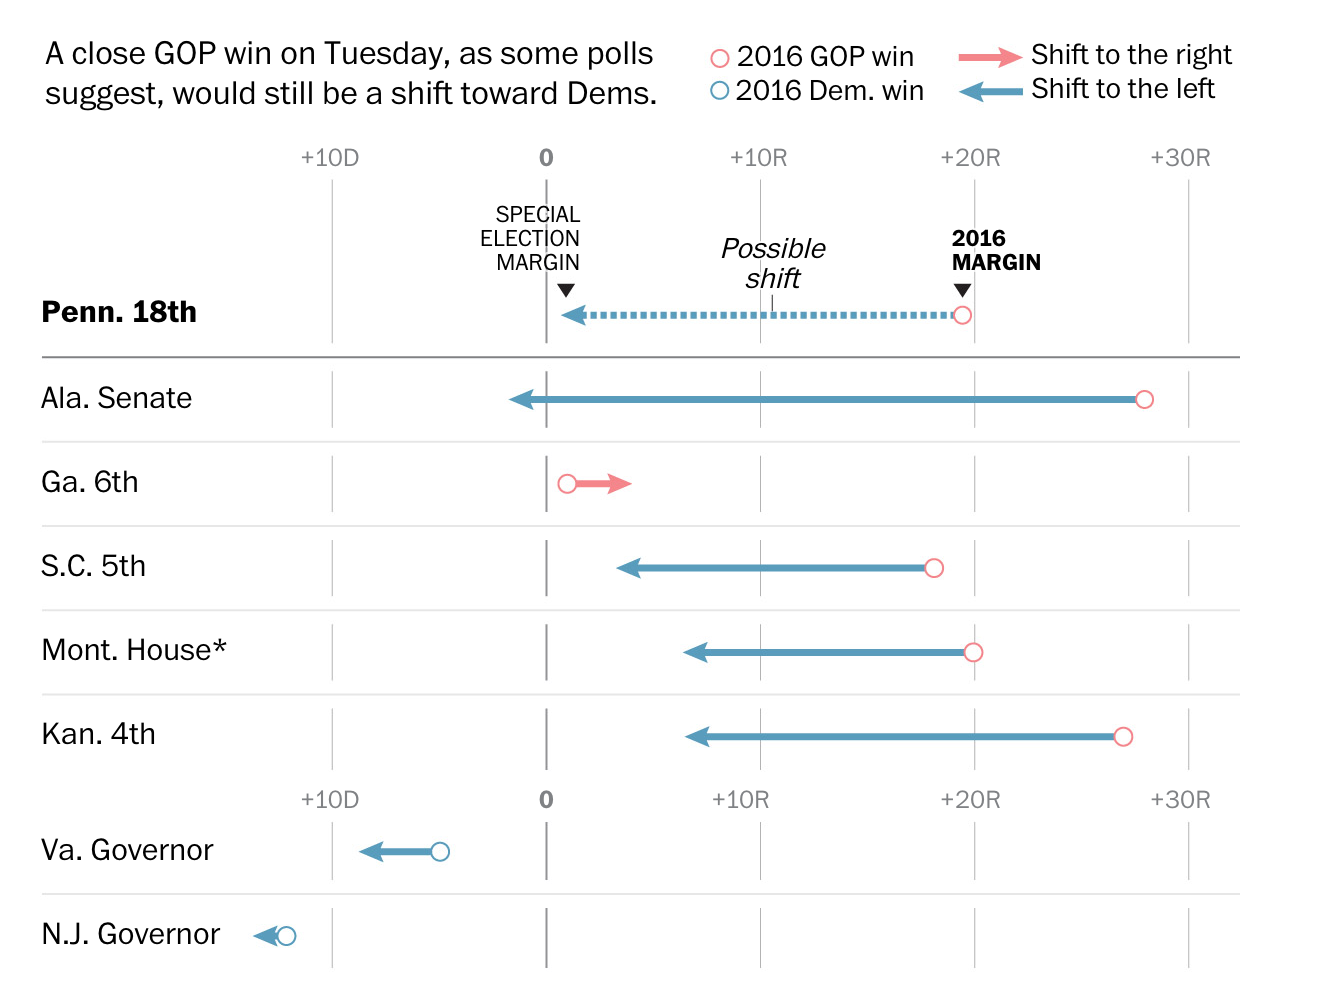
The piece has several nice graphics showing just how much this area of the state will change and how that will impact these two candidates. But my favourite piece was actually this dot plot.

That's an enormous gap for Lamb to overcome
That’s an enormous gap for Lamb to overcome

It speaks more to today’s election than the future of the district. Everyone will undoubtedly be looking to see if Lamb can eke out a victory of Saccone this evening. But even if he loses narrowly, the Democrats can still take a glimmer of hope because of just how insurmountable the challenge was. It would require an enormous swing just to crack 50.1%.

Credit for the piece goes to Reuben Fischer-Baum and Kevin Uhrmacher.

Gerrymandering Pennsylvania Part IV

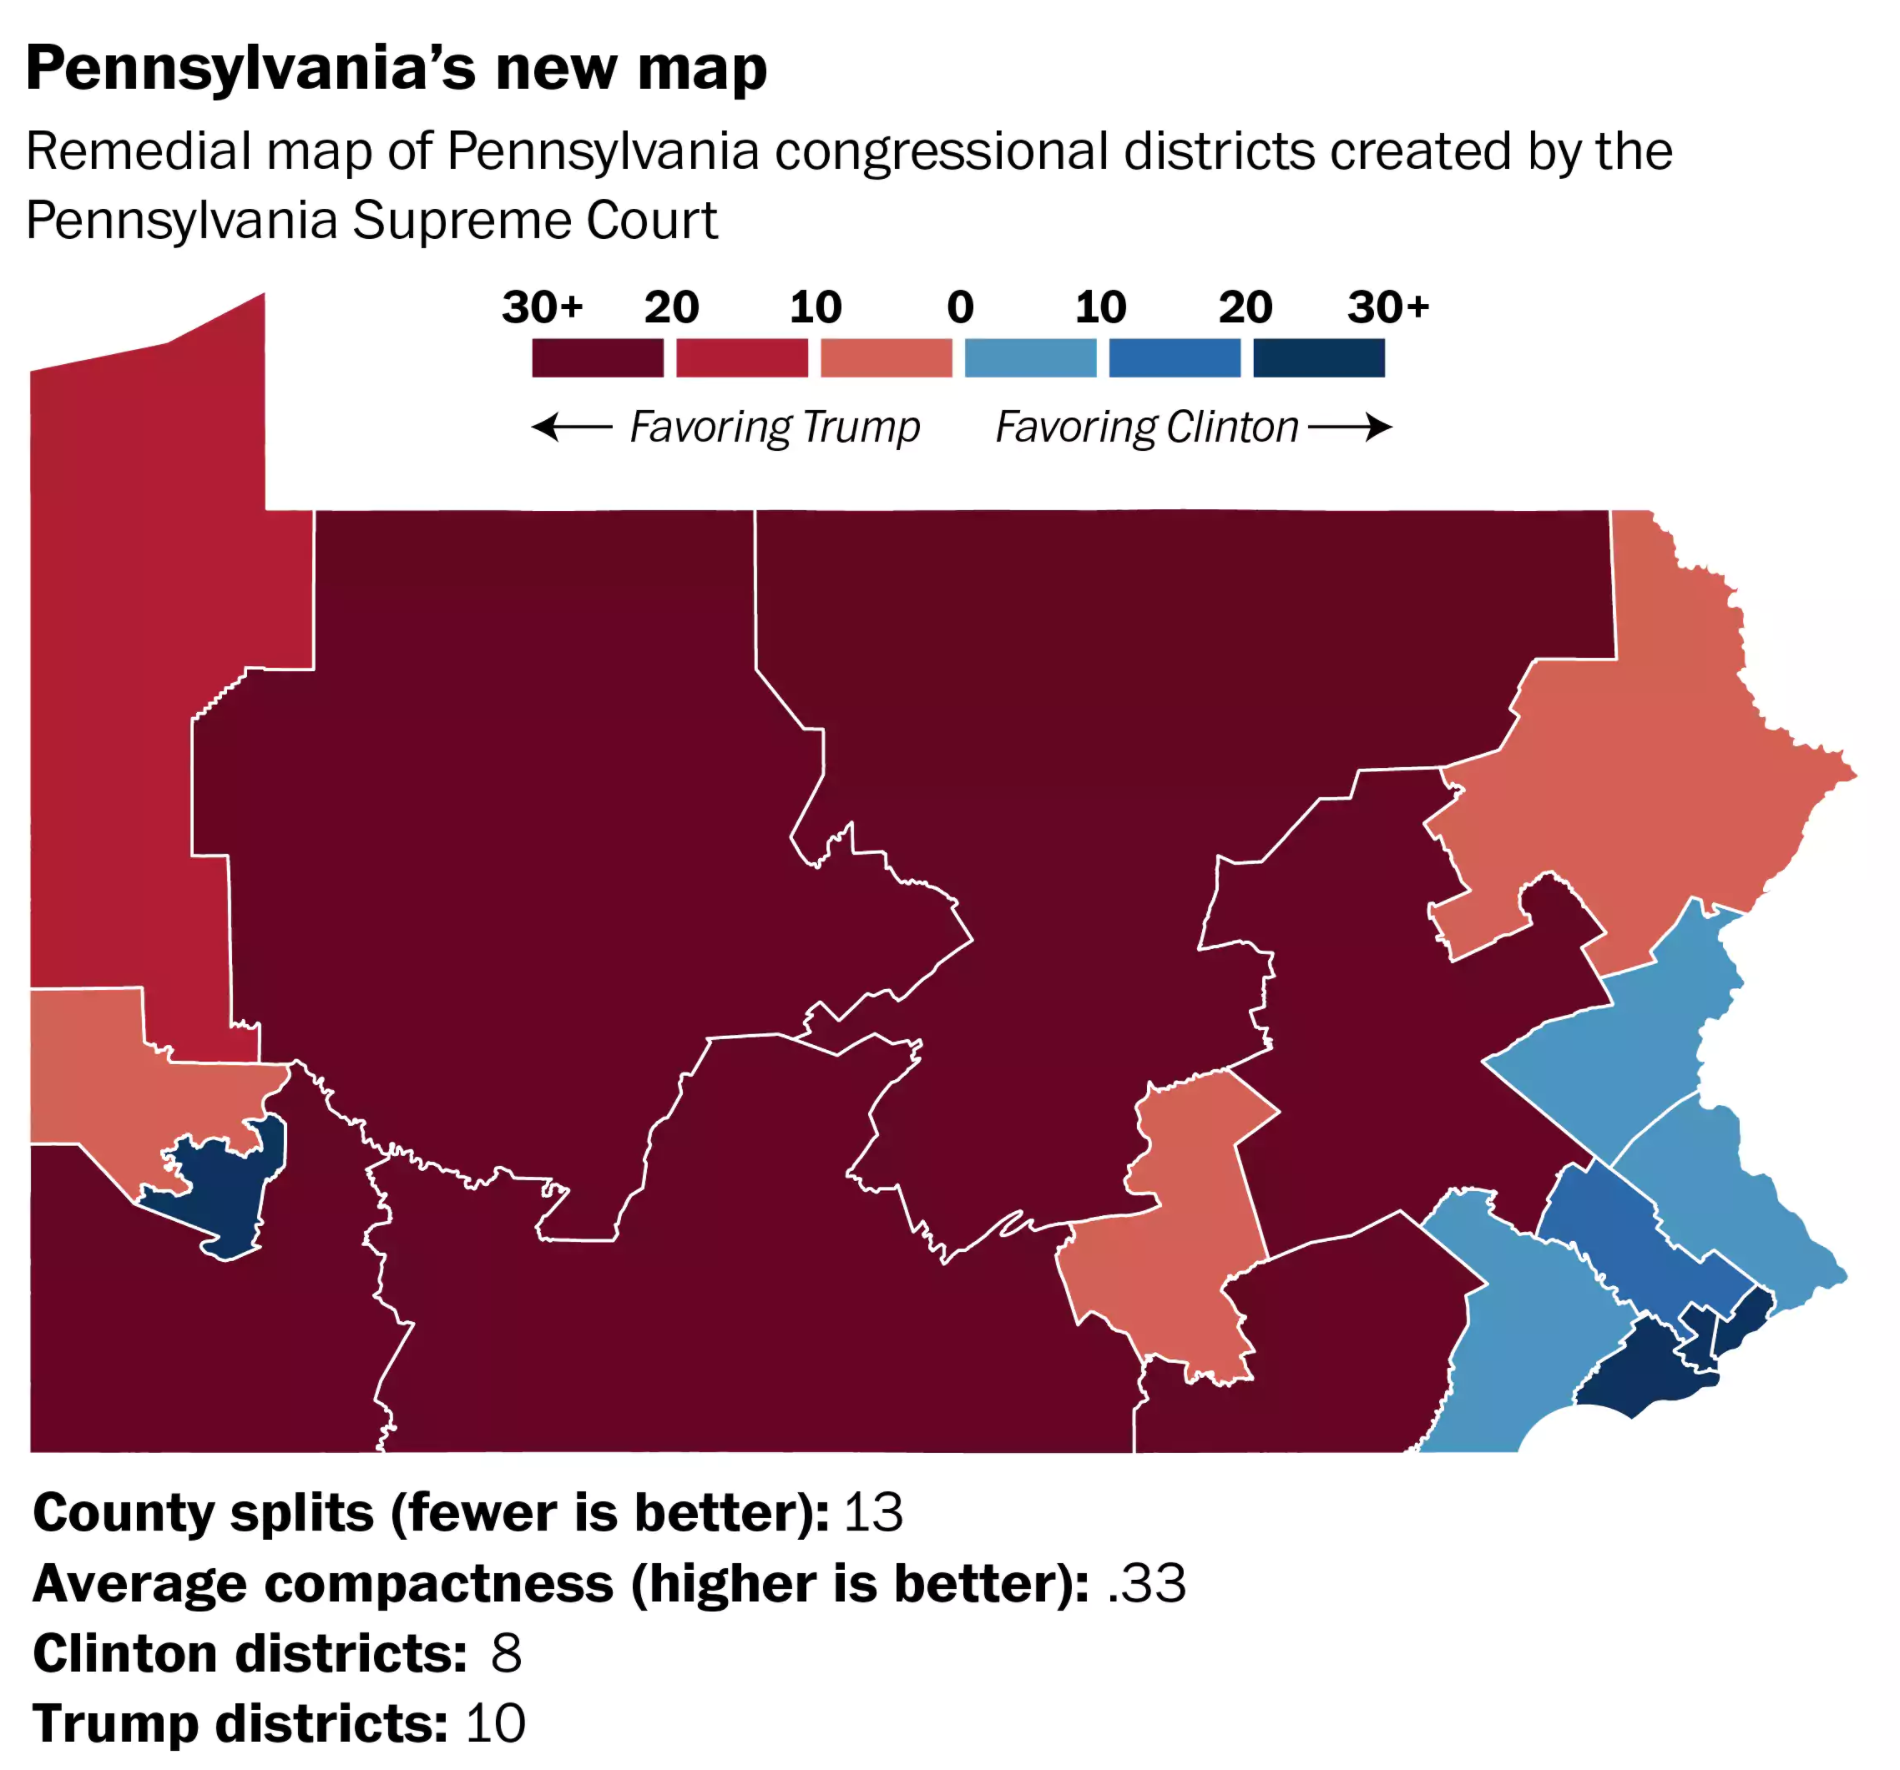
Yesterday the Pennsylvania Supreme Court published the new congressional district map of Pennsylvania, the latest chapter in this tale. Republicans in the state legislature have already said they will take this to the federal courts, but they tried that just a few weeks ago and the Supreme Court refused to hear the case.

So the Washington Post put together a map showing precinct-level data aggregated to the new borders and the result is a far more competitive map. Despite there being more Democrats in Pennsylvania, overall the map still remains leaning towards Republican, but there are more light blue and red, again meaning competitive, districts to be fought over.

Well now we have some sensible lines…

I did hear on the radio this morning, however, that one implication will be in the new Pennsylvania 4th, which is comprised mainly of the Philadelphia suburban county of Montgomery. Right now, that area is so gerrymandered that there is not a candidate right now living with the new borders.

Credit for the piece goes to the Washington Post Wonkblog.