Sugary Sweet Donut Charts

I know, I know. You probably expect some sort of climate post given the whole Paris thing. But instead, this morning I came across an article where the supporting chart failed to tell the story. So today we redesign it.

The BBC has an article about MPs backing a tax on sugary drinks. Within the text is a graphic showing the relative importance of sugary drinks in the sugar consumption of various demographics. Except the first thing I see is alcohol—not the focus of the article. Then I focus on a series of numbers spinning around donuts, which are obviously sugary and bad. Eventually I connect the bright yellow to soda. Alas, bright yellow is a very light colour and fails to hold its own on the page. It falls behind everything but milk products.
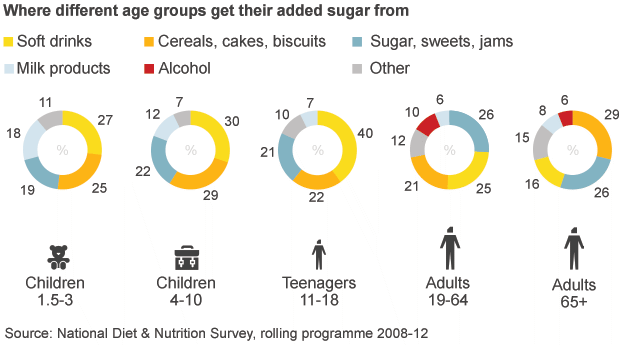
The BBC likes sugary donuts

So here is 15 minutes spent on a new version. Gone are the donuts, replaced by a heat map. I kept the sort of the legend for my vertical because it placed soda at the top. I ran the demographic types horizontally. The big difference here is that I am immediately drawn to the top of the chart. So yeah, soda is a problem. But so are cakes and jams, you British senior citizens. Importantly, I am less drawn to alcohol, which in terms of sugars, is not a concern.
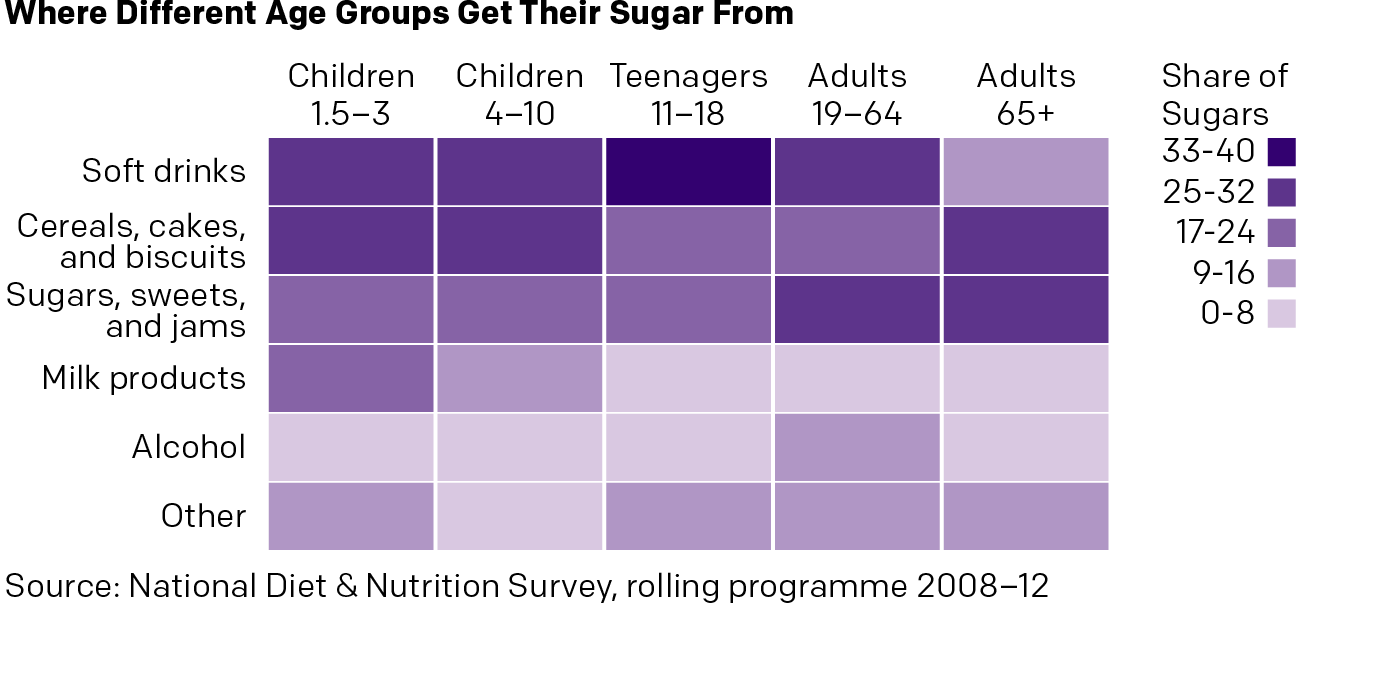
My version of sugar is so much sweeter

Credit for the original goes to the BBC graphics department. The other one is mine.

What do People Look for on Black Friday?

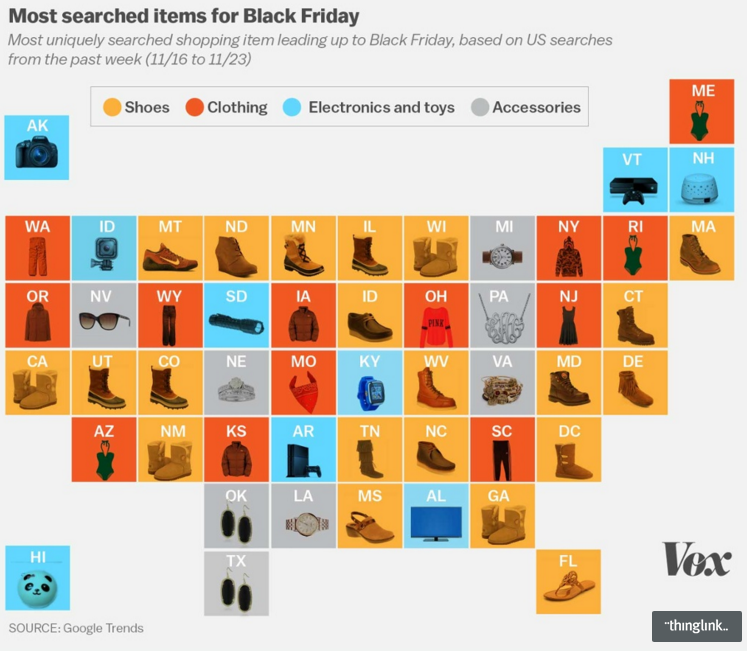
Well, today is Black Friday. And so there were probably lines at the door of your local department store at the wee early hours of the morning. But I was working, and partly to bring you this. Google has data on what each state searches for the most. And Vox turned that into a map. Turns out a lot of you want boots.

All the boots
All the boots

Credit for the piece goes to Javier Zarracina.

A Royal Nation

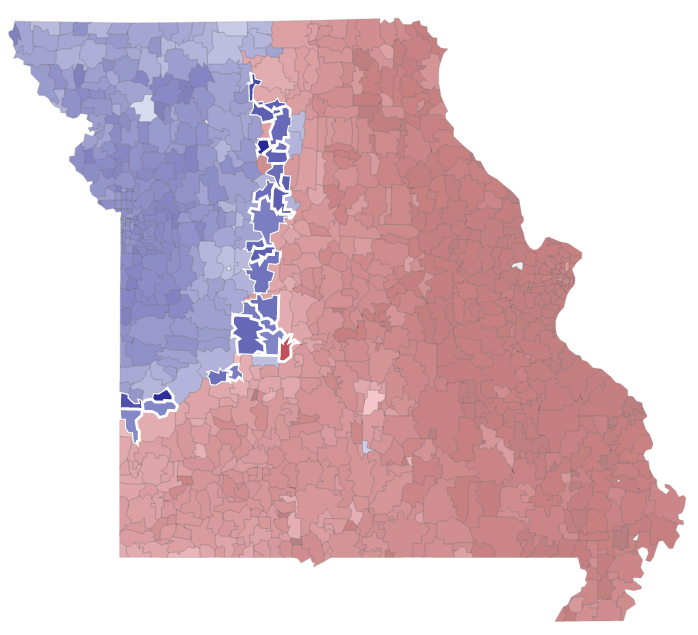
You may recall a year and a half ago a post I wrote up about a New York Times piece looking at the fandoms of baseball in the United States. Well fresh off their hometown Royals’ World Series victory, the folks at the Kansas City Star revisited the graphic—driven by Facebook likes—to see if there had been any change. Sure enough, Royals Nation—or whatever they call it—has made inroads into what was before St. Louis Cardinals territory.

Missouri is a little more blue these days

The only sad part about the article is that they talk of changes in adjacent states, e.g. Kansas, but have no maps for those.

Credit for the piece goes to Jay Pilgreen.

Friday Night in Paris

So Paris happened. But the question is how exactly? Thankfully the New York Times are on it as they try to explain Friday night.

A diagram of the events inside Bataclan theatre

Worth pointing out the list of credits below. Clearly the piece was a team effort.

Credit for the piece goes to Gregor Aisch, Wilson Andrews, Larry Buchanan, Jennifer Daniel, Ford Fessenden, Evan Grothjan, K.K. Rebecca Lai, Haeyoun Park, Yuliya Parshina-Kottas, Graham Roberts, Julie Shaver, Patrick J. Smith, Tim Wallace, Derek Watkins, Jeremy White, and Karen Yourish.

Making Sense of the Syrian Civil War

Well, I mean trying to is this piece by the Washington Post. Included are several diagrams at key phases of the conflict that attempt to show how the various parties interacted with each other.

Look at all the actors on stage…

Ultimately the key takeaway is that Syria is a mess and it is not getting any better. So let’s just add some more lines in there, am I right?

Credit for the piece goes to Denise Lu and Gene Thorp.

Job Gains

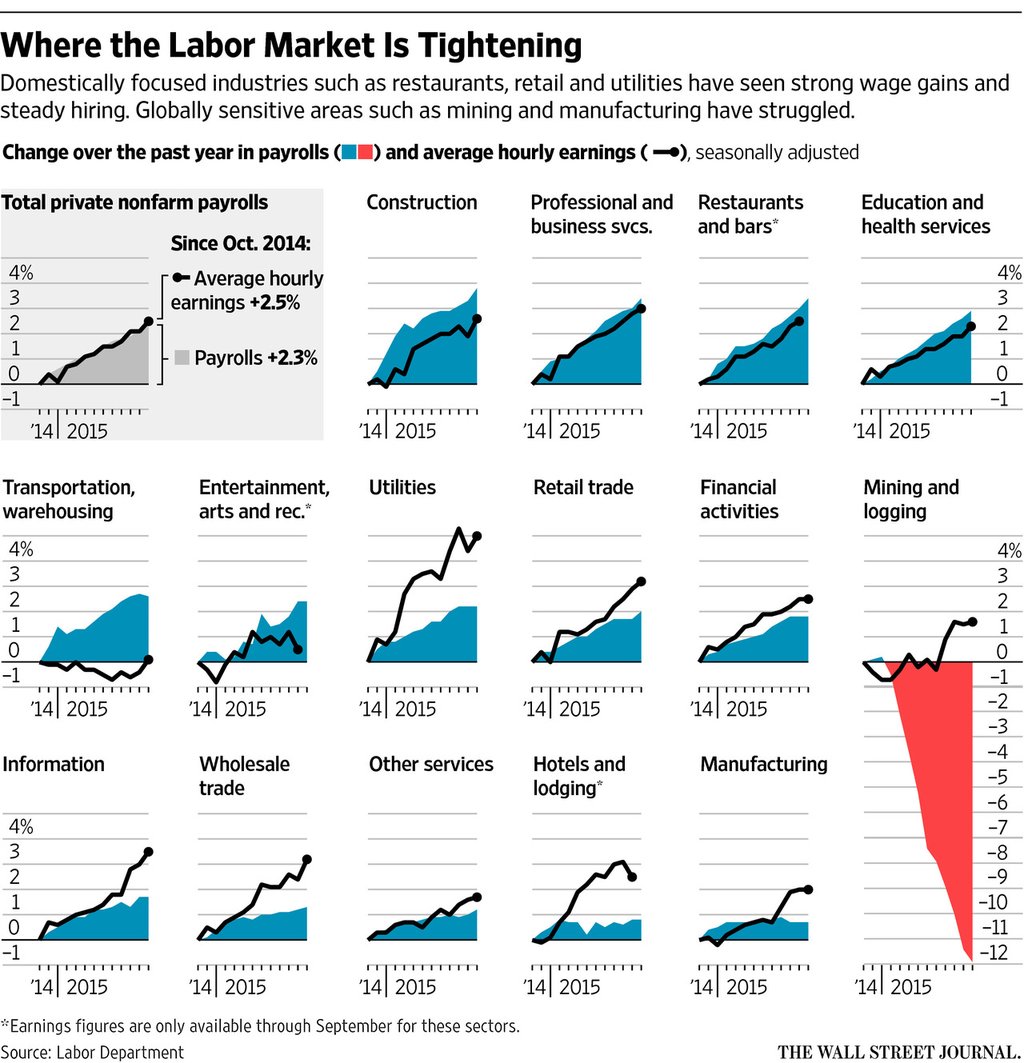
You should all know by now I am sucker for small multiples. So it should come as no surprise to you that I liked this piece from Friday from the Wall Street Journal. It looks at payroll and wage growth across various sectors in the American economy. And what I really like is that they took a space at the beginning to explain how to read the charts.

Mining, not so good
Mining, not so good

Credit for the piece goes to the Wall Street Journal graphics department.

The Future of Climate Change

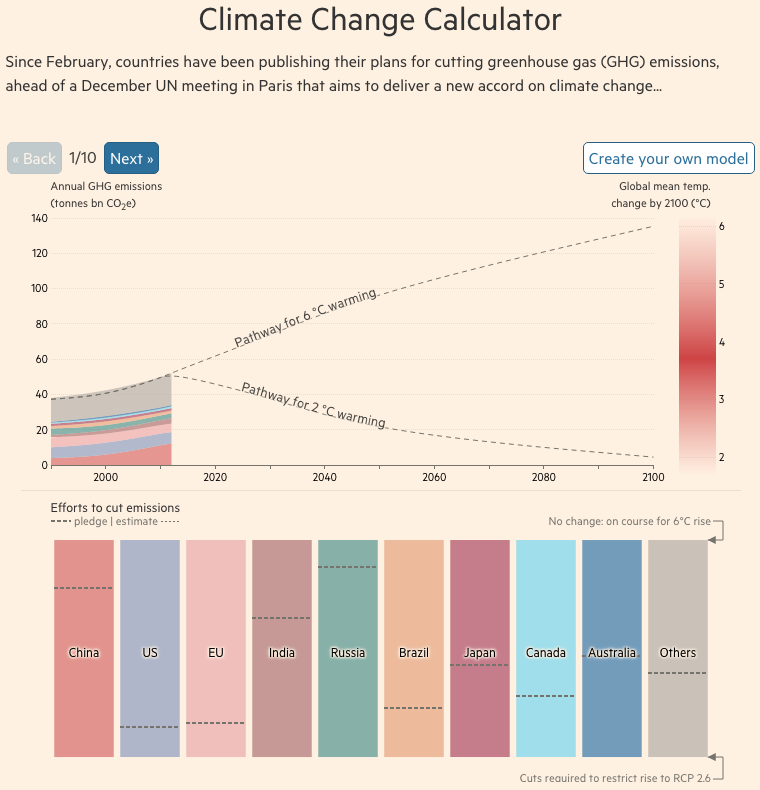
At the end of the month the world will gather in Paris, France for the next round of climate change talks. In advance of the talks, the Financial Times put together this model of how emissions reductions will help—or not—get climate change under control. The piece is two-fold. The first is a ten-step narrative that showcases the tool’s split of the time series into short-, medium-, and long-term impacts and how those work in the best and worst case scenarios. But it then allows the user to jump right on in and create their own scenarios.

Is it getting hot out there?

Credit for the piece goes to John Burn-Murdoch and Pilita Clark.

The Relative Value of Republican Primary Votes

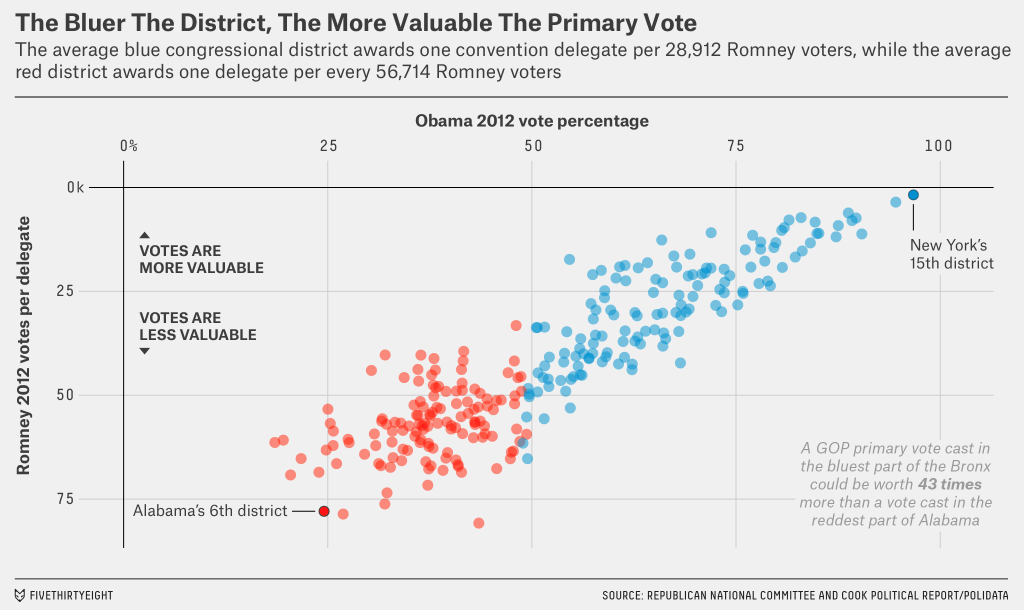
The day after Election Day—no, not that Election Day—we take a look at a nice scatter plot from FiveThirtyEight. They explore how an eventual conservative candidate, whoever that may be, will face a structural challenge. There are slightly more delegates at play in blue states than red. And typically those blue Republicans are “less religious, more moderate and less rural.” The big graphic supporting their argument looks at the value of the primary votes. Surprise, surprise, the higher-value primary votes come from blue states.

The relative value of the votes

Credit for the piece goes to the FiveThirtyEight graphics department.

Redesigning the Turkish Election Results

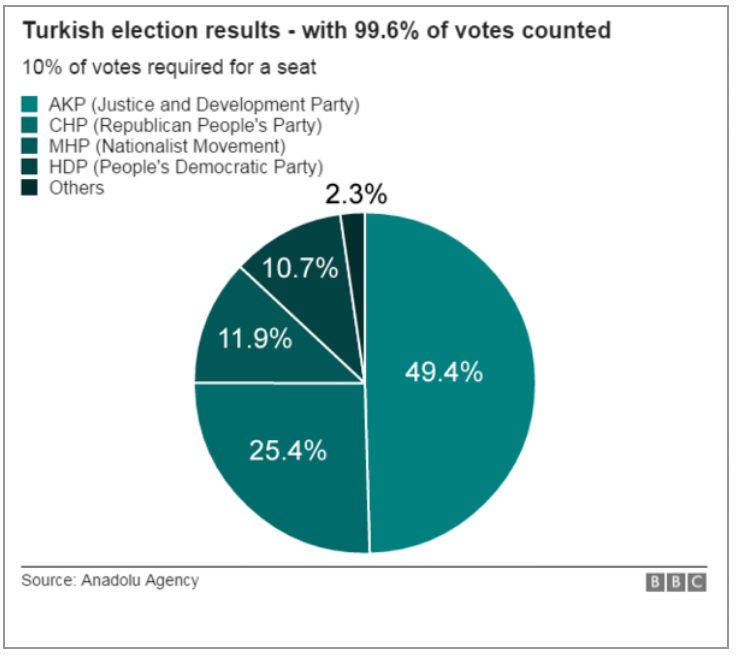
Turkey held its elections over the weekend. And so on the way to work this morning I decided to check the results on the BBC. And I saw this graphic—screenshot from my phone.

The BBC results
The BBC results

So I decided to scrap today’s blog post and instead spend all of five minutes tweaking this to make it a bit clearer. Or, a lot clearer. Simple little tweaks can make all the difference in data clarity. Now you can visually see the scale of difference in the votes. You also don’t need to refer to a legend off to the side with tints of the same colour.

My results with their data

Credit for the original piece goes to the BBC graphics department.