The Intersection of Geography and Politics

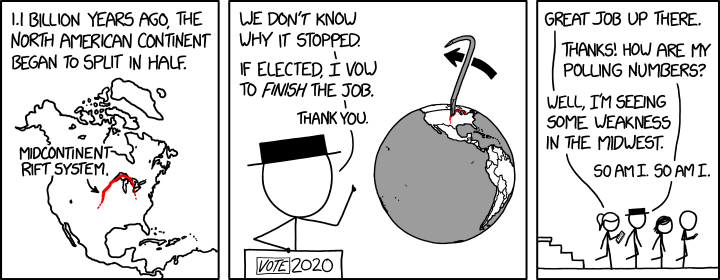
We made it to the end of the week, everybody. And to help celebrate, xkcd posted a little comic that contains two of my favourite subjects: geography and politics. In particular, the piece looks at the 2020 election and plate tectonics.

Break it all apart
Break it all apart

One doesn’t often hear of the Midcontinent Rift System.

Credit for the piece goes to Randall Munroe.

The Changing Shape of Anak Krakatau

A few weeks ago we took a look at an interactive piece from the BBC that used a slider to show before and after photos of Anak Krakatau. For those that forget, that was the volcano that exploded and created a tsunami in Indonesia, which killed over 400 people. Well, geography is always changing and so has the shape of the volcano.

The BBC published a piece about two weeks ago that looked at new details from a Finnish radar satellite. These show how the crater of the volcano has been cut off from the ocean and is now a little lake.

Maybe not the most ideal lounging lagoon

This piece is not really revolutionary in its design. But it does provide a nice follow-up on a story that piqued my interest.

Credit for the piece goes to ICEYE.

Asteroids on the Moon

I hope everybody enjoyed their holiday. But, before we dive back into the meatier topics of the news, I wanted to share this serpentine graphic from the Guardian I discovered last week. Functionally it is a timeline charting the size of 96 known large asteroid impact craters on the Moon, between 80ºS and 80ºN.

Impacts on the Moon
Impacts on the Moon

The biggest question I have is whether the wrapping layout is necessary. I would prefer a more simplistic and straightforward, well, straight timeline, but I can imagine space constraints forcing the graphic into this box—either for the digital version and/or the likely print version.

The transparencies help to give a sense of density to the strikes, especially in the later years. And the orange ones highlight important or well-known craters like Tycho.

I do wonder, however, if the designer could have added a line at the 290 million years point. Since the graphic’s title calls that year out in particular, it might help the audience more quickly grasp the graphic’s…impact. In theory, the reader can more or less figure it out from the highlighting of the Ohm impact crater that is listed as 291 million years old. But a small grey line like those for the 250 million year increments could have been a nice little touch.

Overall, however, it’s nice to see a compact and helpful space graphic.

Credit for the piece goes to the Guardian graphics team.

The Atom

We made it to the end of the week, everyone. And that is worth celebrating. Today’s post is for all the scientists out there and anyone who has ever been interested in the atom. You know, the little things that make up matter. xkcd put together a chronological history of several different models of the atom that attempt to explain its structure.

I have to love that 538 model.

Credit for the piece goes to Randall Munroe.

Border Arrests

We move from one manufactured crisis to another today as we look at a piece by the Economist on the number of illegal immigrants arrested at the US southern border. Lately, here in the United States we have been hearing of an invasion on our southern border. Illegal immigrants streaming across the border. Except, that is not true. In fact, illegal immigration is at or near its lowest rate in recent years.

Note how few there have been in recent years…

The graphic does one thing really well and that is its unorthodox placement of the map. Instead of the usual orientation, here the designers chose to “tilt” the map so that the border segments roughly align with the sets of charts below them. I might have desaturated the map a little bit and cut off the gradient so Mexico does not bleed through underneath the bars, but the concept overall is really nice.

On the other hand, we have the bar charts arranged like funnels. This does allow the reader to see the slopes trending towards zero, however, it makes it incredibly difficult to see changes in smaller numbers. And without a scale on the axis, the reader has to take the bars and mentally transpose them on top of the grey bars in the bottom right corner. I wonder if a more traditional set of bar charts in small multiples could have worked better beneath the map.

Overall, however, I really do like this piece because of the way the map and the bar charts interact in their positioning.

Credit for the piece goes to the Economist Data Team.

What’s Next, Brexit?

A no confidence vote on Theresa May’s government, that’s what.

For those not familiar with parliamentary democracies, basically a no confidence vote is held when a substantial number of members of parliament have just that, no confidence, in the government of the day. The legislative body then votes and if the government wins, the government stays in power. If the government loses, typically, though not always, a new election is held to create a distribution of seats—it’s thought—that will yield a government that can hold the confidence. (There really is not an analogy for this in the US government that I can think of.)

To be fair, nobody really expects May’s government to collapse this afternoon. The Tories and her Democratic Unionist Party (a small Northern Irish party supporting the government) do not want to hold new elections nor do they want to give the Leader of the Opposition, Jeremy Corbyn, the chance to form his own government as much as they might despise May and her Brexit deal. So in all likelihood May survives by a dozen or so votes. On the other hand, the result yesterday was surprising in its scale, so could twenty or so of the 118 Tories who voted no vote against May? Possibly.

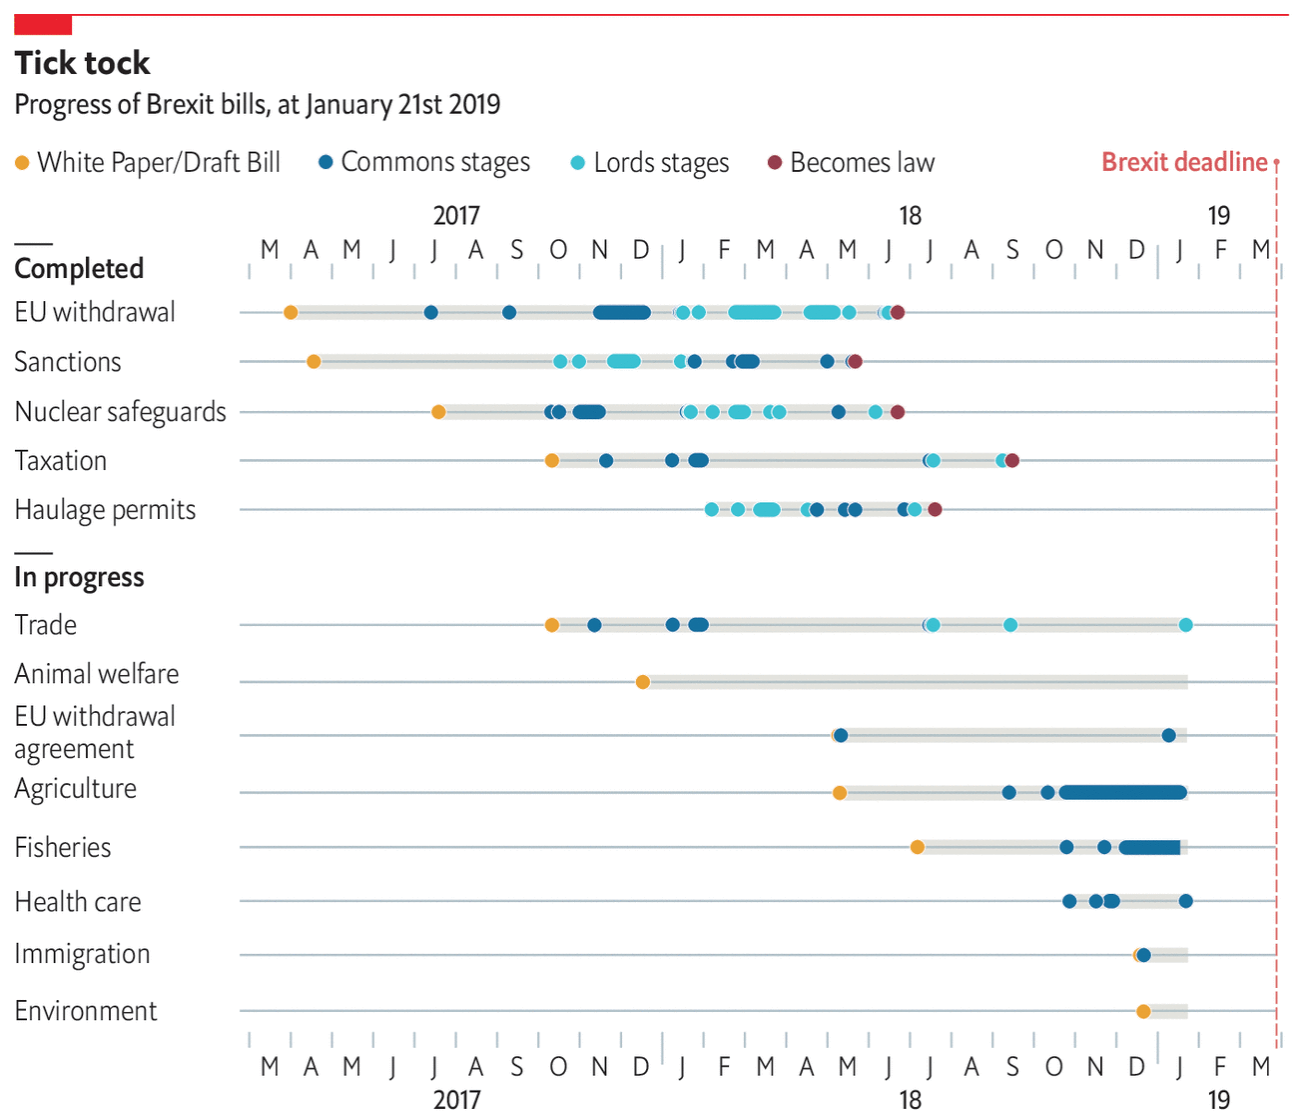
So then what next? Thankfully the Guardian put together two calendars showing just what happens and, crucially, in the context of how much time remains until the UK crashes out of the EU.

In case she wins, as we expect.

It still doesn't leave a lot of time to figure out what to do.
It still doesn’t leave a lot of time to figure out what to do.

If she loses, which is possible, but unlikely.

The UK would have even less time in this scenario.

The key thing to note is that the election campaign would eat up most of the time left and leave the UK very little time to do anything but ask the EU for an extension.

These are two small, but really nicely done graphics.

Credit for the piece goes to the Guardian’s graphics department.

The Brexit Deal Vote

Today’s (one of) the day(s). For those of you who haven’t followed Brexit, the British Parliament will vote this evening on whether to accept the deal Prime Minister Theresa May negotiated with the European Union…or not. And if not, well, the government now only has three—instead of the original 21—days to figure out a Plan B.

Of course this vote is only happening today because the government punted back in December when it was clear they were going to suffer a substantial loss. And back then, the BBC prepared this article about Brexit, where it was and where it was going. Funny thing is, after a month, not much has changed.

The screenshot below is of the process. As I noted above, the most critical change is that the government no longer has 21 business days to figure out what’s next. So instead of, to use the American football phrase, running out the clock, May will have to come up with something and present it to Parliament before 29 March, the day the UK leaves by statute.

How neat and orderly it must all seem…

I think the thing missing from the graphic is the chaos that happens if the deal is rejected. And while that may have been far from clearly the most obvious result two and a half years ago, it is now. And Parliament is scheduled to start voting around 19.00 GMT, or 14.00 EST for those of us on the East Coast or 13.00 CST for those of you in the Midwest.

Credit for the piece goes to the BBC graphics department.

The World Grows On and On

I mentioned this this time last year, but I used to make a lot of datagraphics about GDP growth. The format here has not changed and so there is nothing new to look at there. But, the content is still interesting. And the accompanying Economist article makes the point that high growth rates are not always what they seem. After all, Syria’s high growth rate is because its base is so small.

The 2019 GDP growth forecasts

Credit for the piece goes to the Economist Data Team.

New Plans for Old Subways

The New Yorkers among my readers know about the whole planned shutdown of the L train for repairs owing to Hurricane Sandy (tangentially mentioned in the graphic I commented upon yesterday). For those of you who don’t know, basically the salt water from the storm seriously damaged the tunnels and a whole lot of work needs to be done to repair them. The plan was that a segment of the line would be shut down, to no obvious insignificance to commuters along the route, and it would reopen in a year and a half.

Then the state governor realised that might be bad optics and since he controls the agency running the New York subway system, he cancelled the shutdown so engineers can look at a different type of design.

I love pieces like this one from the New York Times. They are not crazy and wide-ranging, instead we have illustrations to compare the plans. They do a really nice job complementing the story without overwhelming it.

The proposed design
The proposed design

Plus, I’m a sucker for train and infrastructure stories.

Credit for the piece goes to Anjali Singhvi and Mika Gröndahl.