During the pandemic, media reports of the rise of crime have inundated American households. Violent crimes, we are told, are at record highs. One wonders if society is on the verge of collapse.
But last night a few friends asked me to take a look at the data during the pandemic (2020–2021) and see what is actually going on out on the streets in a few big cities. Naturally I agreed and that’s why we have this post today. The first thing to understand, however, is that we do not have a federal-level database where we can cross compare crimes in cities using standardised definitions. The FBI used to produce such a thing, but in 2020 retired it in favour of a new system that, for reasons, local and state agencies have yet to fully embrace. Consequently, just when we need some real data, we have a notable lack of it.
At the very least we have national-level reporting on violent crimes and homicides, the latter of which is a subset of violent crimes. Though these reports are also dependent on local and state agencies self-reporting to the FBI. I also wanted to look at not just whether crime is up of late, but is crime up over the last several years. I chose to go back 30 years, or a generation.
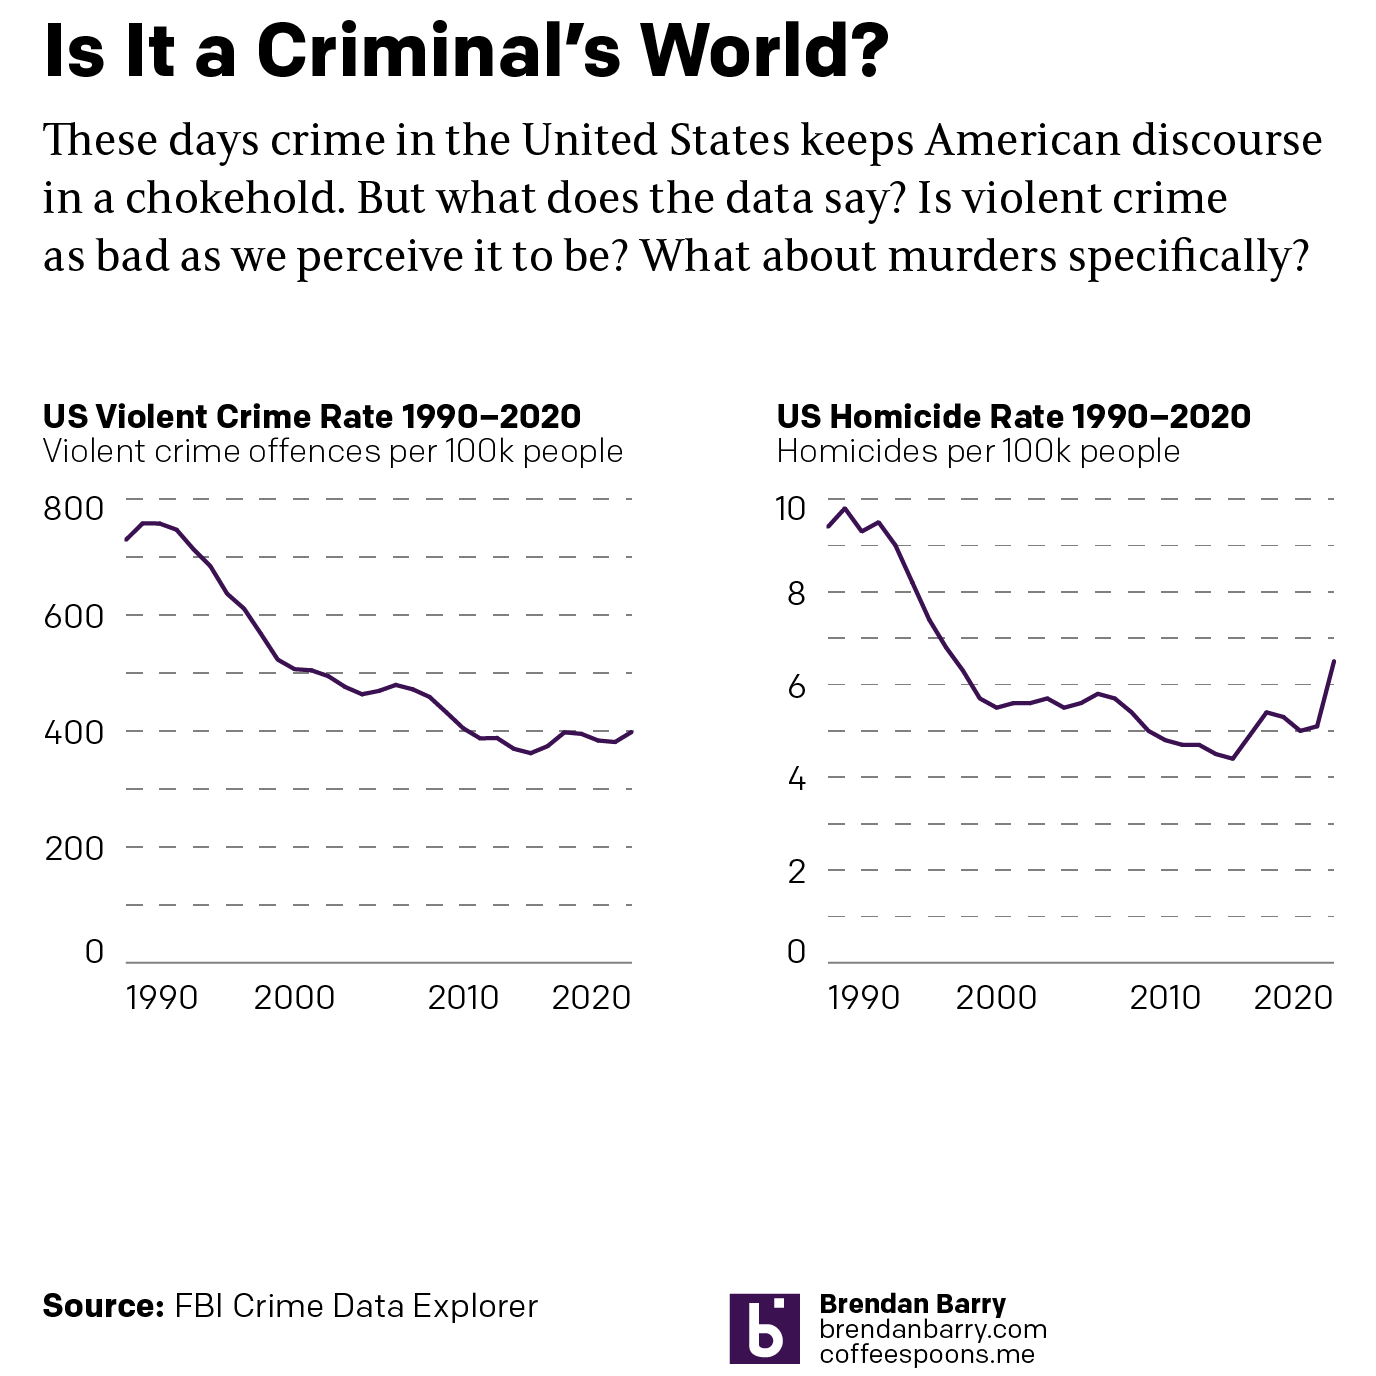
We can see one important trend here, that at a national level violent crimes are largely stable at rate of 400 per 100,000 people. Homicides, however, have climbed by nearly a third. Violent crimes are not rising, but murders are.
My initial charge was to look at cities and violent crime. However, knowing that nationally violent crimes are largely stable, the issue of concern would be how the rise in murders is playing out on American city streets. With the caveat that we do not have a single database to review, I pulled data directly from the five cities of interest: Philadelphia, Chicago, New York, Washington, and Detroit.
I also considered that large cities will have more murders simply by dint of their larger populations. And so when I collected the data, I also tried to find the Census Bureau’s population estimates of the cities during the same time frame. Unfortunately the 2021 estimates are not yet available so I had to use the 2020 population estimates for my 2021 calculations.
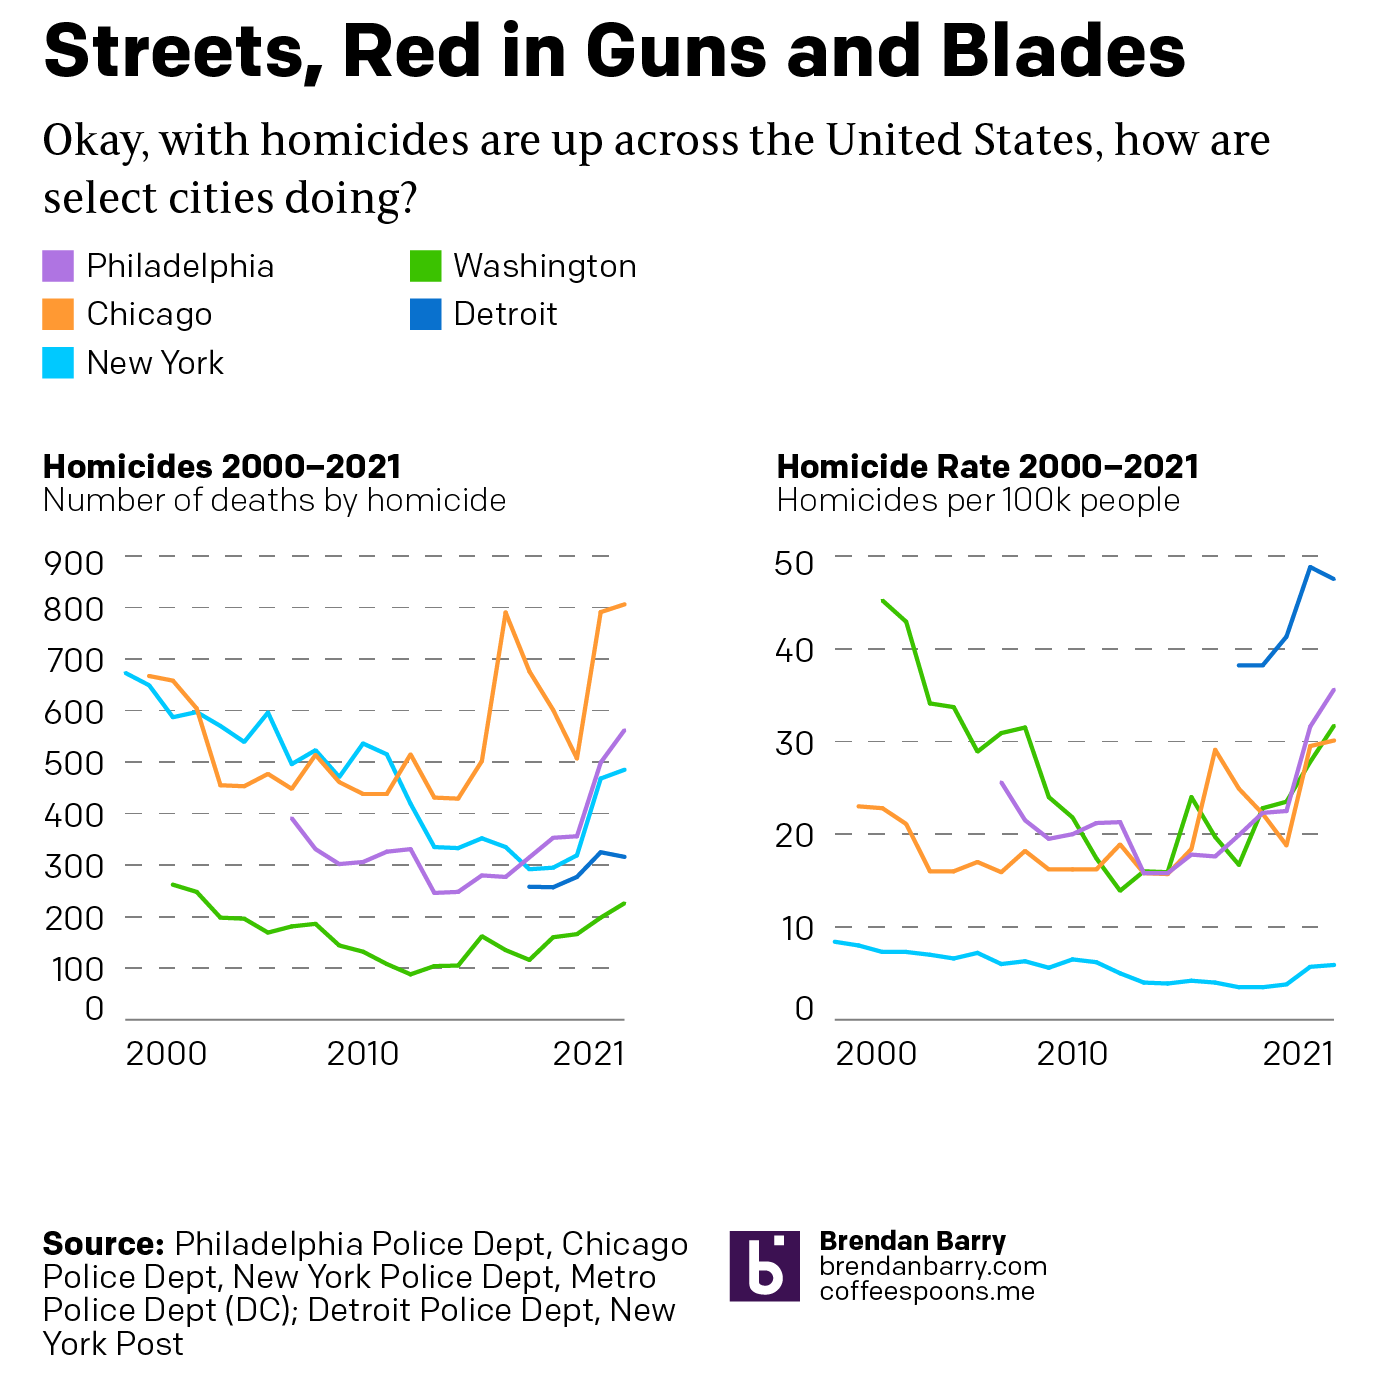
First we can see that not all cities report data for the same time period. And for Detroit in particular that makes comparisons tricky. In fact only New York had data back to the beginning of the century. Regardless of the data set’s less than full robustness we can see that in all five cities homicides rose in 2020 and 2021.
Second, however, if squint through that lack of full data, we see a trend at the city level that aligns with the national level. Homicides, tragically, are indeed up. However, in New York and Washington homicides are still below the data from near 2000 and at that time homicides already appear on a downward trajectory. I would bet that homicides were even higher during the 1990s and that the 2000s represented a long-run decline. In other words, whilst homicides are up, they are still below their peaks. A worrying trend, but far from the sky is falling.
That cannot quite be said for other cities. Let’s start with Detroit. Sadly we have too few years of data to draw any conclusion other than that homicides rose compared to the years preceding the pandemic.
That leaves us with Philadelphia and Chicago. Philadelphia has less data available and it’s harder to make a determination of what is happening. But we can say that since 2007, homicides have not been higher. If you look closely though, you can see how there does appear to be a downward trend at the beginning of the line. We do not have enough data like we do with New York and Washington, but I would bet homicides are up in Philadelphia, but still far short of what they were in the 1990s.
Chicago is the oddball. Yes, it saw a peak in homicides during the pandemic. But in 2016 the city didn’t miss the pandemic peak by much. In other words, homicides were staggeringly high in Chicago before the pandemic. If anything, we see a failure to combat high crime rates. But even before that spike in 2016, we see more of a valley floor in homicides. True, at the beginning of the century homicides appear to have trended down. But unlike the other cities here, homicides bottomed out at around 450 per 100,000 people. I’m not so certain we had a persistent, long-run decline in Chicago with which to start.
And like I said above, larger populations we would expect to have more murders because more potential criminals and victims. When we equalise for population we see the same trends as we expect—the city populations have been relatively stable over the last 20 years. Instead what we see is that relative to each other murders are more common in some cities and less so in others.
New York is a great example with nearly 500 murders last year, a number on par with Philadelphia. But New York has over 8 million inhabitants. Philadelphia has just 1.6. Consequently New York’s homicide rate is a surprisingly low 5.9 per 100,000 people. Philadelphia’s on the other hand? 35.6.
Philadelphia is near the top of that list, with Washington and Chicago having similar, albeit lower, rates at 31.7 and 30.1, respectively. But sadly Detroit surpasses them all and is in league of its own: 47.5 in 2021.
Credit for the pieces is mine.
Leave a Reply
You must be logged in to post a comment.