It’s Warm Out Here Isn’t It?

I could have covered the pieces on Gorsuch or the budget—and we will get to those—but I wanted to cover some data released by the World Meteorological Organisation that puts 2016 as the warmest year on record.

But that’s cool, climate change is a hoax.
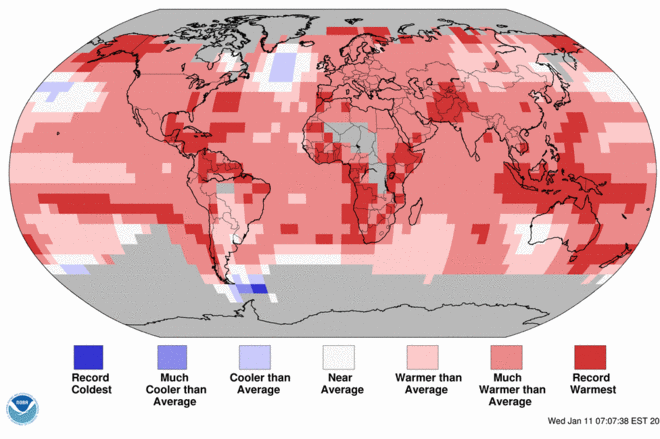
January was warm
January was warm

The graphic comes from a BBC article covering the news, and is a reuse of work from the National Oceanian and Atmospheric Administration. It portrays how much this past January deviated from long-term averages. Because, and I am probably preaching to the choir, remember that day-to-day highs, lows, and precipitation are weather. Longer term trends, patterns, and averages are evidence of climate.

Just so happens that today is also supposed to be the warmest day of the week here in Philadelphia.

Credit for the piece goes to NOAA.

Undocumented Irish Immigrants

You know, I was trying to find a nice and funny graphic that related to the Irish for today since today is St. Patrick’s Day. But, I keep circling back to that piece I posted last year. Because, unfortunately, these are not terribly uplifting times.

We make a great big deal about how we need to enforce deportation orders and build walls to keep out Mexicans and others from Latin America. But, the Irish are a far smaller, but still significant ethnic group that tends to arrive here and stay here in an undocumented fashion.

And somehow—though on this I would love to be wrong—I think the United States would generally make a bigger deal about Peter O’Toole being deported to Donegal than Pedro Toledo to Durango.

The point is that these are all people. And the Statue of Liberty does not say: “Give us your, wealthy, high-points earned on a merit system, looks like you and me, believes like you and me, and ready to contribute to society.”. No, it says, “Give us your tired, your poor, your huddled masses yearning to breathe free, the wretched refuse of your teeming shore. Send these homeless, tempest-tost to me, I lift my lamp beside the golden door.”

Surely that lamp wasn’t meant to flicker only a greenish glow.

That's a lot of people
That’s a lot of people

Wilders Wilts in the Netherlands

It’s a tulip joke, get it? Because the Netherlands.

The point of today’s piece is that Geert Wilders, the anti-EU, anti-Muslim, populist leader of the Dutch Freedom Party did not upset Prime Minister Rutte’s People’s Party for Freedom and Democracy (VVD), a centre-right party. Wilders had threatened to upset the status quo in the Netherlands earlier in the electoral season, but had come under pressure in recent weeks and days. He did, however, manage to come in second. Although its radical platform makes it highly unlikely to enter into any coalition government.

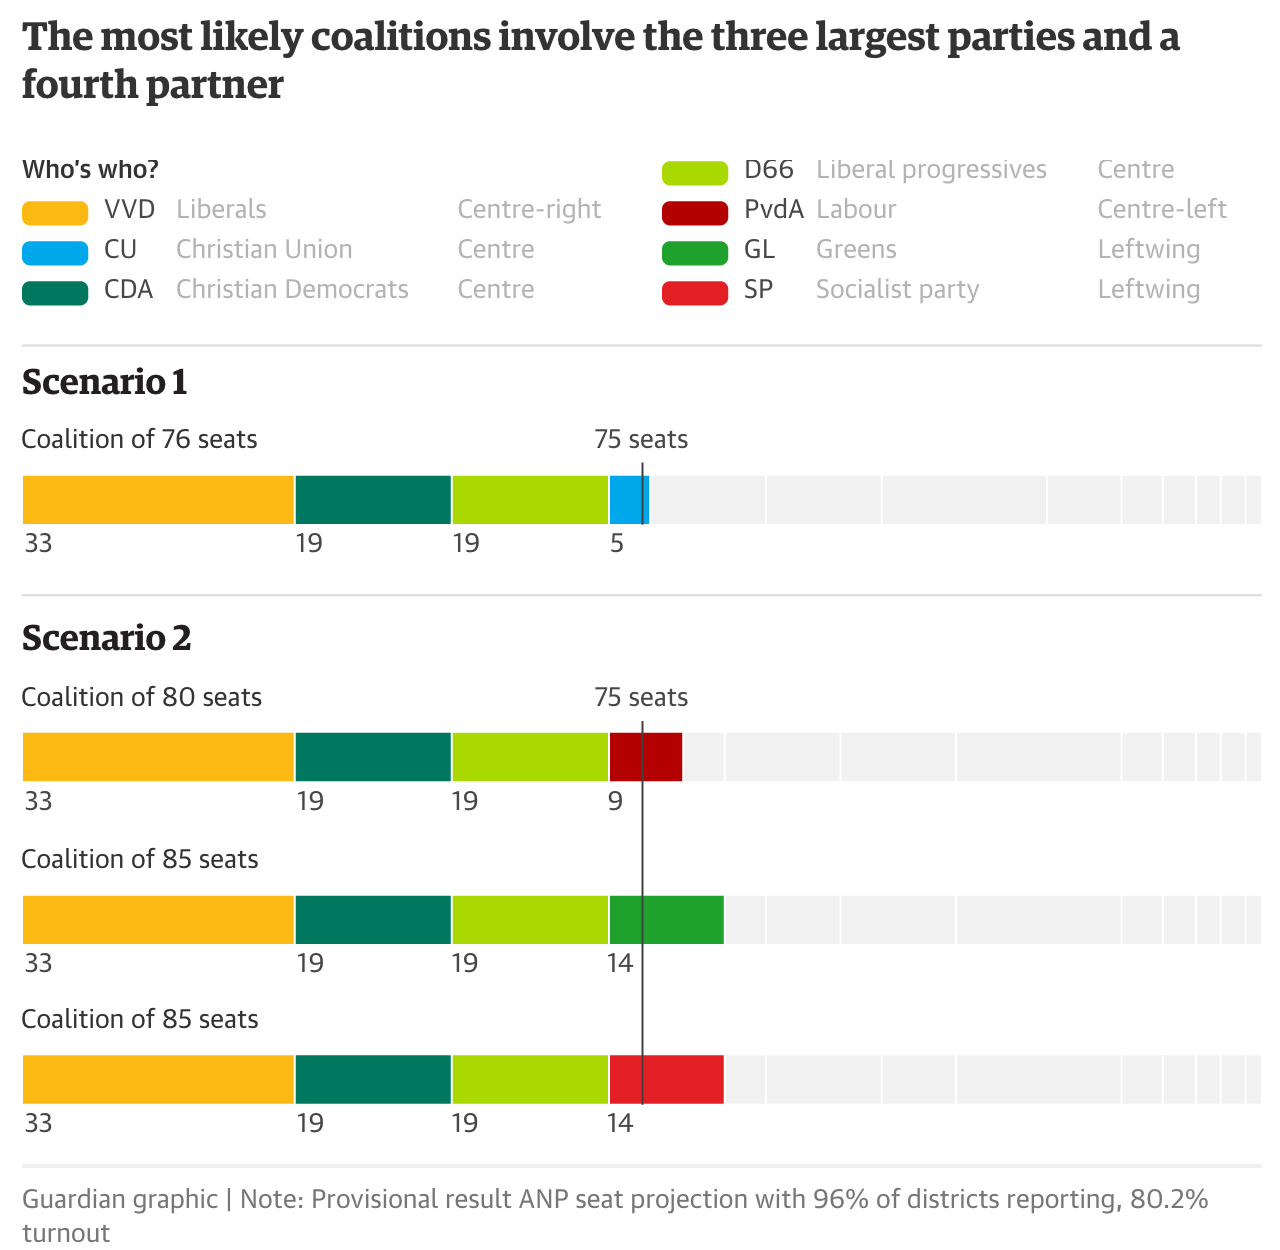
And speaking of coalition government, that is the Dutch way. With over a dozen parties competing for 150 seats, Rutte’s VVD looks to have won 33 seats—final results are expected in a few days’ time. Consequently, he will need the support of other parties to govern. And that gets us to today’s piece from the Guardian, a look at a few potential coalition scenarios. (As you probably know, I’m a huge fan of coalition governments.)

Which collection of colours will cross the finish line?

As you know I’m not a huge fan of stacked bar charts, but in this case the form works well. After all the point in this graphic is not to compare the number of seats held by each party—if it were, this fails—but to show the order needed to cross the 75 seat line. The table of who’s who above also is a great help to those not so familiar with Dutch politics who are trying to ascertain which coalition partnerships are more likely. After all, it’s highly unlikely a rightwing and leftwing party would come together to govern.

Credit for the piece goes to the Guardian’s graphics department.

Those Who Will Lose Subsidies for Trumpcare

As much as I like trains…we need to get back to Trumpcare. As you probably know, it will cover fewer people than Obamacare. Just how many fewer people? Somewhere in the ten to twenty million range. The poor, the elderly, and the sick are those who will be worse off. Because the poor, the elderly, and the sick are the ones who clearly do not need healthcare. Higher-income young people, your subsidies are about to go up.

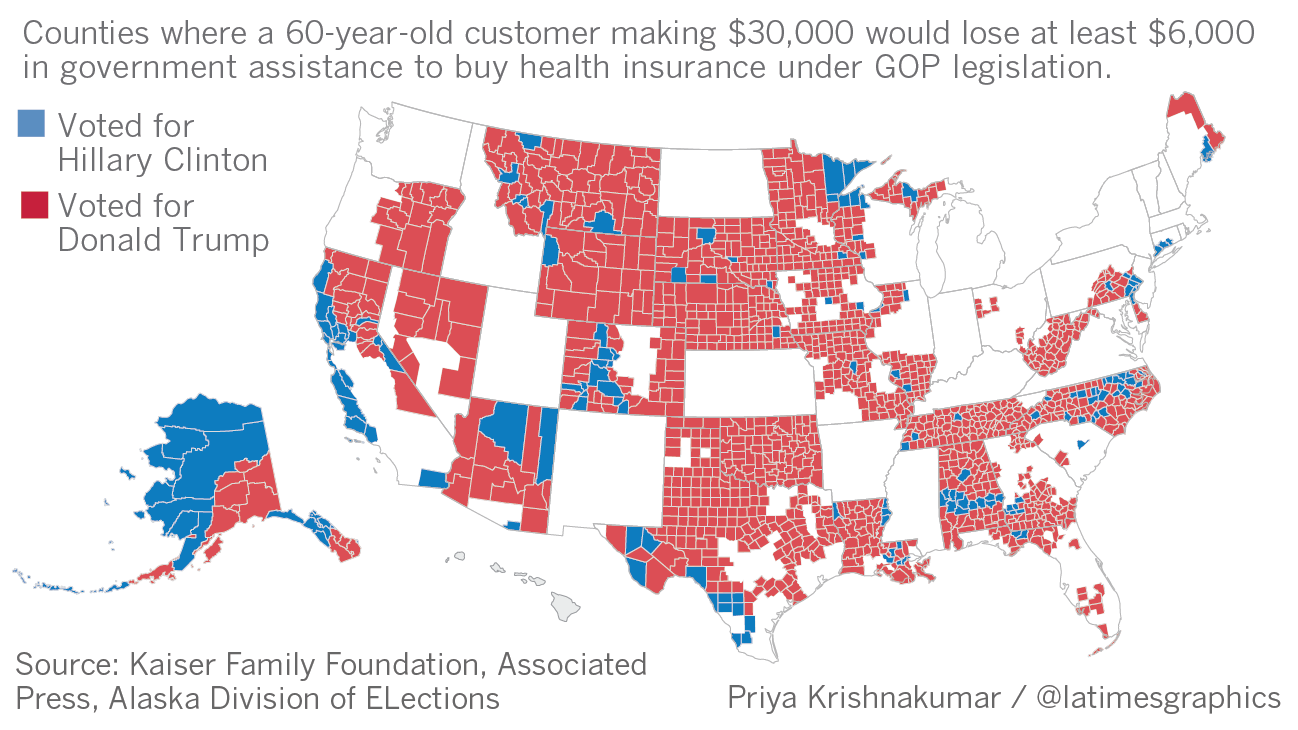
But I digress, the Los Angeles Times looked at county electoral and tax data to see just where the pain falls geographically, and more importantly where it falls politically. So they took a look specifically at the bracket that will be hurt the most: the poor and elderly, 60 and earning $30,000.

Trump won the vast majority of counties that will be hardest hit

Well, it looks like all those people who voted against the idea of Obamacare just voted themselves to get even less assistance. Trumpcare’s going to be great, guys. Unless you’re old. Or poor. Or sick.

Credit for the piece goes to Priya Krishnakumar.

Building New Railways in America

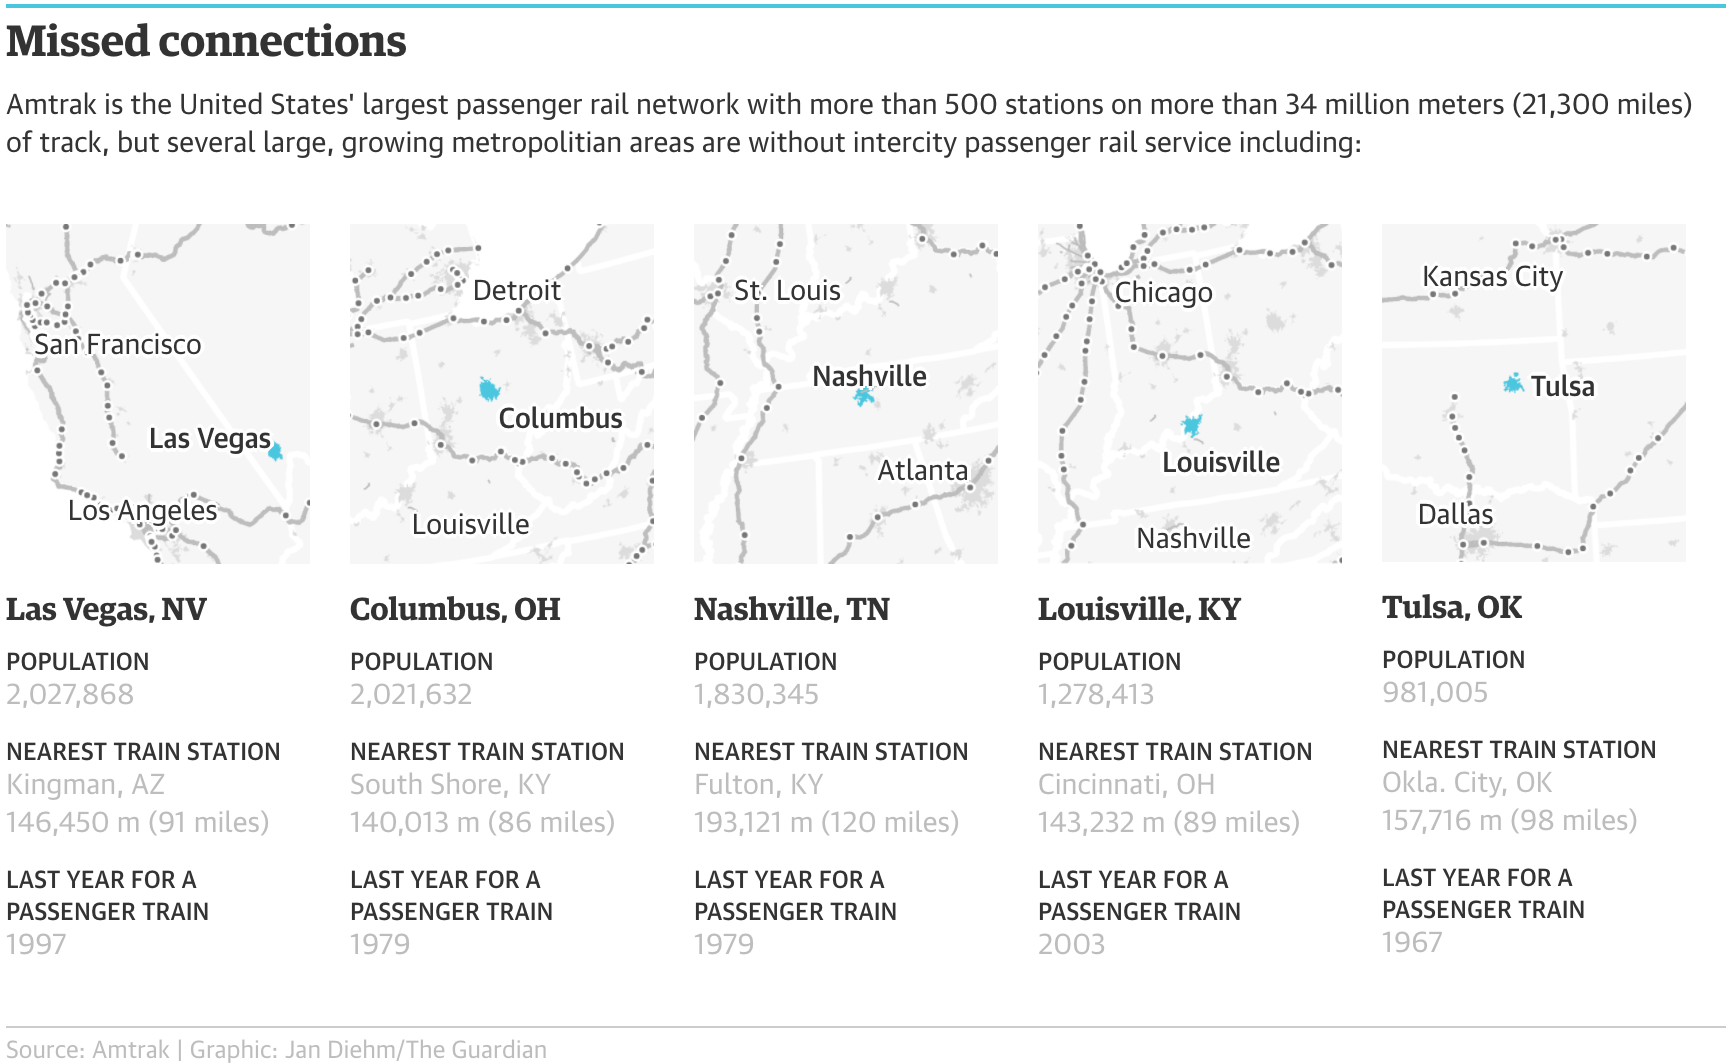
I wasn’t expecting this piece to fall into the queue for today, but you all know me as a sucker for trains. So today we have this nice set of small multiples from the Guardian. It looks at…I guess we could call it train deserts. They’re like food deserts, except we’re talking about trains.

Some of the US train deserts

What strikes me is that in a perfect world at least three of these could be on one direct line. You can almost draw a straight line from Columbus, Ohio to Nashville, Tennessee and hit Louisville, Kentucky. Obviously things like property get in the way, but it is something to note.

Credit for the piece goes to Jan Diehm.

How Trumpcare Differs from Obamacare

We are going to have a busy week this week. From the CBO release on Trumpcare costs and coverage to the elections in the Netherlands. Oh, and it might snow a wee bit here in Philadelphia and the East Coast. So let’s dive straight into today’s post, an article all the way from the West Coast and the LA Times.

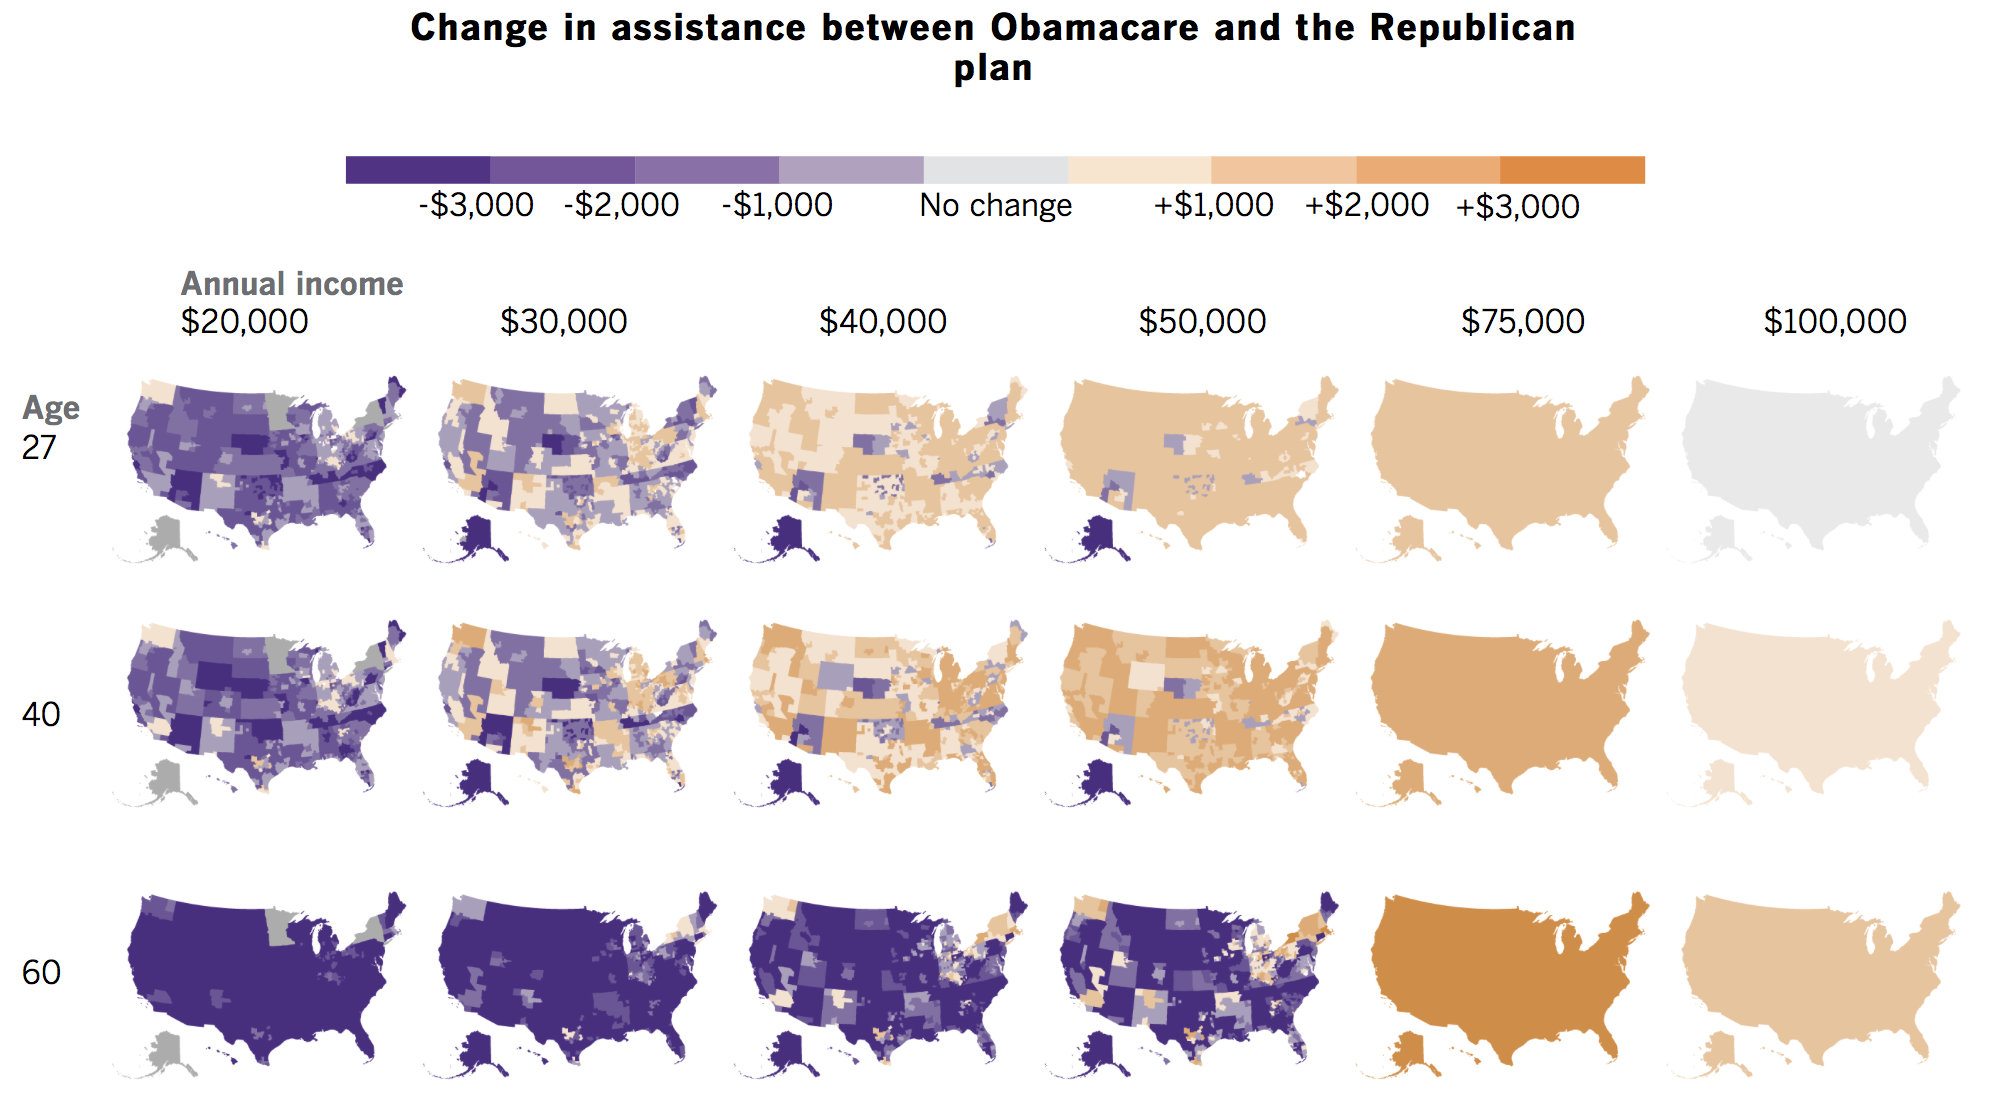
It looks at a comparison between Trumpcare and Obamacare.

How the changes affect the young, middle-aged, and the elderly by income level

The clearest takeaway is that they are using some pretty good colours here. Because purple.

But in all seriousness, the takeaway from this graphic is that Trumpcare as proposed will cost more for the poor and the elderly. And it will cost especially more for those who live in rural and more isolated areas. And that basically comes down to the fact that Trumpcare will not factor in the local cost of insurance, which generally costs more in non-urban areas.

But for the fullest understanding of the differences, you should read the full piece as it offers a point-by-point comparison.

Credit for the piece goes to Noam N. Levey and Kyle Kim.

UK Spring Budget

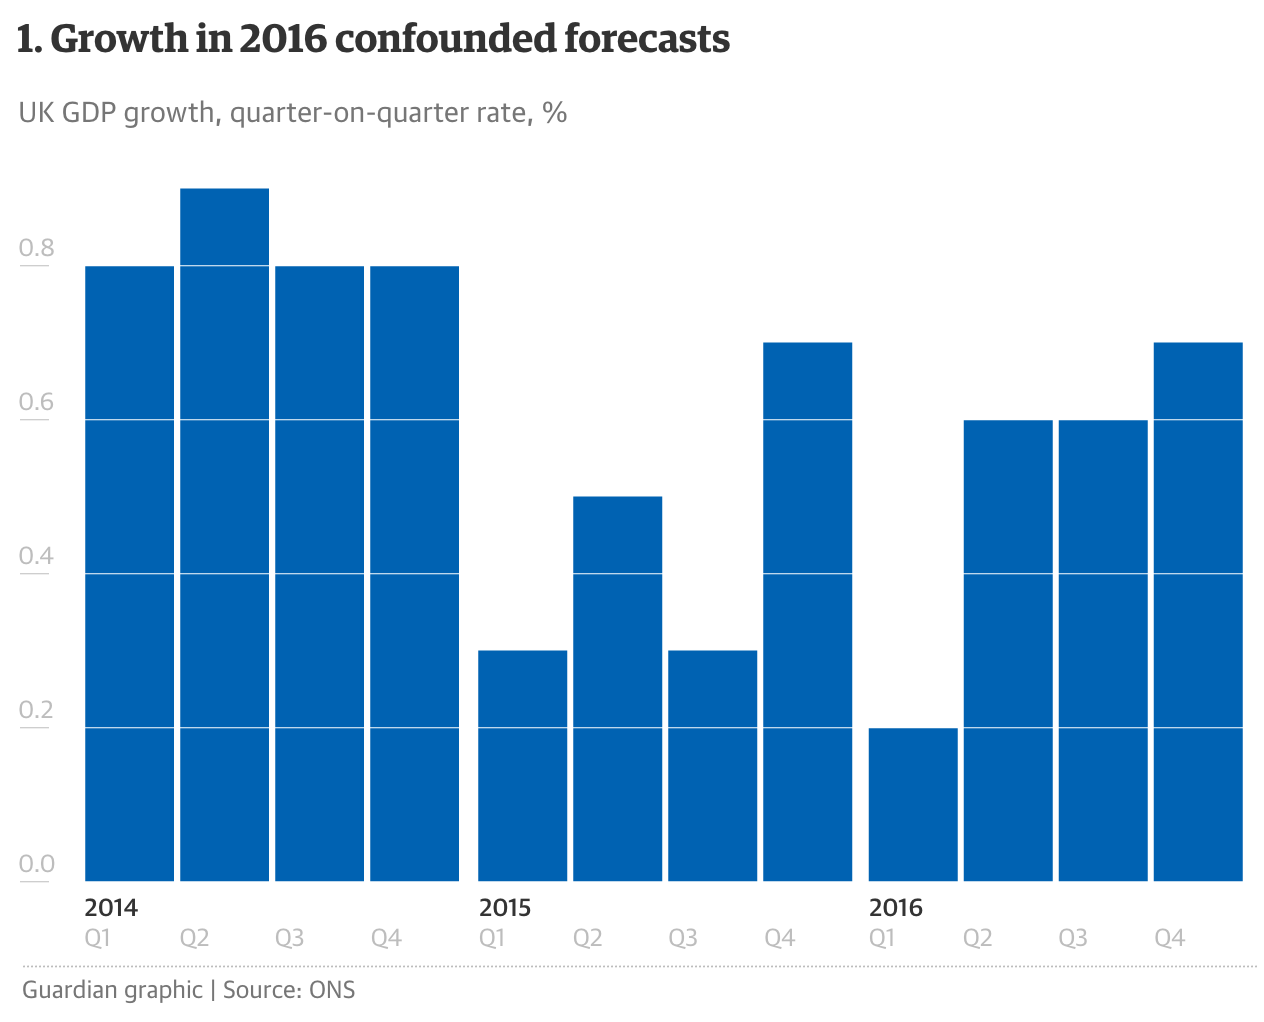
The British government is delivering its budget statement today. So as a teaser, the Guardian published this article with six charts to help understand where things are at. Chart-wise there is nothing radical or revolutionary here, but I have a soft spot for articles driven by data visualisation.

Quarterly growth
Quarterly growth

Credit for the piece goes to the Guardian graphics department.

North Korea’s Missile Programme

So here’s how this week was supposed to go. I was going to write about the Northern Irish election Monday and then Tuesday was going to be a piece from the New York Times that looked at the public’s concerns facing an incoming president. This piece I was going to save for later. But then Sunday night North Korea tested several missiles and flew them into the Sea of Japan. Sort of felt appropriate to move this one up a couple of days.

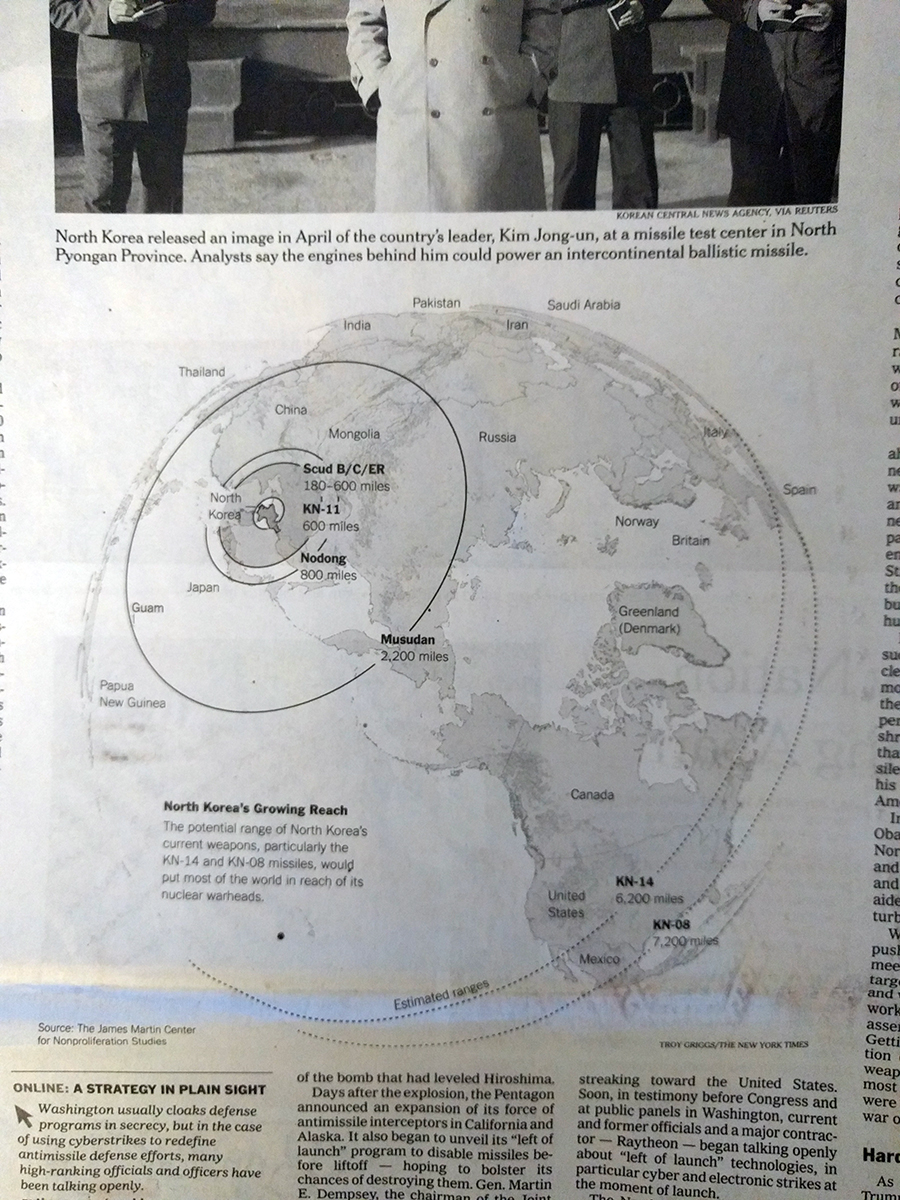
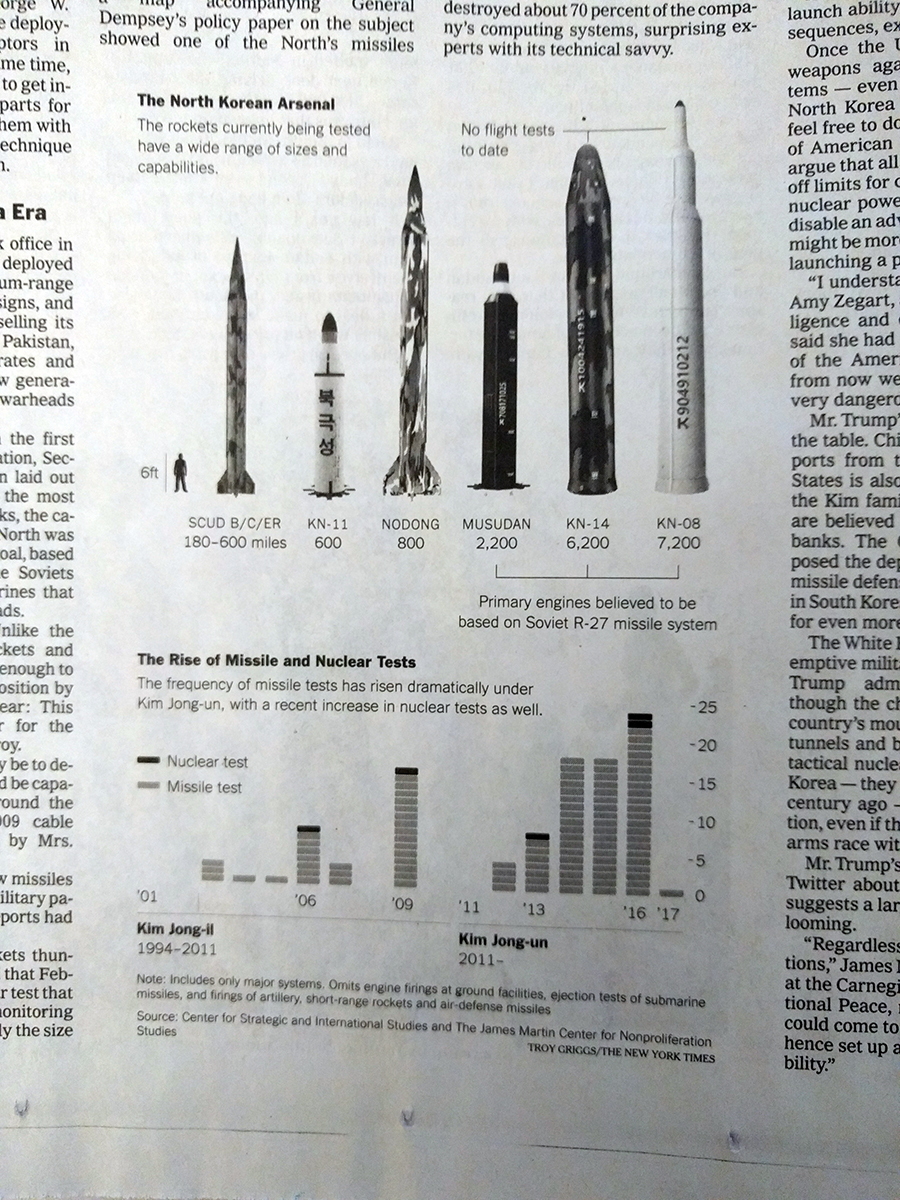
As you know, I like infographics and diagrams about military things. And in an article about the US cyberwar against North Korea, the New York Times included these graphics to provide context about the scale and scope of the North Korean missile programme.

missileRange_900
Where the missiles can reach, looking at you, West Coast
The size of the missiles and the number of tests
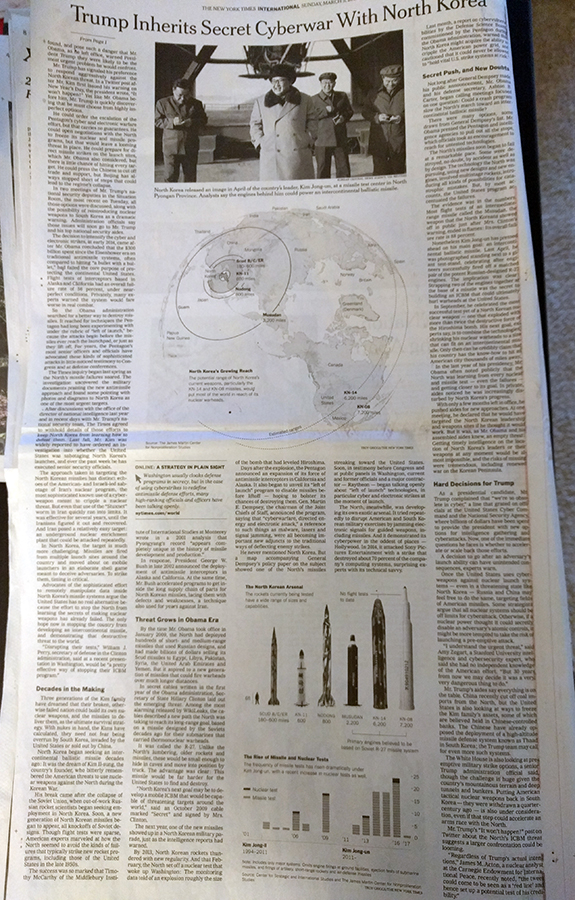
pageDesign_900
The overall design of the page

I don’t have the URL for the page on-hand, but if you can find it. The article is well worth the read.

Credit for the piece goes to Troy Griggs.

Northern Ireland Assembly Election Results

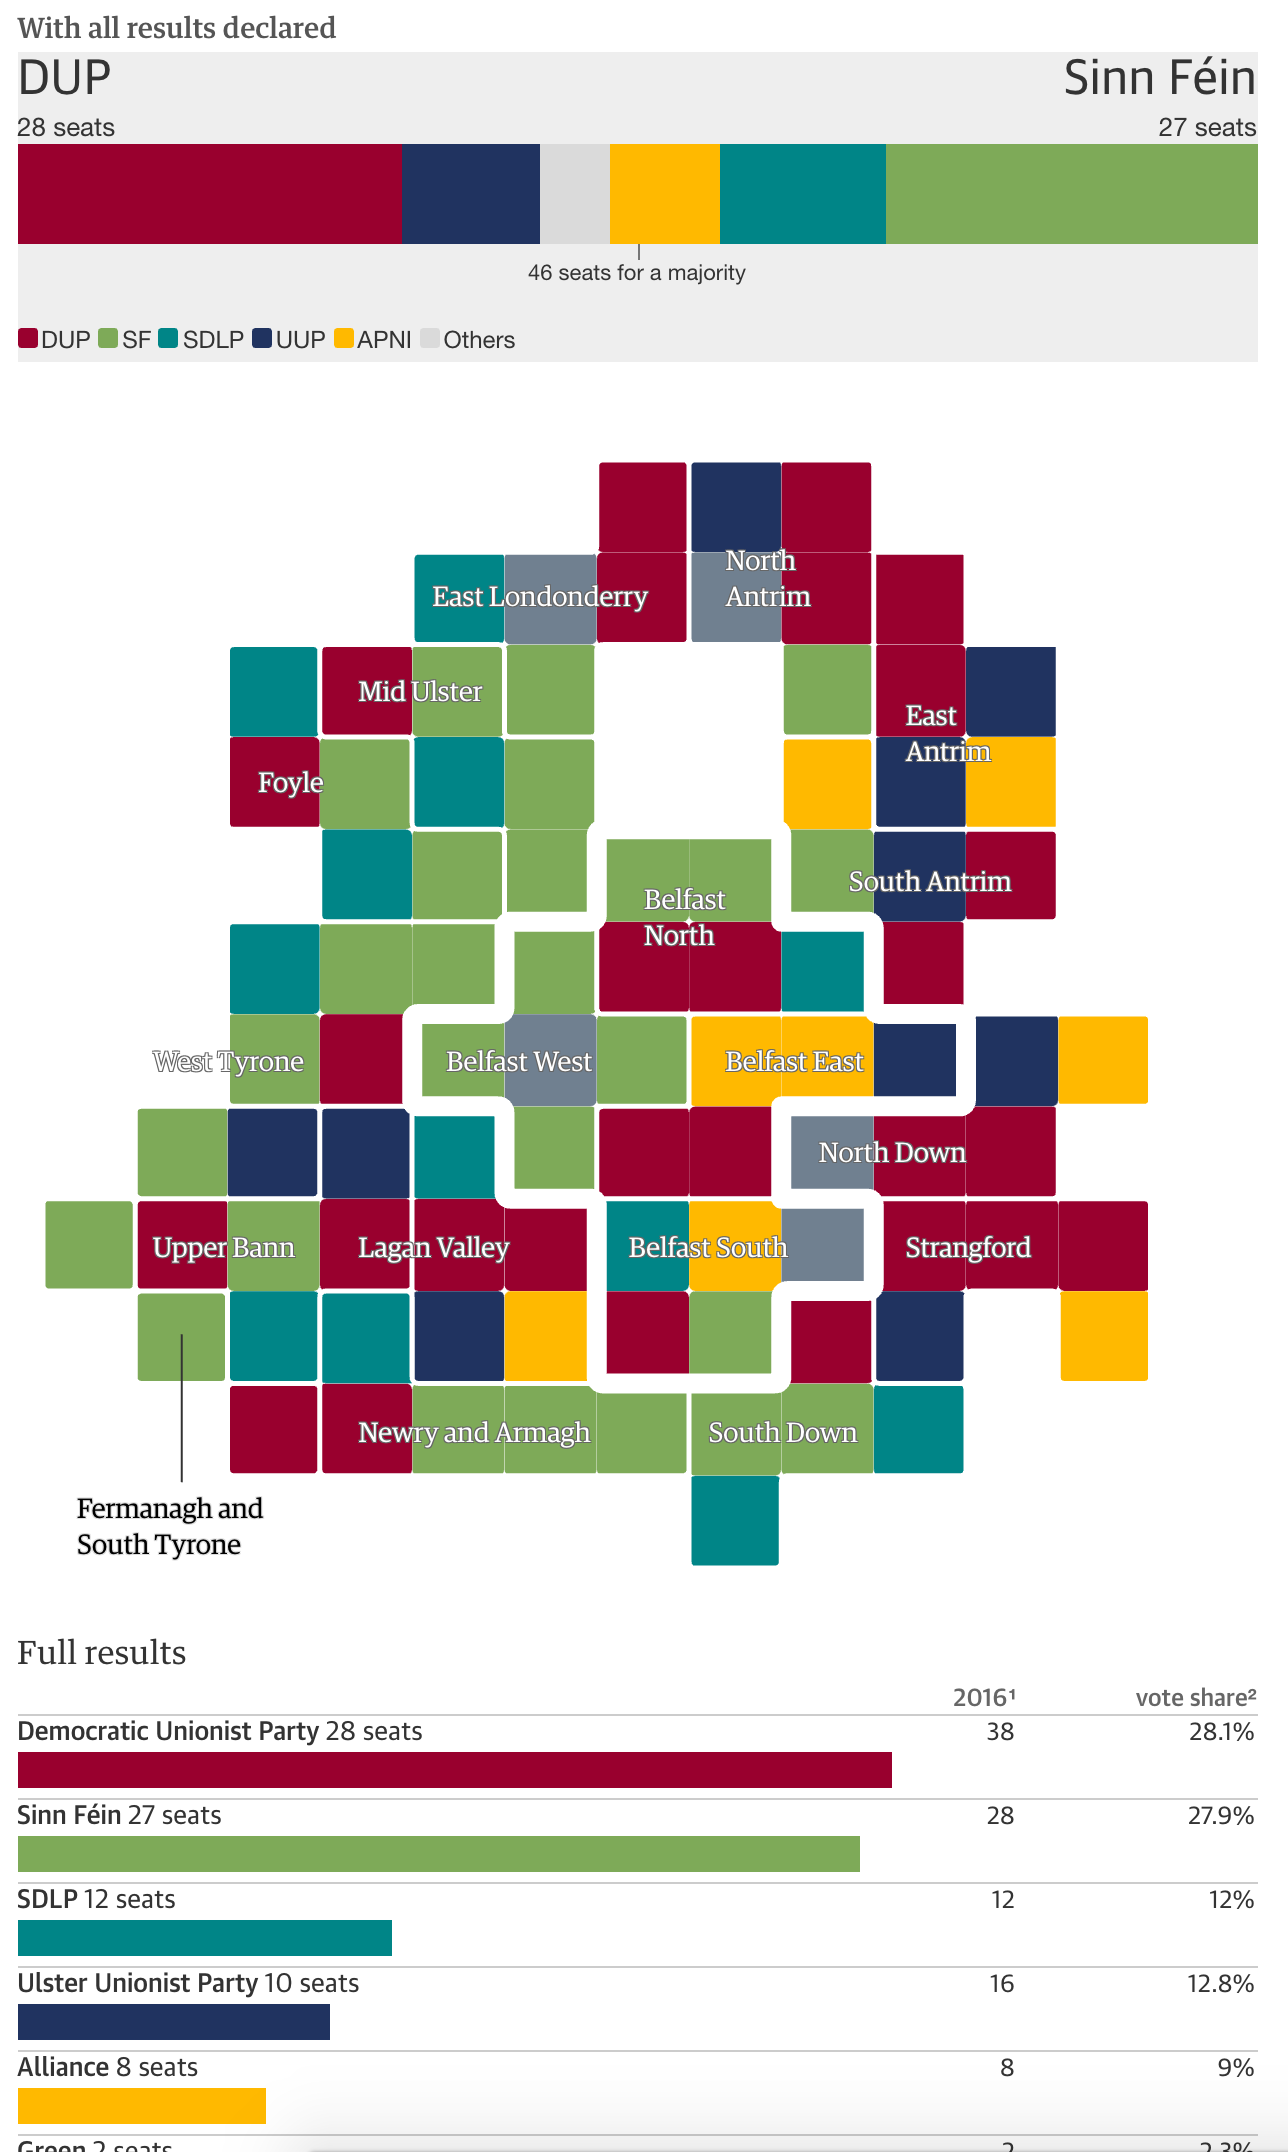
Friday was election day across Northern Ireland as voters elected their representatives for the assembly at Stormont. The headline results: the Nationalists have gained significant ground on the Unionists. The Guardian captured the tallies in this results page.

An almost even split

Credit for the piece goes to the Guardian’s graphics department.