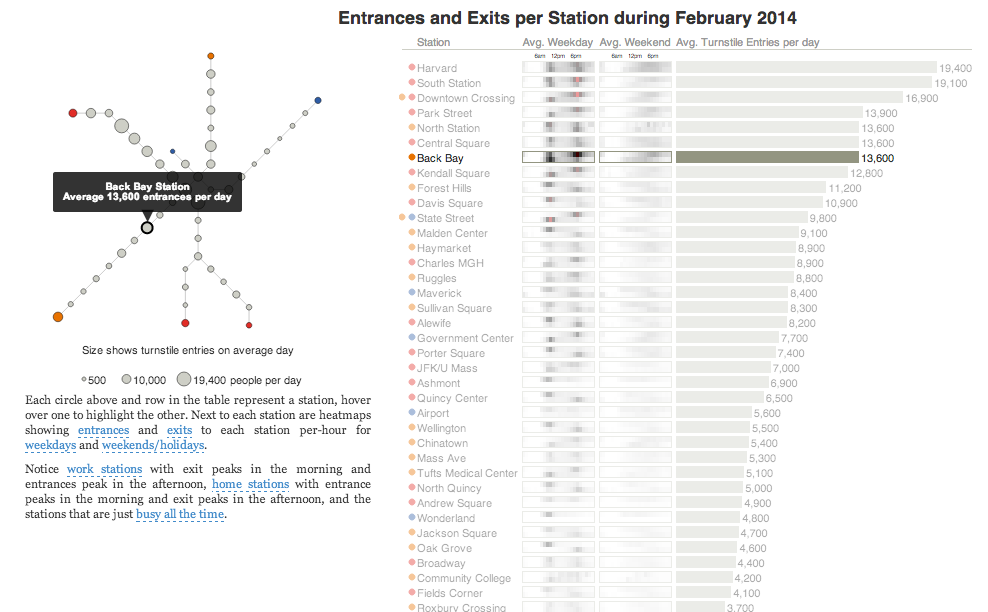
Today’s post is the graduate work of Michael Barry and Brian Card of Worcester Polytechnic Institute. The two looked at the available public data of the Massachusetts Bay Transportation Authority (MBTA)—the T to those that know—to better understand the Boston area subway system. Here the subway system refers to the heavy rail lines, i.e. the Blue, Orange, and Red lines.

In short, the piece has a lot to look at that is worth looking at. This particular screenshot is an analysis of the stations across all times on average weekdays and weekends. You can see how in this particular selection, the size of the station markers pulse depending upon the time of day and the number of turnstile entries. Meanwhile the charts to the right show you the density through time of said entries and then compares the average number of turnstiles entries per day. Text beneath the system map to the left provides a short analysis of the data, highlighting work vs. home stations.
Credit for the piece goes to Michael Barry and Brian Card.
