More Cicadian Rhythms

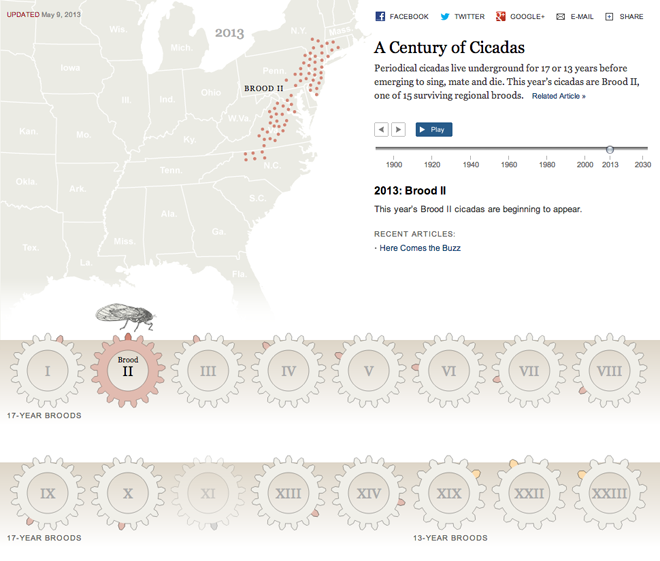
On Tuesday I shared with you some work by Jonathan Corum at the New York Times on the 17-year cicadas now starting to emerge back east. (And as I recall from my childhood, I assure you that they are quite loud.) Today we look at an illustration of the cicada life cycle via the Washington Post.

As I discussed the other day about other graphics, there are differences in how the two newspapers are presenting the same topic or subject matter. The New York Times piece concerns itself with the emergence over time of cicadas across the United States and links to historical articles about those events. Here, however, the Washington Post instead explains just how you get a seventeen-year period between emergences.

Additionally, the Washington Post maps near the end are not interactive as in the New York Times piece. But what this allows the Post to do is focus on those broods that impacted the Washington area instead of all those areas likely outside the Post’s core readership.
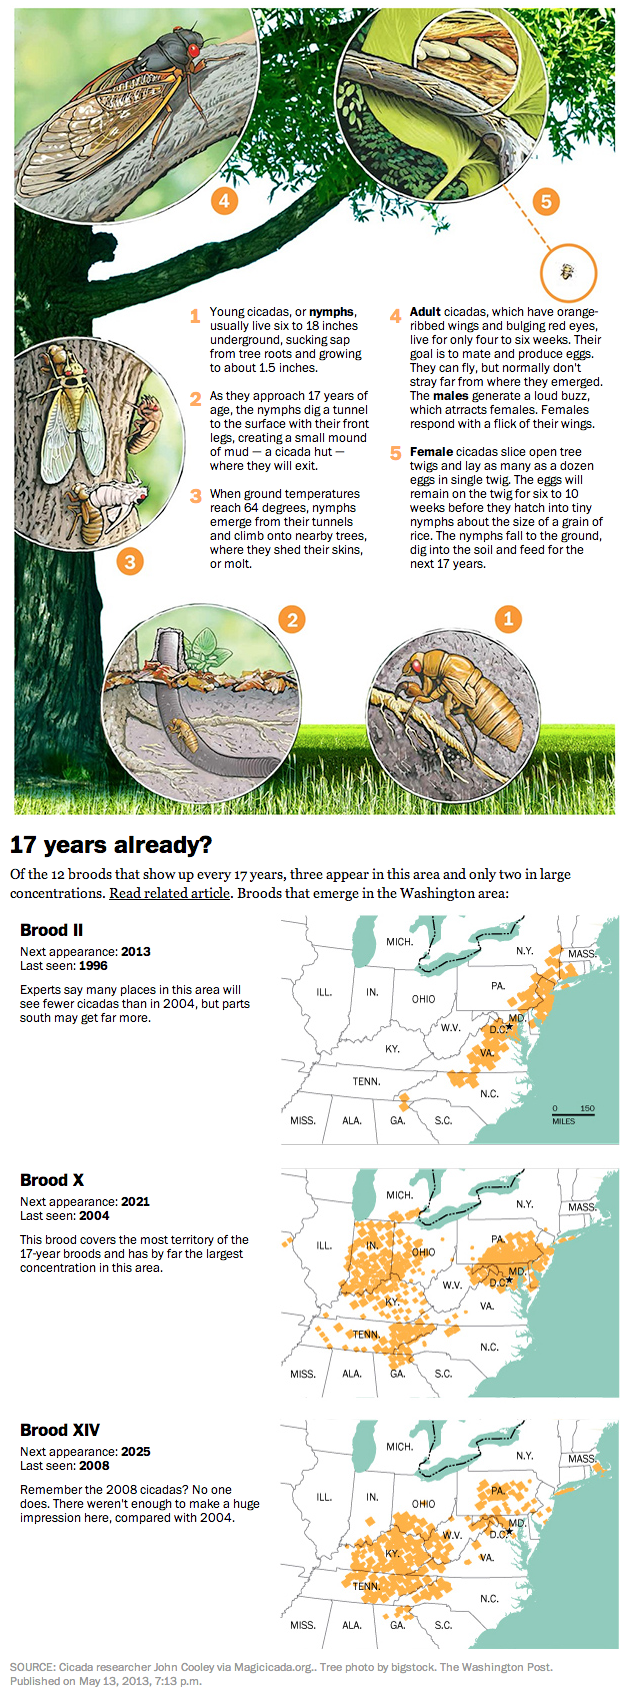
The Washington Post's explanation of the periodical cicadas

Credit for the piece goes to Patterson Clark.

Cicadian Rhythm

Cicadas are loud. And while some are around every year, there is at least one species that lives for up to seventeen years. They mate every seventeen years. In 2013 we are witnessing the emergence of Brood II, one of the numerous clusters that are synchronised to each other. But when and where have other broods been spotted over time? The New York Times looked at this question last week via an interactive graphic.

Brood II Cicadas
Brood II Cicadas

Credit for the piece goes to Jonathan Corum.

Mobile Phones

Earlier this year, the mobile phone (or cell phone for many Americans) turned 40. Today’s infographic comes from the National Post and looks at the history and the near future of the mobile phone market, mobile phones, and related technologies. A nice touch is a actual-scale drawing (best seen in print) comparing a modern iPhone to an “old school” mobile phone, as shown in the cropping of the original below.

The history of the mobile phone

Credit for the piece goes to Mike Faille and Kristopher Morrison.

The Universe Keeps Getting Bigger

The Kepler observatory is responsible for finding Earth-like planets in distant solar systems. It was launched only in 2009, but has been incredibly successful. Earlier this week scientists announced the discovery of Kepler 62, a star system that has five planets. Two of those planets exist within the Goldilocks zone, where conditions are just right for habitable planets (for Earth-like organisms) to form and exist. Of course, not all planets in such zones are habitable, look at Venus and Mars for examples. But still, the news is quite significant.

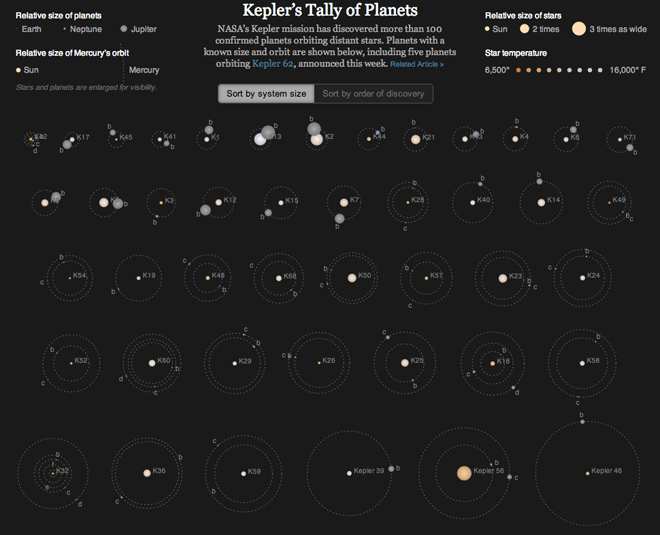
Over at the New York Times, Jonathan Corum plotted all the data on all the systems so far discovered by Kepler, including that new information on Kepler 62. The result is a mesmerising view of star systems beyond our own. The stars are planets are enlarged for visibility and the orbits are made a bit more circular, but the overview is still fantastic.

The chart shows the relative sizes of the stars and their temperatures and allows you to compare the orbits of the planets so far known. You can also sort the chart either by size or time of discovery. It also shows the relative times of the planets’ orbits. That is, they move…

The Kepler star systems

Fans of this will remember that in 2011, the New York Times used a similar, albeit static, method to explain the discovery of planets at Kepler 20, whose planets all orbit closer to their star than Mercury to ours.

Credit for the piece goes to Jonathan Corum.

How Dragonflies Hunt

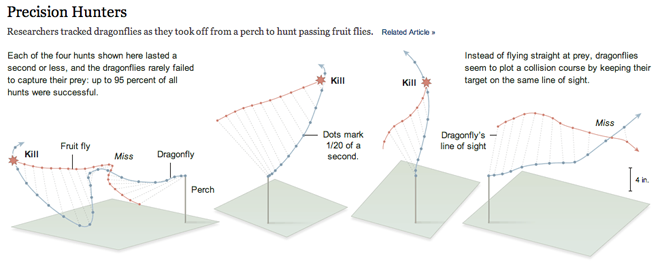
Today’s post is certainly smaller, but it’s always interesting to see how infographics and information design can help us better understand science and nature. This is a piece from the New York Times that illustrates how a dragonfly hunts its prey, fruit flies. Instead of flying straight at the fruit fly, the dragonfly plots a course that keeps it on the same line of sight with the fruit fly. The dragonfly often captures its prey where those two lines intersect, as show below.

How dragonflies hunt

What is really nice about this graphic is the dots that mark out 1/20 second intervals and allow you to plot the course of both animals with respect to each other. The annotations of course explain what is going on, for example when lines intersect by the dragonfly misses.

Credit for the piece goes to the New York Times.

Choropleth Maps

Keeping with maps, they can be useful, but all too often people fall back upon them because it is a quick and easy way of displaying data for geographic entities. This graphic from the New York Times on ADHD is not terribly complex, but it uses a map effectively.

The article discusses how ADHD rates among states vary, but are still higher in the South. The map supports that argument. Consider how it would be different if every other state were darkened to a different shade of purple. There would be neither rhyme nor reason as to why the map was being used.

A map well done
A map well done

A subtle point worth noting is that only the states falling into the highest bin are labelled. Those are the states that best support the story. The remainder of the states are left unlabelled so as not to distract from the overall piece.

Credit for the piece goes to the New York Times.

Waste Water Disposal Wells

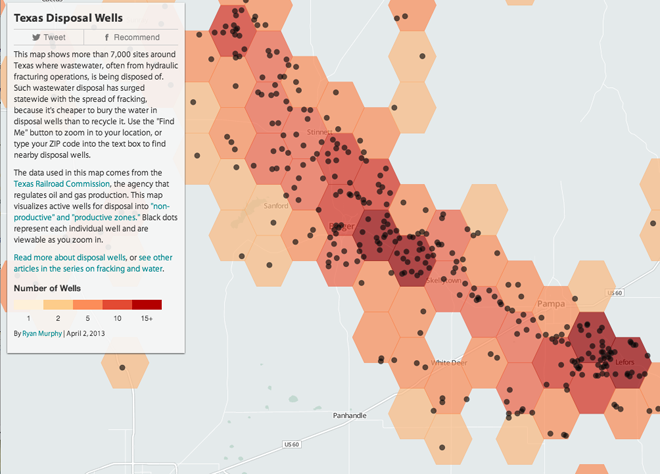
Today’s map comes from the Texas Tribune out of Austin, Texas. The map displays the location of disposal wells, i.e. the sites where the waste water from fracking and related drilling operations are dumped. Firstly, the map hints that the fracking industry is not spread equally across the state.

But secondly, the map does this through the use of hexagons that represent well density. So at a broad, state-wide view, the user sees almost a traditional choropleth. The difference is that these are not natural or political boundaries but rather data constructs designed to aggregate highly granular data points.

Well locations state-wide are aggregated into coloured hexagons

Even nicer, however, is that if you want to see where disposal wells are in your county or town, the map lets you do that too. Because as you zoom in ever closer, the individual wells appear within the hexagons that they colour. It’s a very solid piece of work.

Individual wells colour the hexagons, but are only visible up close

Credit for the piece goes to Ryan Murphy.

All Fracked Up

Last week a new study revealed that the injection of wastewater from oil drilling and fracking may contribute to earthquakes. Put simply, the theory is that the wastewater injected into the ground lubricates fault lines. And when sufficiently lubricated, the resistance between sides of the fault vanishes and an earthquake is triggered to release the tension in the fault line.

Mother Jones used an animated .gif to explain just how the process of fracking works, specifically to show the wasterwater portion. I chose this piece because it is the first .gif that I have seen attempting to use the looping animation to convey information or a story, especially as an infographic. Make sure to click the image to go the Mother Jones’ article for the animated version.

Step 2 of the graphic

Credit for the piece goes to Leanne Kroll and Brett Brownell.

Periodic Table of Beer Styles

Today’s post comes via a friend and is about beer. What else do you need for a Friday post? Here’s one of the several versions of the chart. It appears to have been based off an original design, but now variations of the re-interpretation are floating around the internet. More importantly though, I’m a whisky guy so I have no idea how true this  work is.

Periodic Table of Beer

Credit for the original piece goes to Mantis Design.

Pro Tip #314: Don’t Stare Into the Sun

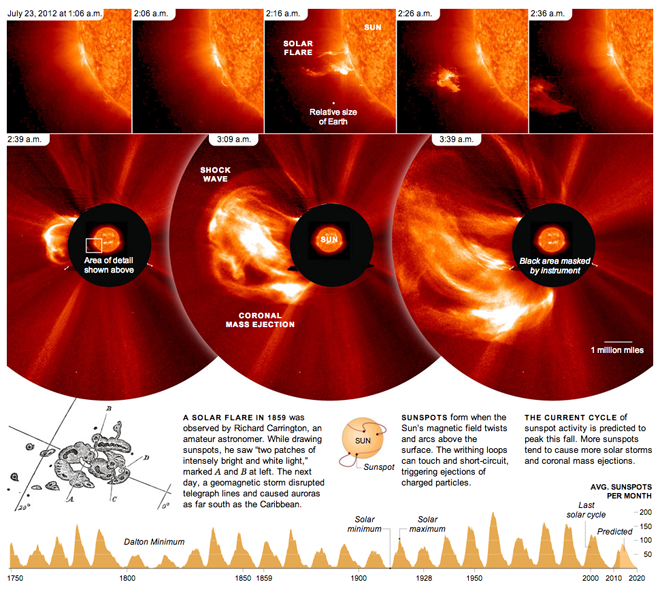
Don’t stare into the sun. It’ll burn your eyes out, kid. Okay, so maybe that’s a stretch of a reference, but, seriously, don’t. Let the professionals do it with (properly shielded) telescopes and such. This piece from the New York Times looks at a solar flare from 2012 and shows how quickly it developed. The bottom of the piece then shows the reader the frequency of solar minimums and maximums along with some explanatory graphics about just what flares and sunspots are and how they are created.

Also note the centre panel in the top row for the relative size of Earth. Yeah, who’s feeling big now? (Not me.)

Don't stare into it…

Credit for the piece goes to Jonathan Corum.