Hamas’ Rocket Swarms

Last week I wrote about the deaths in Gaza and Israel, where a ceasefire is holding at the time of writing. But I also included a graphic about the size of Hamas’ rocket arsenal. In a social media post I commented about how it appeared Hamas had also changed its tactics given Israel’s Iron Dome missile defence system.

Specifically, in the past Hamas launched rockets at a fairly even pace. However, with Iron Dome, Israel could—and did—defend about 90% of incoming fire. Consequently, Hamas tried to swarm Israel’s defences and some fire did leak through, killing over a dozen Israelis. I was looking for data on that, but couldn’t find what I wanted.

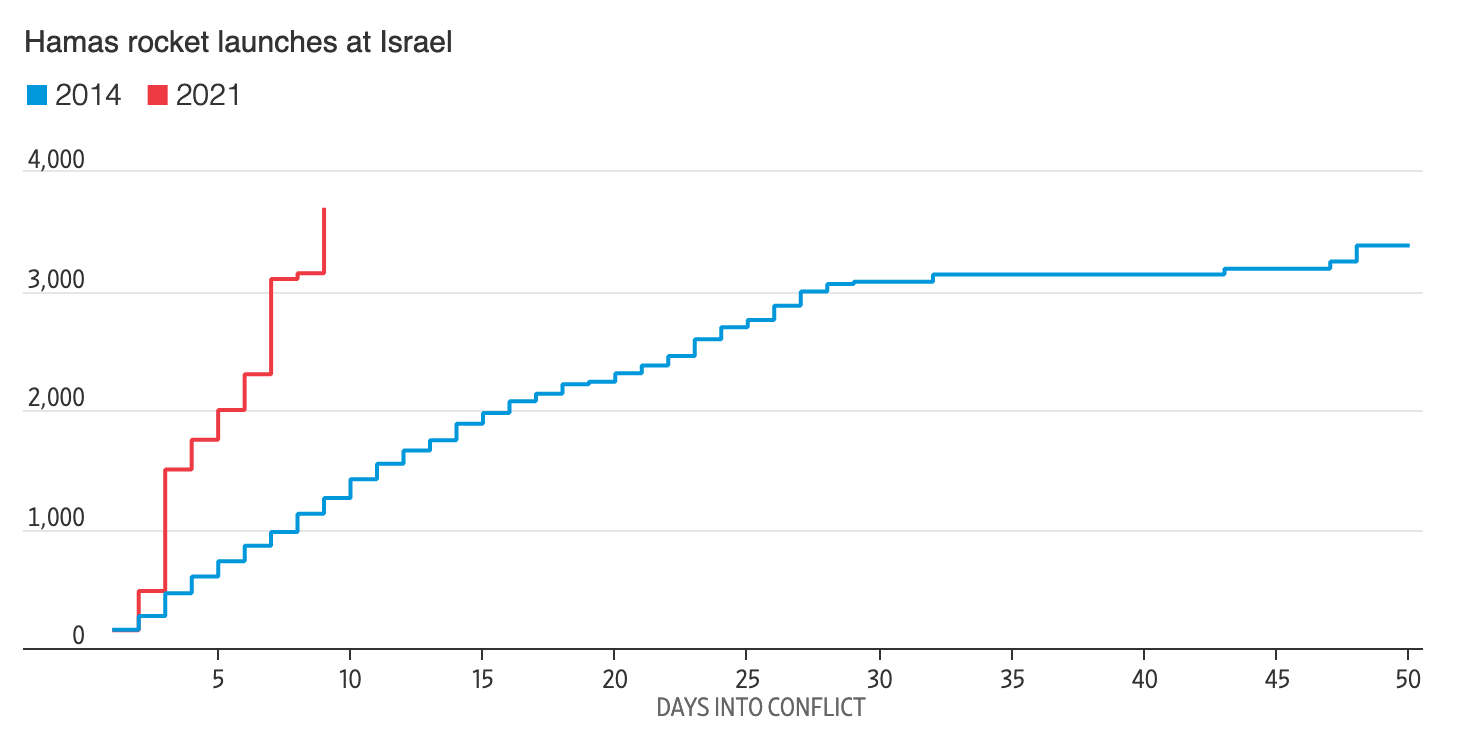
Clearly I didn’t look hard enough. This graphic appeared in the Wall Street Journal last week. It shows the cumulative number of rockets launched at Israel during this most recent surge in violence compared to the 2014 war between Israel and Hamas.

A very different profile for Hamas’ attack

In 2014, you can see even, incremental steps up in the total count of rockets. But from earlier this month, you can see much steeper increases on a daily basis with more time between those swarms.

From a design standpoint, it’s a really nice graphic. I will often say that good graphics don’t need to be crazy or flashy. This is neither. It relies on solid fundamentals and executes well. All the axis lines are labelled and the data series fall within the bounds of the x- and y-axis. The colours chosen contrast nicely.

Credit for the piece goes to the Wall Street Journal graphics department.

On a Line. Or Not.

Two weeks ago I was reading an article in the BBC that fact checked some of President Biden’s claims about the economy. Now I noted the other day in a post about axis lines and their use in graphics. Axis lines help ground the user in making comparisons between bars, lines, or whatever, and the minimum/maximum/intervals of the data set.

I was reading the article and first came upon this graphic. It’s nothing crazy and shows job growth in the aggregate for the first three months of a presidential administration. A pretty neat comparison in the combination of the data. I like.

Pay attention to what you see here. There will be a quiz.

I don’t like the lack of grid lines for the axis, however. But, okay, none to be found.

I keep reading the article. And then a couple of paragraphs later I come upon this graphic. It looks at the monthly figures and uses a benchmark line, the red dotted one, to break out those after January 2021 when Biden took office.

Spot the differences.

But do you notice anything?

The lines for the y-axis are back!

The article had a third graphic that also included axis lines.

I don’t have a lot to say about these graphics in particular, but the most important thing is to try and be consistent. I understand the need to experiment with styles as a brand evolves. Swap out the colours, change the styles of the lines, try a new typeface. (Except for the blue, we are seeing different colours and typefaces here, but that’s not what I want to write about.)

First, I don’t know if these are necessarily style experiments. I suspect not, but let’s be charitable for the sake of argument. I would refrain from experimenting within a single article. In other words, use the lines or don’t, but be consistent within the article.

For the record, I think they should use the lines.

Another point I want to make is with the third graphic. You’ll note that, like I said above, it does use axis lines. But that’s not what I want to mention.

At least we have lines.

Instead I want to look at the labelling on the axes. Let’s start with the y-axis, the percentage change in GDP on the previous quarter. The top of the chart we have 30%. As I’ve said before, you can see in the Trump administration, the bar for the initial Covid-19 rebound rises above the 30% line. It’s not excessive, I can buy it if you’re selling it.

But let’s go down below the 0-line. Just prior to the rebound we had the crash. Similarly, this extends just below the -30% line. But here we have a big space and then a heavy black line below that -30% line. It looks like the bottom line should be -40%, but scanning over to the left and there is no label. So what’s going on?

First, that heavy black line, why does it appear the same as the baseline or zero-growth line? The axis lines, by comparison, are thin and grey. You use a heavier, darker line to signify the breaking point or division between, in this case, positive and negative growth. Theoretically, you don’t need the two different colours for positive and negative growth, because the direction of the bar above/below that black line encodes that value. By making the bottom line the same style as the baseline, you conflate the meaning of the two lines, especially since there is no labelling for the bottom line to tell you what the line means.

Second, the heaviness of the line draws visual attention to it and away from the baseline, especially since the bottom line has the white space above it from the -30% line. Consider here the necessity of this line. For the 30% line that sets the maximum value of the y-axis, we have the blue bar rising above the line and the administration labels sit nicely above that line. There is no reason the x-axis labels could not exist in a similar fashion below the -30% line. If anything, this is an inconsistency within the one chart, let alone the one graphic.

Third, is it -40%? I contend the line isn’t necessary and that if the blue bar pokes above the 30% line, the orange bar should poke below the -30% line. But, if the designer wants to use a line below the -30% line, it should be labelled.

Finally, look at the x-axis. This is more of a minor quibble, but while we’re here…. Look at the intervals of the years. 2012, 2014, 2016, every two years. Good, make sense. 2018. 20…21? Suddenly we jump from every two years to a three-year interval. I understand it to a point, after all, who doesn’t want to forget 2020. But in all seriousness, the chart ends at 2021 and you cannot divide that evenly. So what is a designer to do? If this chart had less space on the x-axis and the years were more compressed in terms of their spacing, I probably wouldn’t bring this up.

However, we have space here. If we kept to a two-year interval system, I would introduce the labels as 2012, but then contract them with an apostrophe after that point. For example, 2014 becomes ’14. By doing that, you should be able to fit the two-year intervals in the space as well as the ending year of the data set.

Overall, I have to say that this piece shocked me. The lack of attention to detail, the inconsistency, the clumsiness of the design and presentation. I would expect this from a lesser oganisation than the BBC, which for years had been doing solid, quality work.

The first chart is conceptually solid. If Biden spoke about job creation in the first three months of the administration vs. his predecessor, aggregate the data and show it that way. But the presentation throughout this piece does that story a disservice. I wish I knew what was going on.

Credit for the piece goes to the BBC graphics department.

I’ve Got the Subtlest of Blues

As I prepared to reconnect and rejoin the world, I spent most of the weekend prior to full vaccination cleaning and clearing out my flat of things from the past 14 months. One thing I meant to do more with was printed pieces I saw in the New York Times. Interesting pages, front pages in particular, have been piling up and before recycling them all, I took some photos of the backlog. I’ll try to publish more of them in the coming weeks and months.

You may recall this time last month I wrote about a piece from the New York Times that examined the politicisation of vaccinations. I meant to get around to the print version, but didn’t, so let’s do it now.

Now in print…

I noted last time the use of ellipses for the title and the lack of value scales on the x-axis. Those did not change from the online version. But look at the y-axis.

For the print piece I noted how the labels were placed inside the chart. I wondered at the time—but didn’t write about—how perhaps that could have been a technical limitation for the web. But here we can see the labels still inside. It was a deliberate design decision.

Keeping with the labelling, I also pointed out Wyoming being outside the plot and it is here too, but I finally noted the lack of a label for zero on the first chart. Here the zero does appear, as I would have placed it. That does make me wonder if the lack of zero online was a technical/development issue.

Finally, something very subtle. At first, I didn’t catch this and it wasn’t until I opened the image above in Photoshop. The web version I noted the use of tints, or lighter shades, for two different blues and two different reds. When I looked at the print, I saw only one red and one blue. But they were in fact different, and it wasn’t until I had zoomed in on the photo I took when I could see the difference.

I’ve got the blues…

The dots do have two different blues. But it’s very subtle. Same with the red.

So all in all the piece is very similar to what we looked at last month, but there were a few interesting differences. I wonder if the designers had an opportunity to test the blues/reds prior to printing. And I wonder if the zero label was an issue for developers.

Credit for the piece goes to Lauren Leatherby and Guilbert Gates.

Covid Update: 23 May

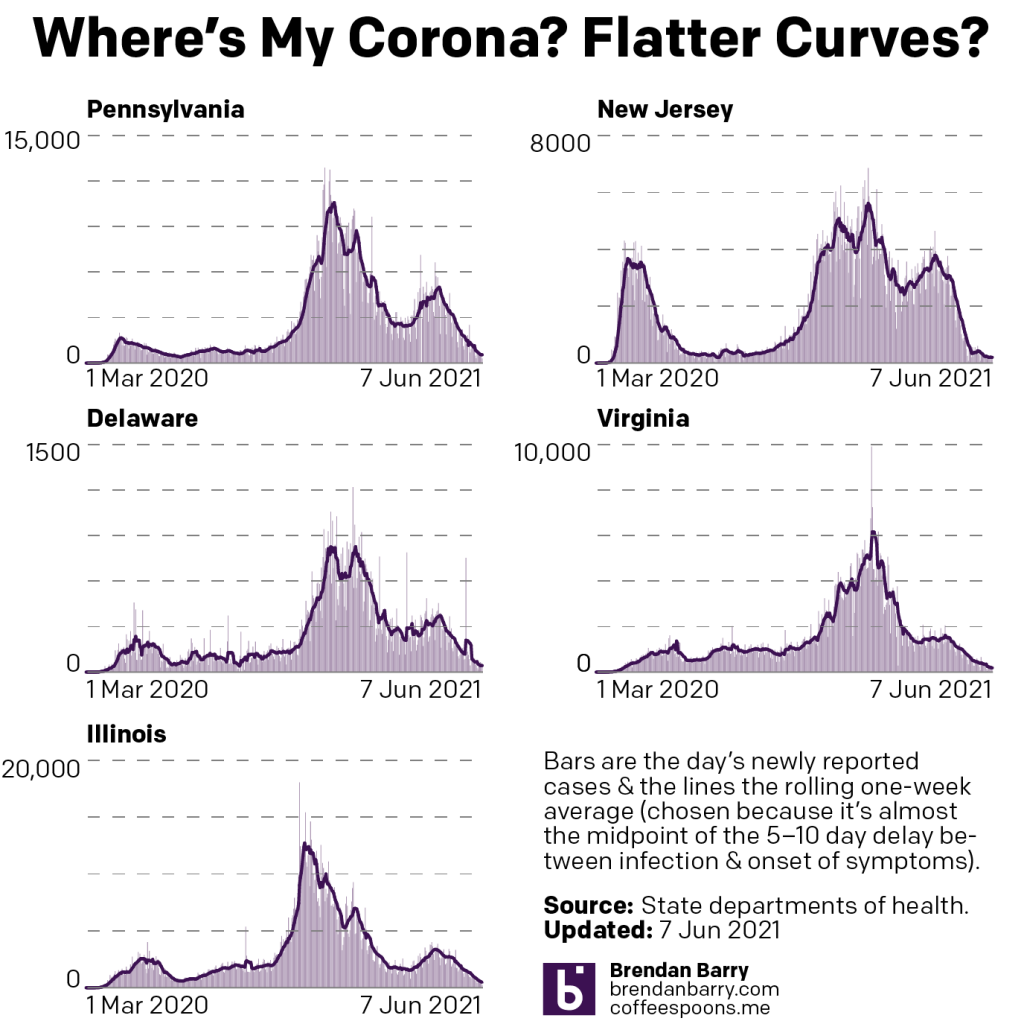
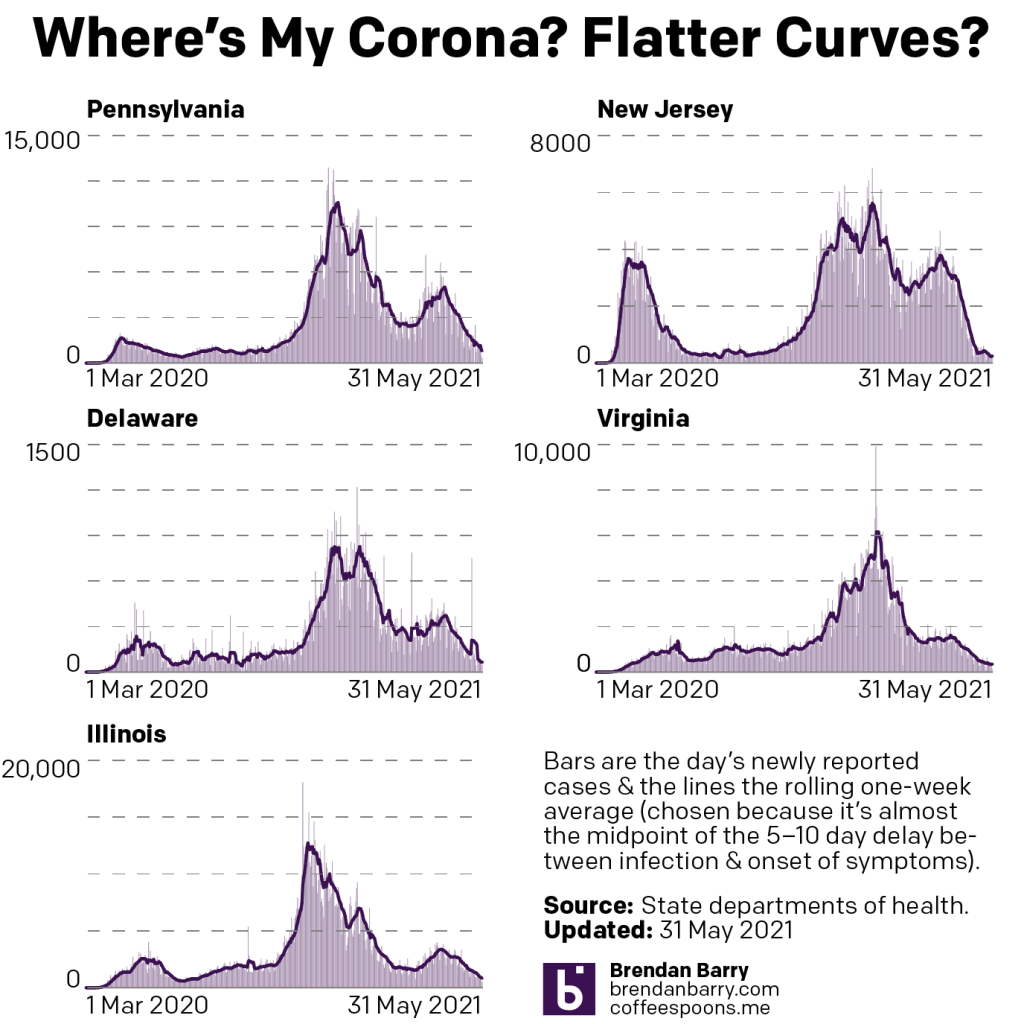
Last week I wrote about how we were seeing new cases continuing to rapidly decline. This week we can say cases are still declining, but perhaps a bit less rapidly than earlier.

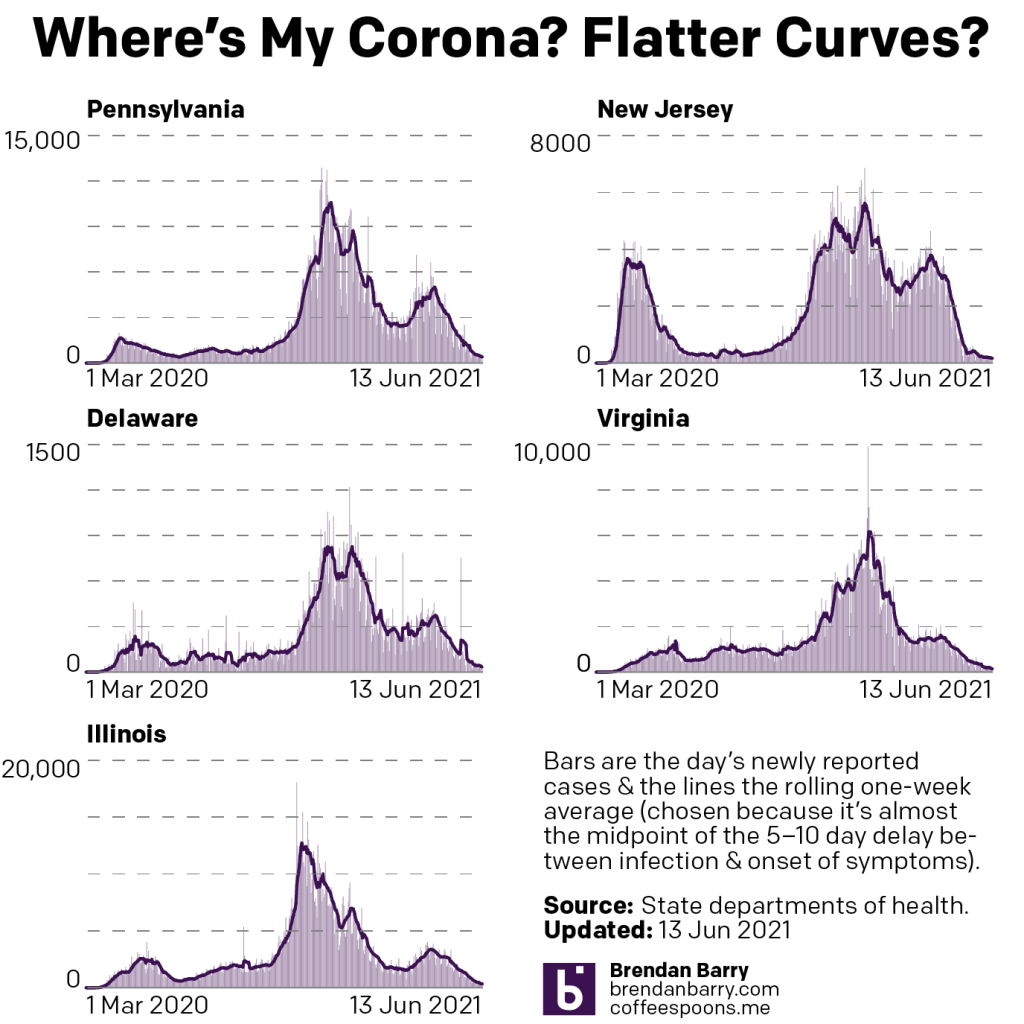
New case curves for PA, NJ, DE, VA, & IL.

The charts above show that slowdown in the tail at the right of the chart. First some points to note, Delaware reported that several hundred cases had not been entered into their database, and so we saw a one-time spike midweek. But note that after the spike, the numbers continue to trend down. In other words, the rapid decline was probably a bit less rapid than we saw, but it was still a decline.

Pennsylvania’s chart has a problem of your author’s own design. Now that I’m fully vaccinated I was able to leave the flat this weekend and the Pennsylvania data wasn’t ready by the time I left on Saturday. But by the Sunday data, it was and so the 2500 new cases is probably split somehow between those days—accounted for by the seven-day average. This points to a broader question for which I do not yet have an answer: as life increasingly returns to normal, how much longer will I continue to update these charts?

I started these graphics as a way for myself to track the spread of the virus in my home state and the state where I still have a large number of friends. At the time, there were few if any visualisations out there doing this. Now most media outlets have them and my work at home led to a similar project at work. The reason I continued to make these was you, my readers here and in other places where I post this work. Your comments, messages, texts, and emails made it clear you valued the work. First, I know there are still many people left to be fully vaccinated, nearly half the population, and due to bias, some of the people most likely to follow these posts are those most likely to get vaccinated as early as possible. But please let me know, readers, if you’re still getting value out of these graphics.

But back to the data, in two of the remaining three states, Virginia and Illinois, we saw numbers continue to decline. New Jersey, however, shows a tail with a slight uptick in the seven-day average of new cases. This will be something I follow closely this coming week.

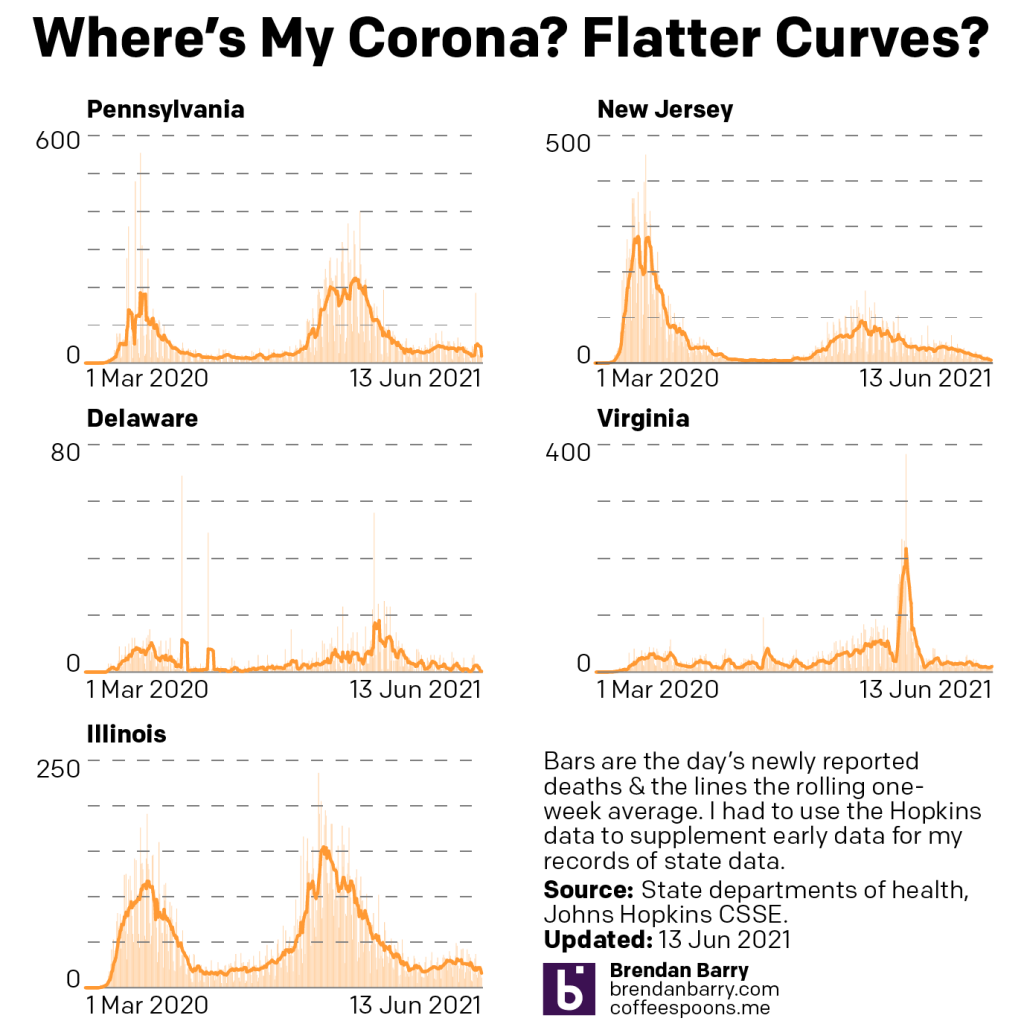
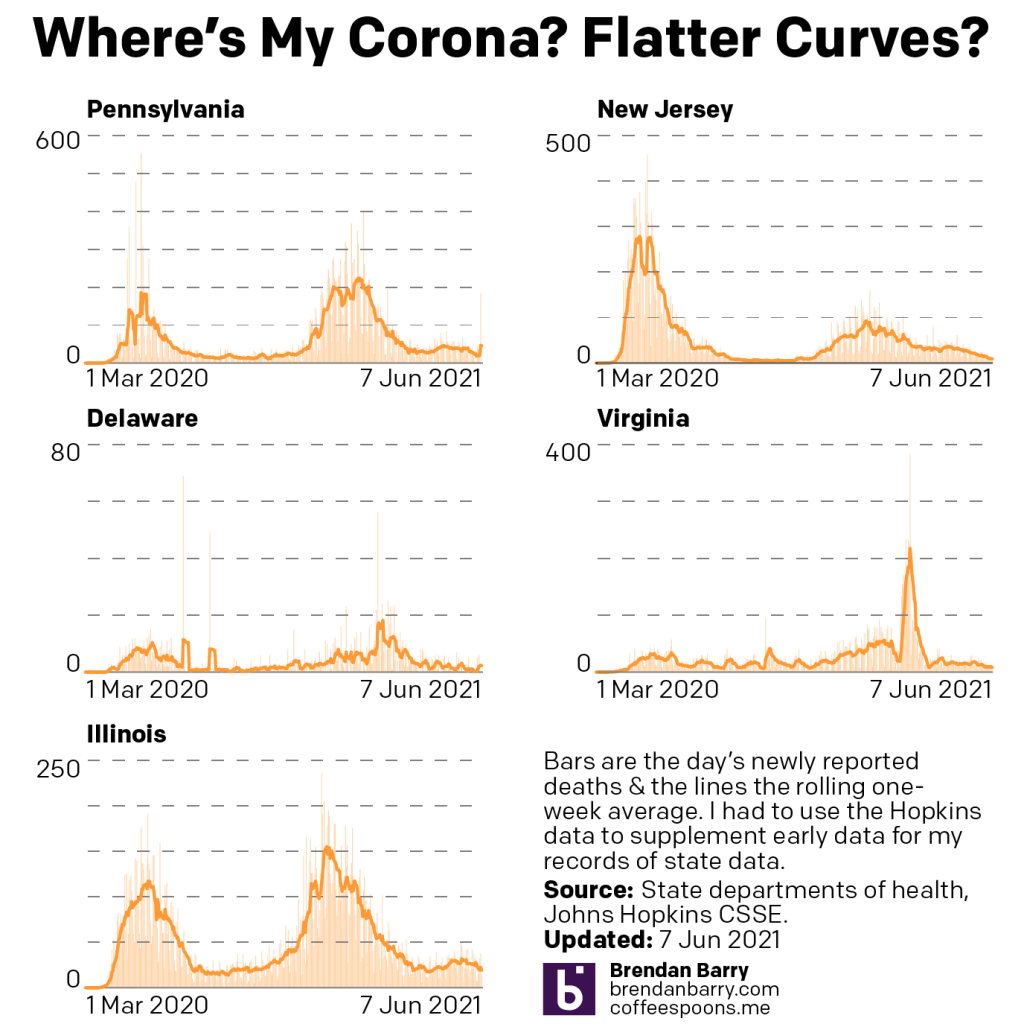
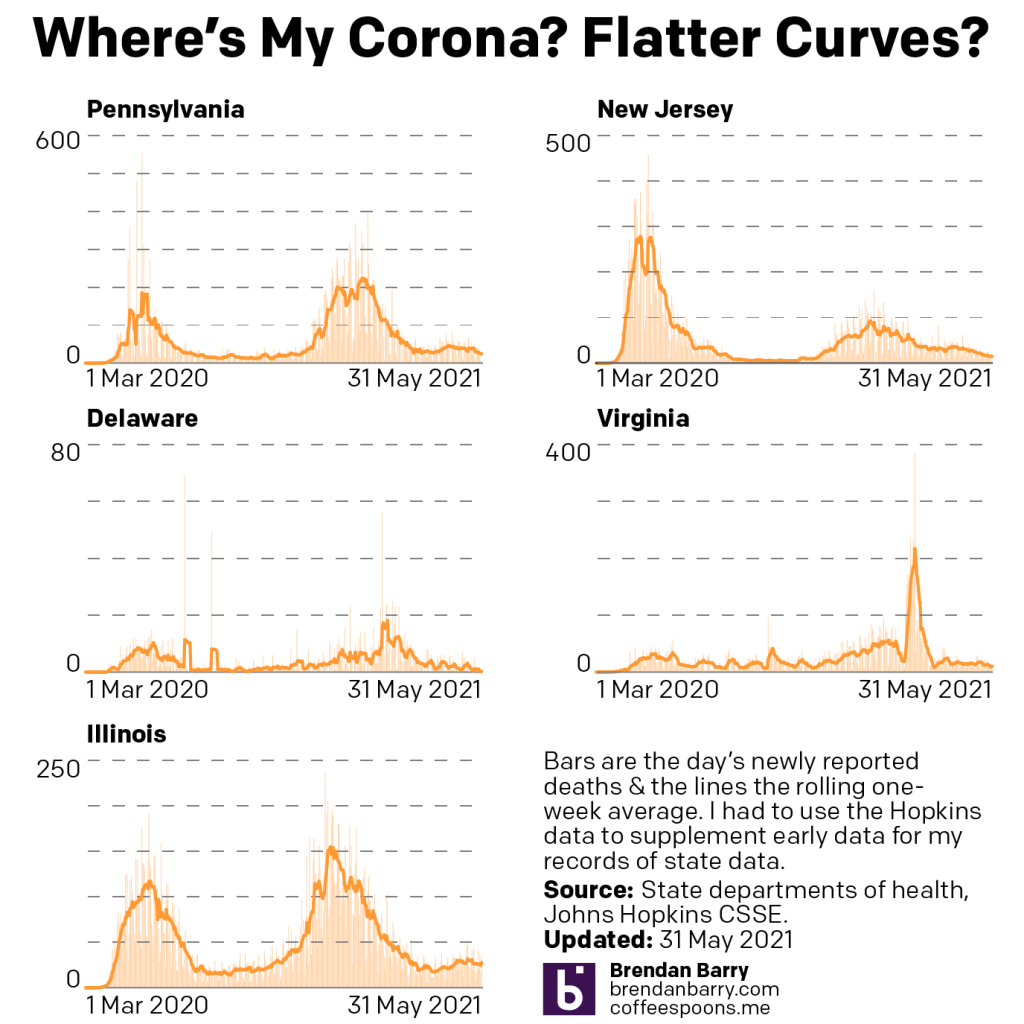
Deaths finally appear to be dropping.

Death curves for PA, NJ, DE, VA, & IL.

Not by large numbers, no, but in Virginia and Illinois we saw declines of 5 deaths per day. Pennsylvania was even greater with a decline of 7. We are still above rates we saw last summer, but it does appear that finally we have hit the inflection point we have been waiting for the last several weeks.

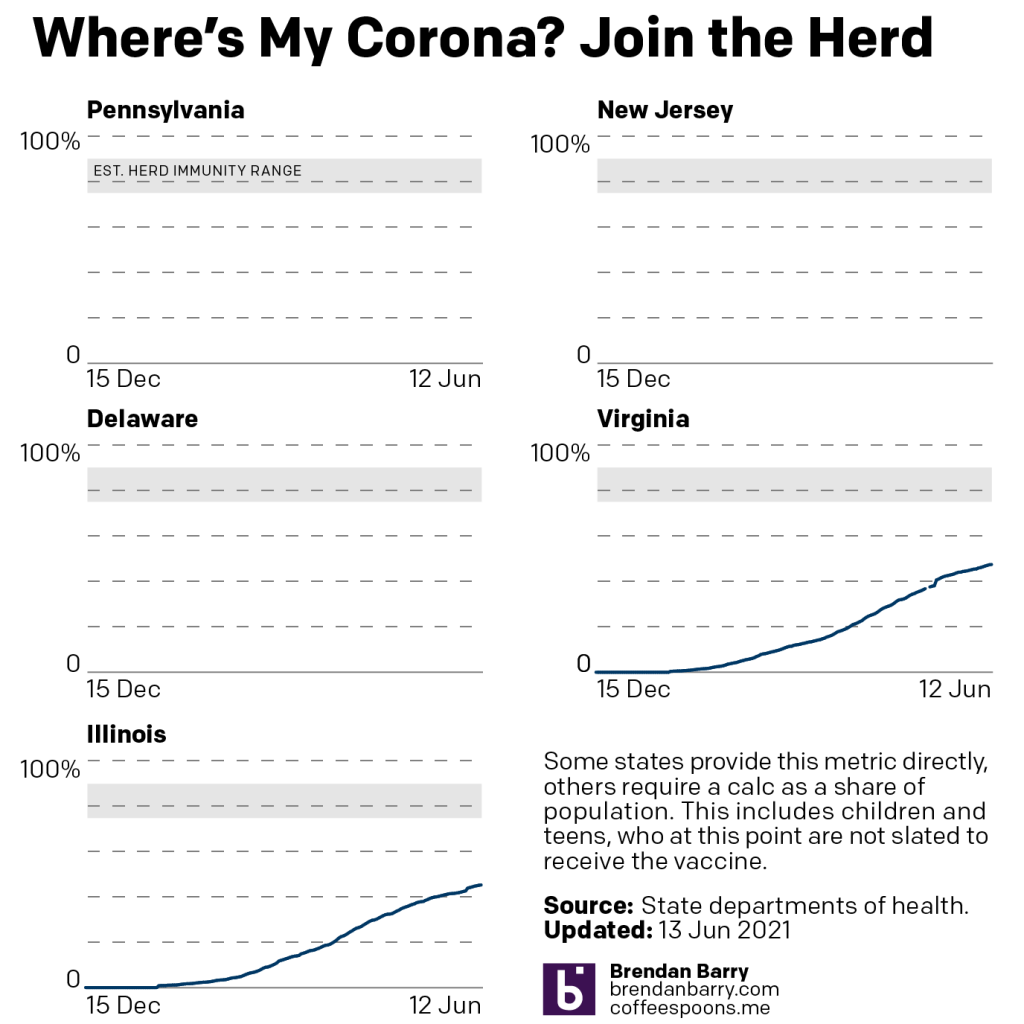
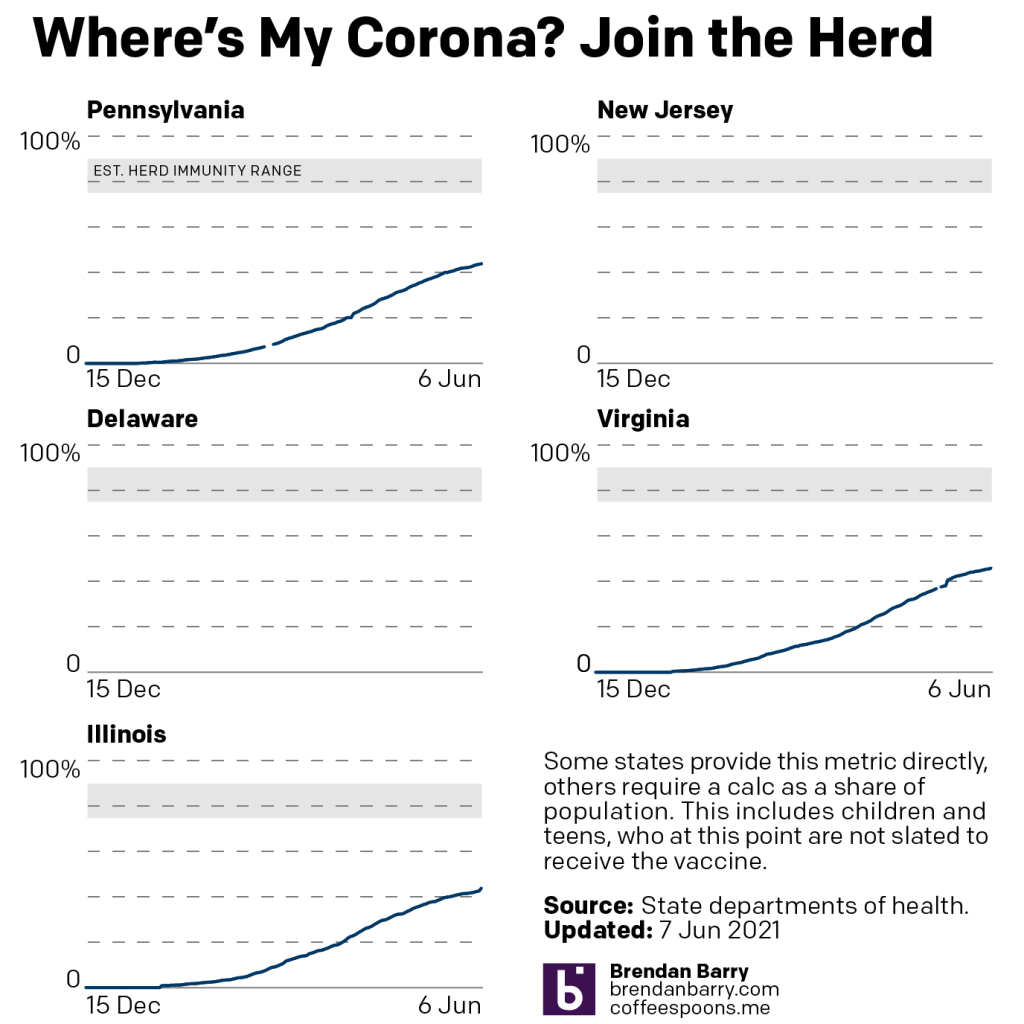
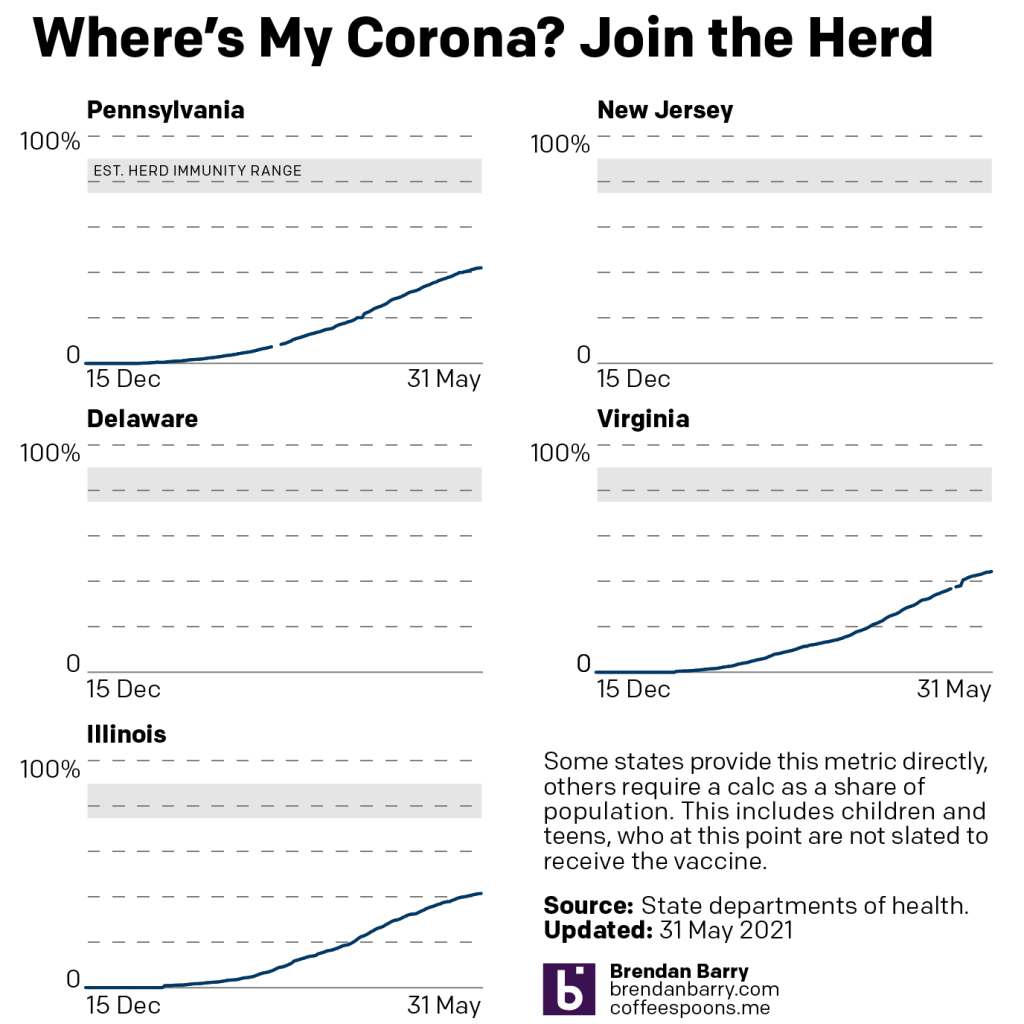
Finally we have vaccinations. These charts look at the cumulative number of people fully vaccinated.

Fully vaccinated curves for PA, VA, & IL.

And in that the number keeps going up, and that’s good. But they can also only keep going up. But if you look closely at the right tail of the curve, you begin to see it flattening out as the rate of daily vaccinations begins to drop. Unfortunately we’re well below levels we think we’d need for herd immunity. But, to try and look at the positive, we’re almost halfway there and that is certainly playing a role as we can see with the rapid decline in numbers of new cases. But we need to keep trying to get more people vaccinated.

Credit for the piece is mine.
The Month That Lasted a Year

Two Fridays ago I received my second dose of the vaccine. In other words, I’m fully vaccinated and can resume doing…things. Anything. And so this piece from xkcd seemed an appropriate way to wrap up what has been a horrible, no good, terrible year.

The longest month of our lives.

Credit for the piece goes to Randall Munroe.

It’s Warming Up

As many of my readers know, I prefer my weather cooler and summer is probably my least favourite season—weather wise at least. Appropriately, my vaccination will be kicking in just in time for a small, early season heatwave. Felt like an appropriate time to share this piece from Brian Brettschenider.

It’s just an animated map showing where in the United States and Canada the daily average high temperature is 70ºF for each day of the year. Here’s where you can expect a daily high of 70ºF for the date of 20 May. Not Philadelphia.

I’m sure going to miss those reds.

Make sure to click through to watch the video on the Twitter.

Credit for the piece goes to Brian Brettschneider.

Some Data on Deaths in Gaza and Israel

I’ve seen an uptick in traffic to the blog the last few days, specifically my older content on the Middle East. I don’t exactly have the bandwidth to track the conflict between Israel and Gaza in addition to Covid-19 and my other projects. But as we approached the ten-day mark since Hamas first fired rockets into Israel, I wanted to get a sense of the death toll and so here we are.

The biggest thing to note is that we should take all this data with a grain of salt. For example, the Israeli Defence Force will likely talk up the effectiveness of its Iron Dome air defence system and downplay total civilian deaths. Conversely, Hamas will likely talk up civilian deaths while not detailing at all the deaths of its fighters. And when it comes to deaths in Gaza, it’s not clear what share of those reported by civilian authorities, i.e. the hospital systems, are militant fighters vs. civilians.

Not at all covered by any of this is a discussion of the opportunity costs involved, particularly when it comes to Israeli air strikes. For example, if a Gaza household contains a known Hamas fighter, one can certainly regret an Israeli drone strike that kills the fighter and his non-combatant son whilst in a field. But that strike may be a better outcome than striking the fighter’s home and along with killing not just him and his son, but now his wife, daughters, and the rest of his family.

Credit for the piece is mine.
Israel’s Palestine Trilemma

In what feels like forever ago, I wrote about the trilemma facing the British government as it related to Brexit. Brexit presented Westminster with three choices, of which they could only make two as all three were, together, impossible. Once made, those two choices determined the outcome of Brexit. For better or worse, Prime Minister Boris Johnson made that decision.

We can apply the same trilemma system to Israel in relation to the circumstances of Israel and Palestine. I will skip the long history lesson here. Israel faces some tough decisions. I will also skip the critique of Israeli government policy over the last few decades that brought us to this point. Because here is where we are.

Israel needs to balance three things: the importance of being a representative democracy, of being a Jewish state, and of security control of Gaza and the West Bank for the security of Israel. Here is how that looks.

Tough choices.

If Israel wants to remain an ethnically Jewish state—I’m going to also skip the discourse about Jewishness as an ethnicity, though I will point to Judaism as an ethnic religion as opposed to the other Abrahamic universal religions of Christianity and Islam—and it wants to be retain security control over Palestine, i.e. the Gaza Strip and the West Bank, you have what we have today.

If Israel wants to remain an ethnically Jewish state and it wants to be a representative democracy, you get the Two-State Solution. In that scenario, Palestine, again conceived as Gaza and the West Bank, becomes a fully-fledged independent and sovereign state. Israel remains Jewish and Palestine becomes Arab. But, Israel loses the ability to police and militarily control Gaza and the West Bank, instead relying on its newfound partners in the Palestinian Authority or whatever becomes the executive government of Palestine. This has long been the goal of Middle East peace plans, but over the last decade or so you hear Two-State Solution less and less frequently.

Finally, if Israel wants to be a representative democracy, in which case both Jewish citizens and Arab–Israelis and Palestinians all have the right to full political representation without reservations, e.g. the loyalty oath, and it wants to maintain security control over Gaza and the West Bank, you get something I don’t hear often discussed outside foreign policy circles: a non-Jewish, multi-ethnic Israel. Today Arab–Israelis and Palestinians nearly—if not already—outnumber Jewish Israelis. In a representative democracy, it would be near impossible to maintain an ethnically Jewish state in a county where the Jewish population is in the minority. Consequently, Israel would almost certainly cease being a Jewish state.

One can tinker around the edges, e.g. what are the borders of a Two-State Solution West Bank, but broadly the policy choices above determine the three outcomes.

The outstanding question remains, what future does Israel want?

Credit for the piece is mine.

Covid Update: 16 May

Last week I wrote about how new cases in the five states we cover (Pennsylvania, New Jersey, Delaware, Virginia, and Illinois) were falling and falling rapidly. And this week that pattern continues to hold.

New case curves for PA, NJ, DE, VA, & IL.

If we look at the Sunday-to-Sunday numbers, daily new cases were down in all five states. If we look at the seven-day averages, cases are down in all states. Pennsylvania and Illinois are now down below 2000 new cases per day, Virginia is just over 500 per day, New Jersey is below 400, and Delaware is over 100. These are all levels we last saw last autumn. In other words, we’re not quite back to summer levels of low transmission, but this time next month, I wouldn’t be surprised if we were.

Deaths remain stubbornly resistant to falling.

Death curves for PA, NJ, DE, VA, & IL.

In fact, if we compare the Sunday-to-Sunday numbers we see that the numbers yesterday were largely the same as last Sunday, except in Pennsylvania where they were up significantly. The seven-day average?

Here’s where it gets interesting, because deaths are up slightly. Not by much, for example, Illinois was at 29.1 deaths per day last Sunday, this Sunday? 30.9. Illinois isn’t alone. Pennsylvania, Delaware, and Virginia all have reported slight upticks in their death rates.

But the biggest concern is the continuing slowdown in vaccinations. We’re perhaps halfway to the point of herd immunity in the three states we track. All three are between 37% and 38%. The thing to track this coming week will be if the rate continues to slow.

Total full vaccination curves for PA, VA, & IL.

Credit for the piece is mine.

Delco vs Chesco

One of the things in the pop culture these days is an HBO show called Mare of Easttown. For those that haven’t heard of it, probably my more international audience, it’s a crime drama set in the near suburbs of Philadelphia, a placed called Delaware County that locals simply call Delco.

Last Saturday, the show got its limelight on Saturday Night Live, which spoofed the show in a trailer for a fictional show called Murdur Durdur, from the producers of Mare of Easttown as well as those of It’s Always Sunny in Philadelphia.

The SNL skit included a crime map of which I took a screenshot.

I can see my house from here. Dur.

This caught my attention because one of the characters mentioned Downingtown, which is where your author grew up until he was 16. SNL‘s map really just served as a vehicle to showcase Googling all the town names—and the Philadelphia region has a wealth of them—because the map is all over the place, pun intended.

Conshohocken is actually a real place in neighbouring Montgomery County, on the Schuylkill River (real place). Royersford is also real and also in Montgomery County. Hockessin is also real, but is in Delaware, the state, not Delaware County, which is in Pennsylvania. (Both border the Delaware River.)

The map also makes reference to Lionville, a real place near Downingtown. Your humble author worked in a restaurant in Lionville, located in Uwchlan Township. (They don’t mention that, but I can see people enjoying that name as well.)

The keen observers will also note the placement of a label for Altor, which is only about 2.5 miles from my aforementioned childhood home. Clearly some SNL writer is from or is incredibly familiar with the western suburbs of Philadelphia.

As for the map itself? Well, it’s fictional. One, there is no Jagoff Bridge. Two, it’s actually a map of Bethlehem, to the north in the Lehigh Valley. Route 30 is a real place and does run through Downingtown and Chester County. But nowhere does it cross any town or city like the one the map depicts. Instead that road is Route 378 crossing the Lehigh River. (Fun fact, Route 30 runs west and eventually through Indiana and Illinois, south of Chicago.)

In fact the funny thing is, the map spoofing the show set in Delaware County does not contain a single place in the real Delaware County. Easttown is, for fans of the show, not actually located in Delaware County. Instead, it’s in Chester County. And your author, not surprisingly perhaps, has connections there because it’s where you can find Devon and Berwyn. (My Chicago readers may recognise those names, as several streets were named for Main Line towns.) And where I attended middle- and high-school is across the street from Easttown Township. The real one.

Now I want to actually watch the show. The real one. Not the SNL one. But first I’ll need to grab a Yuengling and a Wawa hoagie.

Credit for the piece goes to probably the writers and props department of Saturday Night Live.