Two weeks ago I was reading an article in the BBC that fact checked some of President Biden’s claims about the economy. Now I noted the other day in a post about axis lines and their use in graphics. Axis lines help ground the user in making comparisons between bars, lines, or whatever, and the minimum/maximum/intervals of the data set.
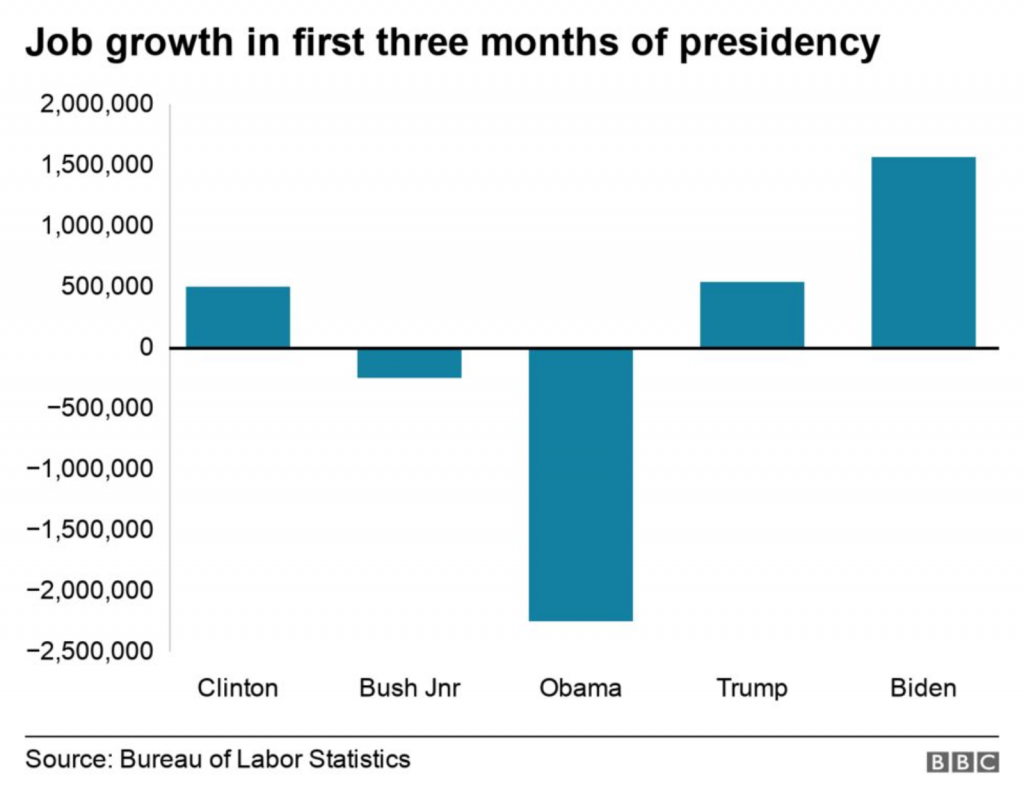
I was reading the article and first came upon this graphic. It’s nothing crazy and shows job growth in the aggregate for the first three months of a presidential administration. A pretty neat comparison in the combination of the data. I like.

I don’t like the lack of grid lines for the axis, however. But, okay, none to be found.
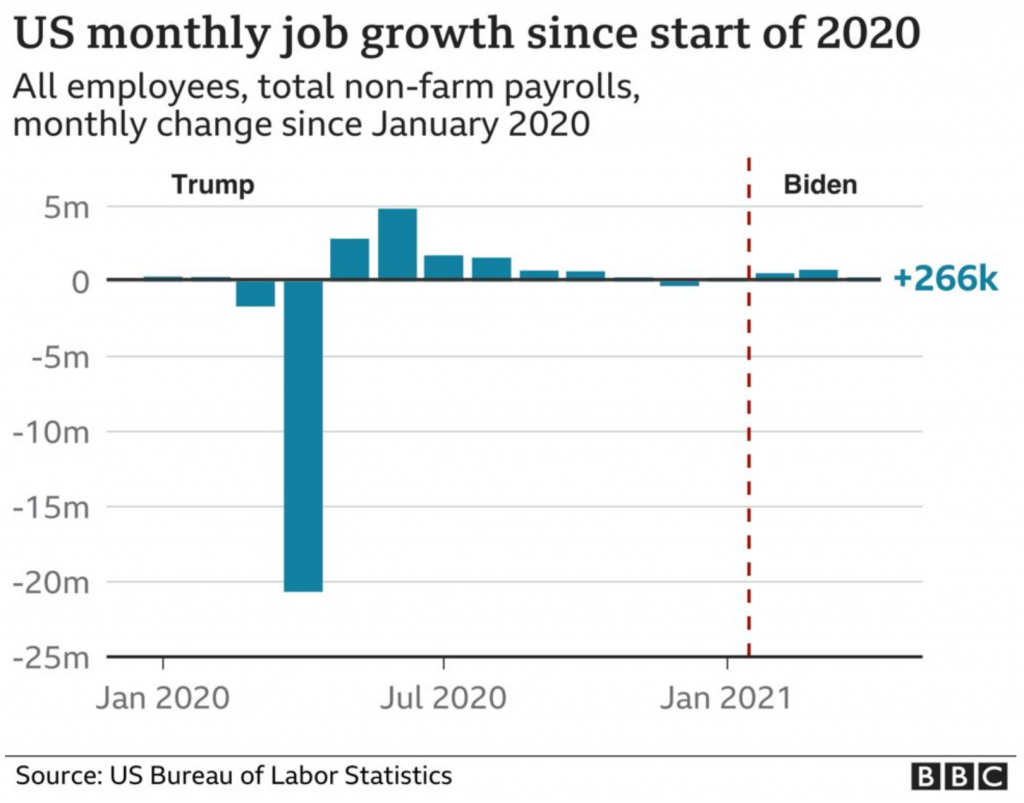
I keep reading the article. And then a couple of paragraphs later I come upon this graphic. It looks at the monthly figures and uses a benchmark line, the red dotted one, to break out those after January 2021 when Biden took office.

But do you notice anything?
The lines for the y-axis are back!
The article had a third graphic that also included axis lines.
I don’t have a lot to say about these graphics in particular, but the most important thing is to try and be consistent. I understand the need to experiment with styles as a brand evolves. Swap out the colours, change the styles of the lines, try a new typeface. (Except for the blue, we are seeing different colours and typefaces here, but that’s not what I want to write about.)
First, I don’t know if these are necessarily style experiments. I suspect not, but let’s be charitable for the sake of argument. I would refrain from experimenting within a single article. In other words, use the lines or don’t, but be consistent within the article.
For the record, I think they should use the lines.
Another point I want to make is with the third graphic. You’ll note that, like I said above, it does use axis lines. But that’s not what I want to mention.

Instead I want to look at the labelling on the axes. Let’s start with the y-axis, the percentage change in GDP on the previous quarter. The top of the chart we have 30%. As I’ve said before, you can see in the Trump administration, the bar for the initial Covid-19 rebound rises above the 30% line. It’s not excessive, I can buy it if you’re selling it.
But let’s go down below the 0-line. Just prior to the rebound we had the crash. Similarly, this extends just below the -30% line. But here we have a big space and then a heavy black line below that -30% line. It looks like the bottom line should be -40%, but scanning over to the left and there is no label. So what’s going on?
First, that heavy black line, why does it appear the same as the baseline or zero-growth line? The axis lines, by comparison, are thin and grey. You use a heavier, darker line to signify the breaking point or division between, in this case, positive and negative growth. Theoretically, you don’t need the two different colours for positive and negative growth, because the direction of the bar above/below that black line encodes that value. By making the bottom line the same style as the baseline, you conflate the meaning of the two lines, especially since there is no labelling for the bottom line to tell you what the line means.
Second, the heaviness of the line draws visual attention to it and away from the baseline, especially since the bottom line has the white space above it from the -30% line. Consider here the necessity of this line. For the 30% line that sets the maximum value of the y-axis, we have the blue bar rising above the line and the administration labels sit nicely above that line. There is no reason the x-axis labels could not exist in a similar fashion below the -30% line. If anything, this is an inconsistency within the one chart, let alone the one graphic.
Third, is it -40%? I contend the line isn’t necessary and that if the blue bar pokes above the 30% line, the orange bar should poke below the -30% line. But, if the designer wants to use a line below the -30% line, it should be labelled.
Finally, look at the x-axis. This is more of a minor quibble, but while we’re here…. Look at the intervals of the years. 2012, 2014, 2016, every two years. Good, make sense. 2018. 20…21? Suddenly we jump from every two years to a three-year interval. I understand it to a point, after all, who doesn’t want to forget 2020. But in all seriousness, the chart ends at 2021 and you cannot divide that evenly. So what is a designer to do? If this chart had less space on the x-axis and the years were more compressed in terms of their spacing, I probably wouldn’t bring this up.
However, we have space here. If we kept to a two-year interval system, I would introduce the labels as 2012, but then contract them with an apostrophe after that point. For example, 2014 becomes ’14. By doing that, you should be able to fit the two-year intervals in the space as well as the ending year of the data set.
Overall, I have to say that this piece shocked me. The lack of attention to detail, the inconsistency, the clumsiness of the design and presentation. I would expect this from a lesser oganisation than the BBC, which for years had been doing solid, quality work.
The first chart is conceptually solid. If Biden spoke about job creation in the first three months of the administration vs. his predecessor, aggregate the data and show it that way. But the presentation throughout this piece does that story a disservice. I wish I knew what was going on.
Credit for the piece goes to the BBC graphics department.

2 thoughts on “On a Line. Or Not.”