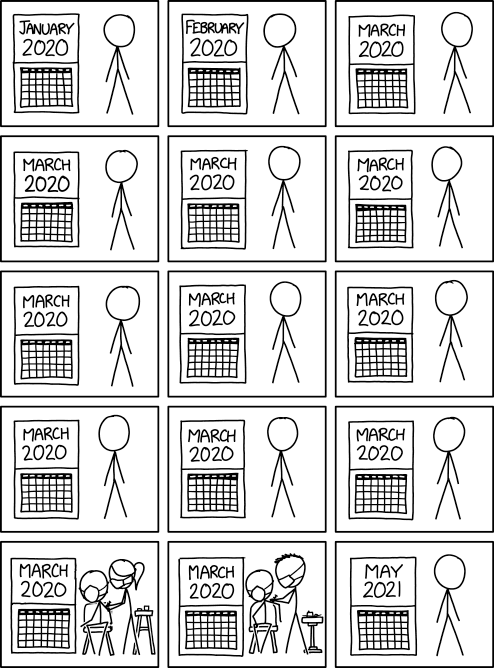
Two Fridays ago I received my second dose of the vaccine. In other words, I’m fully vaccinated and can resume doing…things. Anything. And so this piece from xkcd seemed an appropriate way to wrap up what has been a horrible, no good, terrible year.
As many of my readers know, I prefer my weather cooler and summer is probably my least favourite season—weather wise at least. Appropriately, my vaccination will be kicking in just in time for a small, early season heatwave. Felt like an appropriate time to share this piece from Brian Brettschenider.
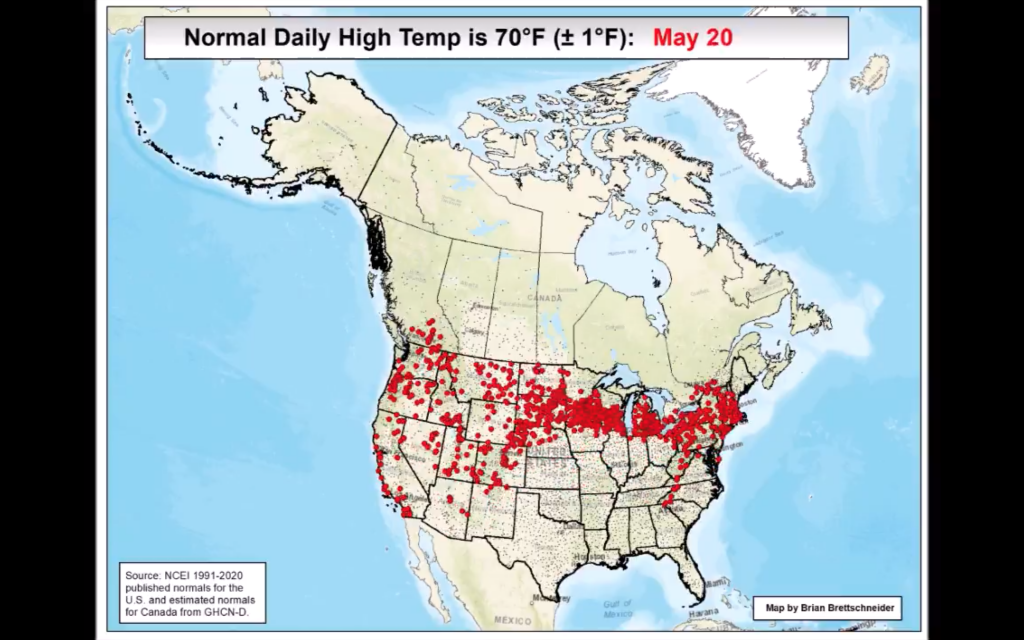
It’s just an animated map showing where in the United States and Canada the daily average high temperature is 70ºF for each day of the year. Here’s where you can expect a daily high of 70ºF for the date of 20 May. Not Philadelphia.
I’m sure going to miss those reds.
Make sure to click through to watch the video on the Twitter.
Credit for the piece goes to Brian Brettschneider.
I’ve seen an uptick in traffic to the blog the last few days, specifically my older content on the Middle East. I don’t exactly have the bandwidth to track the conflict between Israel and Gaza in addition to Covid-19 and my other projects. But as we approached the ten-day mark since Hamas first fired rockets into Israel, I wanted to get a sense of the death toll and so here we are.
The biggest thing to note is that we should take all this data with a grain of salt. For example, the Israeli Defence Force will likely talk up the effectiveness of its Iron Dome air defence system and downplay total civilian deaths. Conversely, Hamas will likely talk up civilian deaths while not detailing at all the deaths of its fighters. And when it comes to deaths in Gaza, it’s not clear what share of those reported by civilian authorities, i.e. the hospital systems, are militant fighters vs. civilians.
Not at all covered by any of this is a discussion of the opportunity costs involved, particularly when it comes to Israeli air strikes. For example, if a Gaza household contains a known Hamas fighter, one can certainly regret an Israeli drone strike that kills the fighter and his non-combatant son whilst in a field. But that strike may be a better outcome than striking the fighter’s home and along with killing not just him and his son, but now his wife, daughters, and the rest of his family.
In what feels like forever ago, I wrote about the trilemma facing the British government as it related to Brexit. Brexit presented Westminster with three choices, of which they could only make two as all three were, together, impossible. Once made, those two choices determined the outcome of Brexit. For better or worse, Prime Minister Boris Johnson made that decision.
We can apply the same trilemma system to Israel in relation to the circumstances of Israel and Palestine. I will skip the long history lesson here. Israel faces some tough decisions. I will also skip the critique of Israeli government policy over the last few decades that brought us to this point. Because here is where we are.
Israel needs to balance three things: the importance of being a representative democracy, of being a Jewish state, and of security control of Gaza and the West Bank for the security of Israel. Here is how that looks.
Tough choices.
If Israel wants to remain an ethnically Jewish state—I’m going to also skip the discourse about Jewishness as an ethnicity, though I will point to Judaism as an ethnic religion as opposed to the other Abrahamic universal religions of Christianity and Islam—and it wants to be retain security control over Palestine, i.e. the Gaza Strip and the West Bank, you have what we have today.
If Israel wants to remain an ethnically Jewish state and it wants to be a representative democracy, you get the Two-State Solution. In that scenario, Palestine, again conceived as Gaza and the West Bank, becomes a fully-fledged independent and sovereign state. Israel remains Jewish and Palestine becomes Arab. But, Israel loses the ability to police and militarily control Gaza and the West Bank, instead relying on its newfound partners in the Palestinian Authority or whatever becomes the executive government of Palestine. This has long been the goal of Middle East peace plans, but over the last decade or so you hear Two-State Solution less and less frequently.
Finally, if Israel wants to be a representative democracy, in which case both Jewish citizens and Arab–Israelis and Palestinians all have the right to full political representation without reservations, e.g. the loyalty oath, and it wants to maintain security control over Gaza and the West Bank, you get something I don’t hear often discussed outside foreign policy circles: a non-Jewish, multi-ethnic Israel. Today Arab–Israelis and Palestinians nearly—if not already—outnumber Jewish Israelis. In a representative democracy, it would be near impossible to maintain an ethnically Jewish state in a county where the Jewish population is in the minority. Consequently, Israel would almost certainly cease being a Jewish state.
One can tinker around the edges, e.g. what are the borders of a Two-State Solution West Bank, but broadly the policy choices above determine the three outcomes.
The outstanding question remains, what future does Israel want?
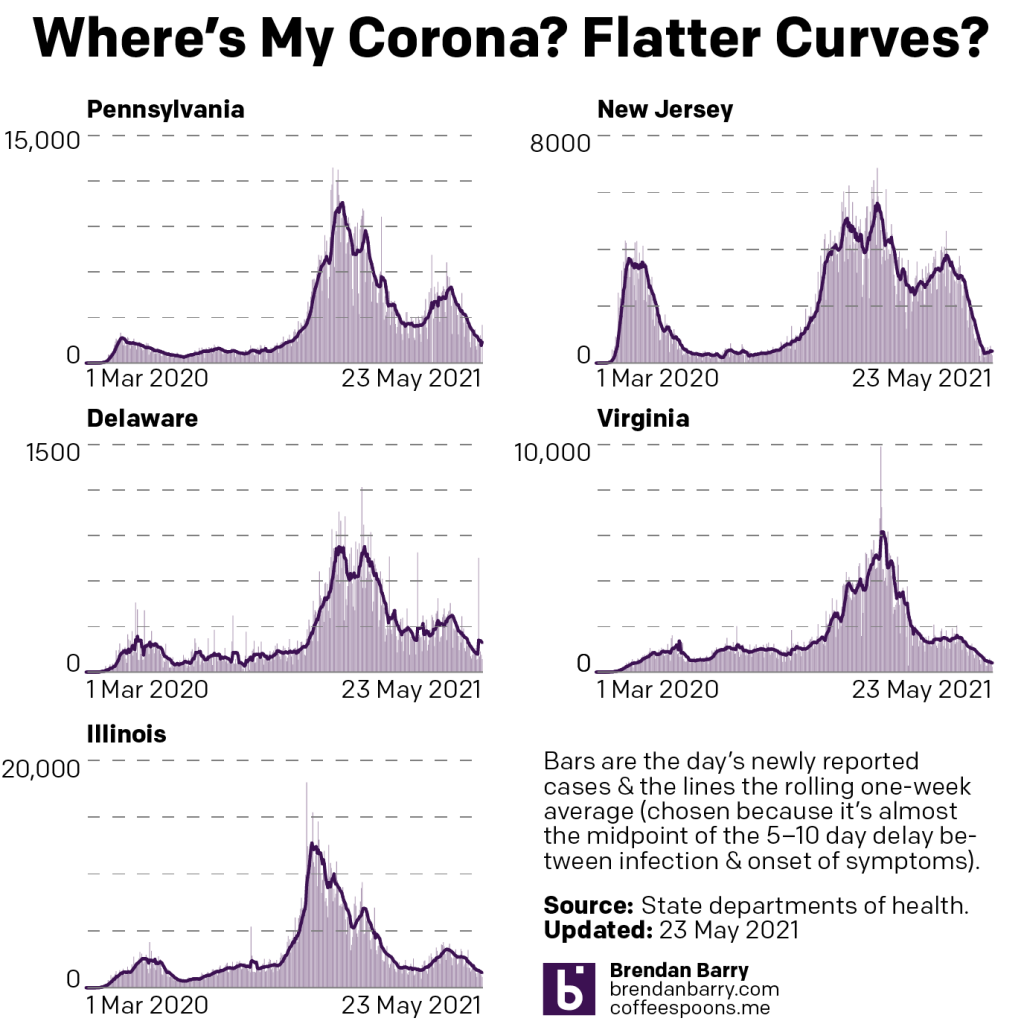
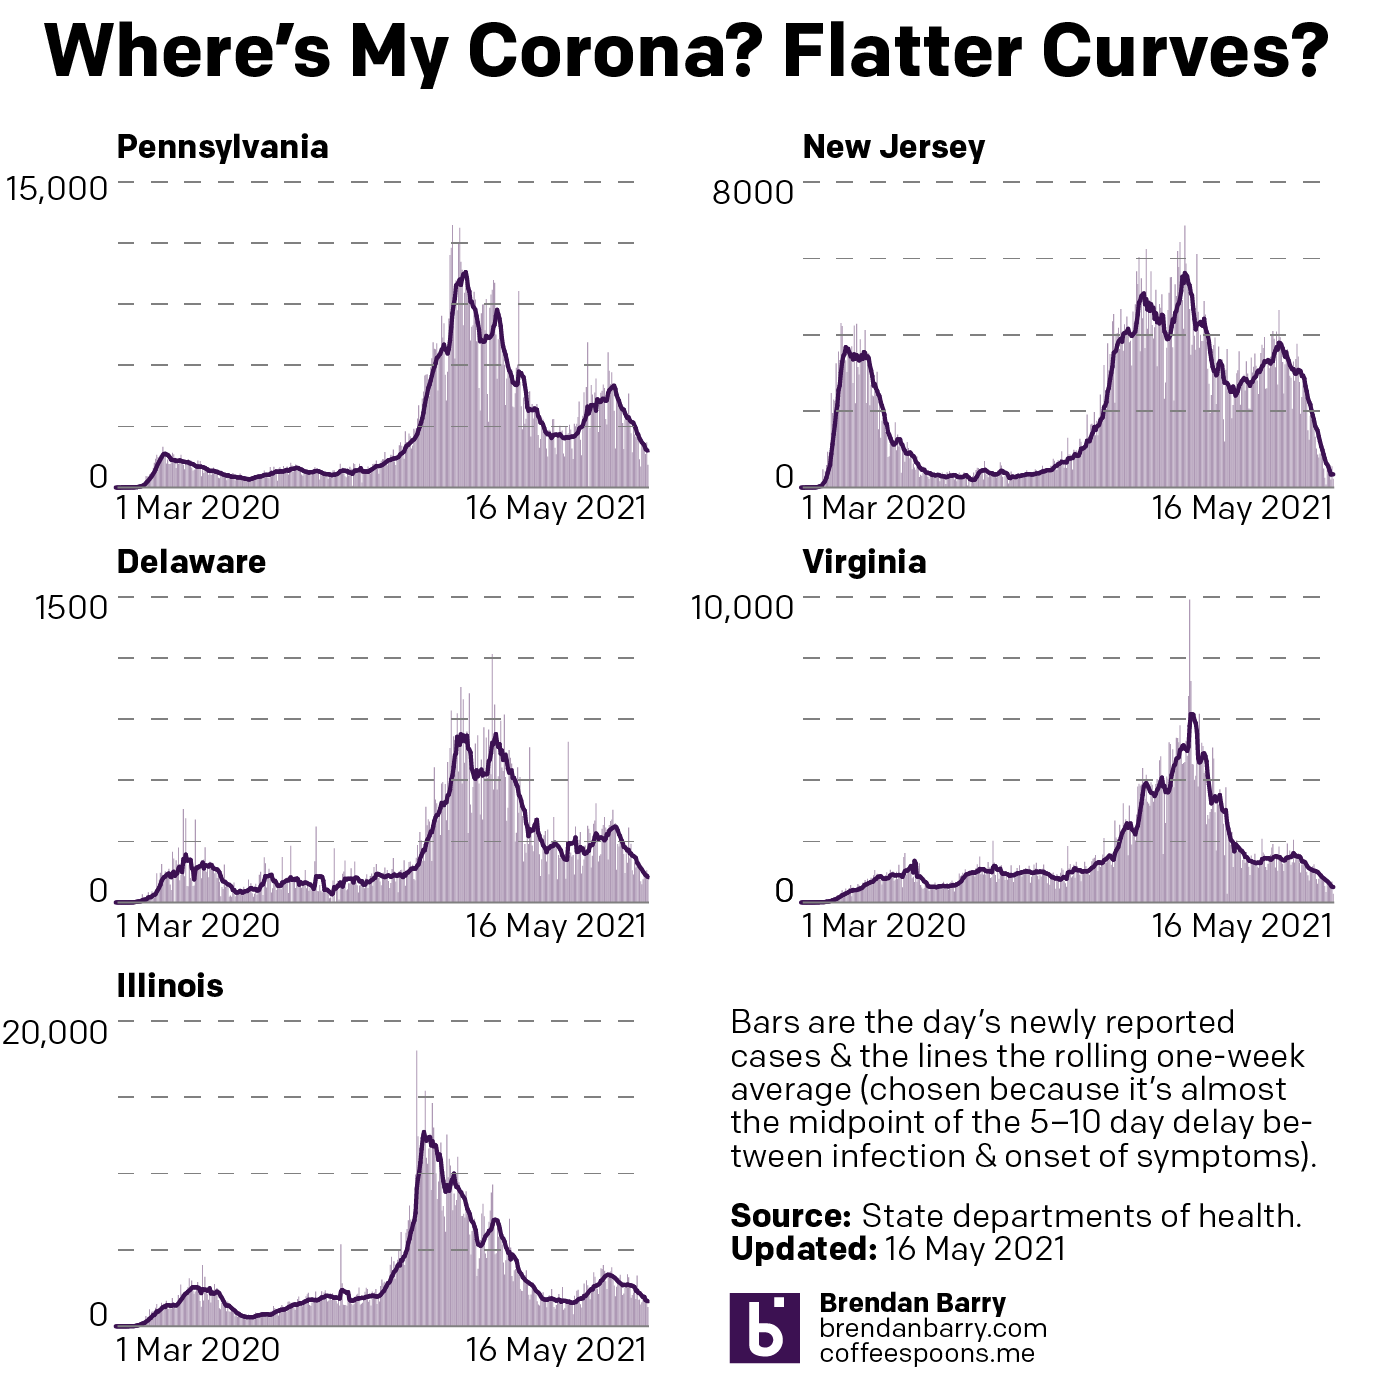
Last week I wrote about how new cases in the five states we cover (Pennsylvania, New Jersey, Delaware, Virginia, and Illinois) were falling and falling rapidly. And this week that pattern continues to hold.
New case curves for PA, NJ, DE, VA, & IL.
If we look at the Sunday-to-Sunday numbers, daily new cases were down in all five states. If we look at the seven-day averages, cases are down in all states. Pennsylvania and Illinois are now down below 2000 new cases per day, Virginia is just over 500 per day, New Jersey is below 400, and Delaware is over 100. These are all levels we last saw last autumn. In other words, we’re not quite back to summer levels of low transmission, but this time next month, I wouldn’t be surprised if we were.
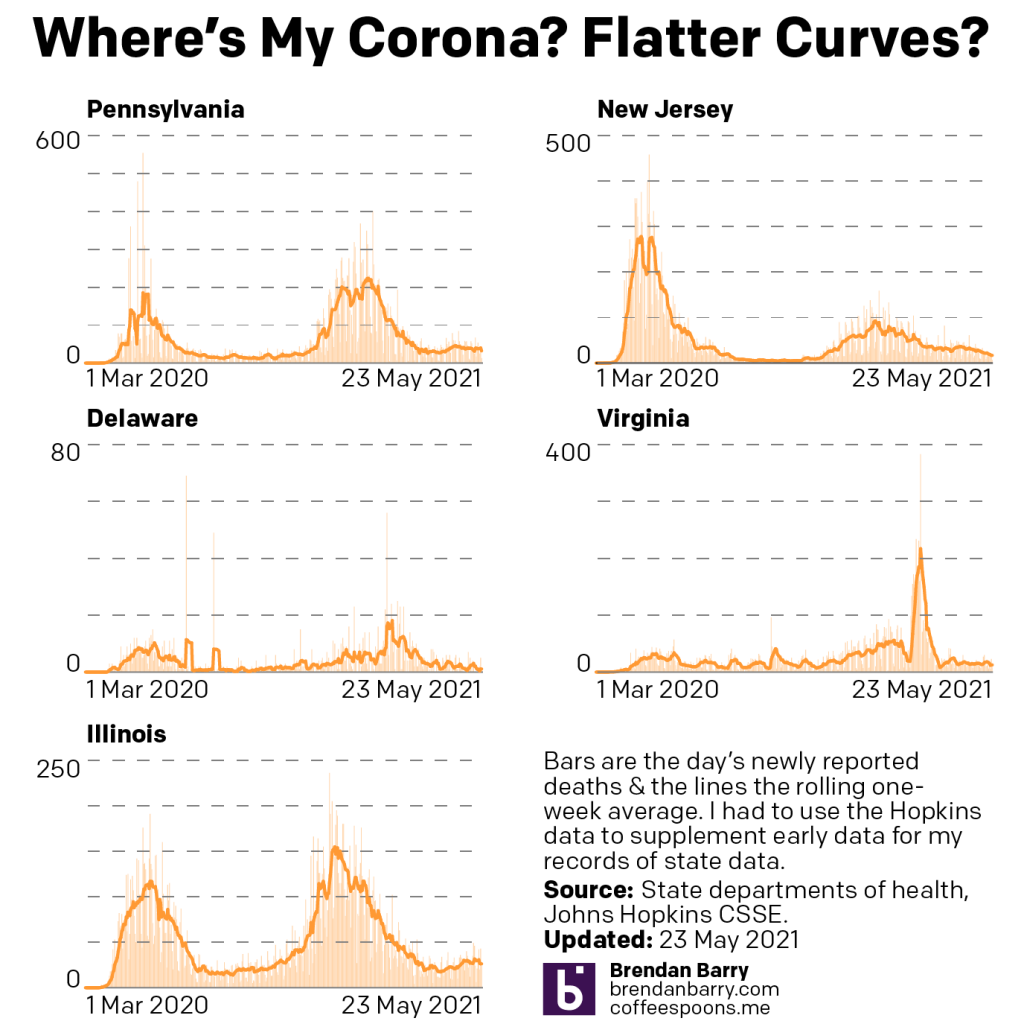
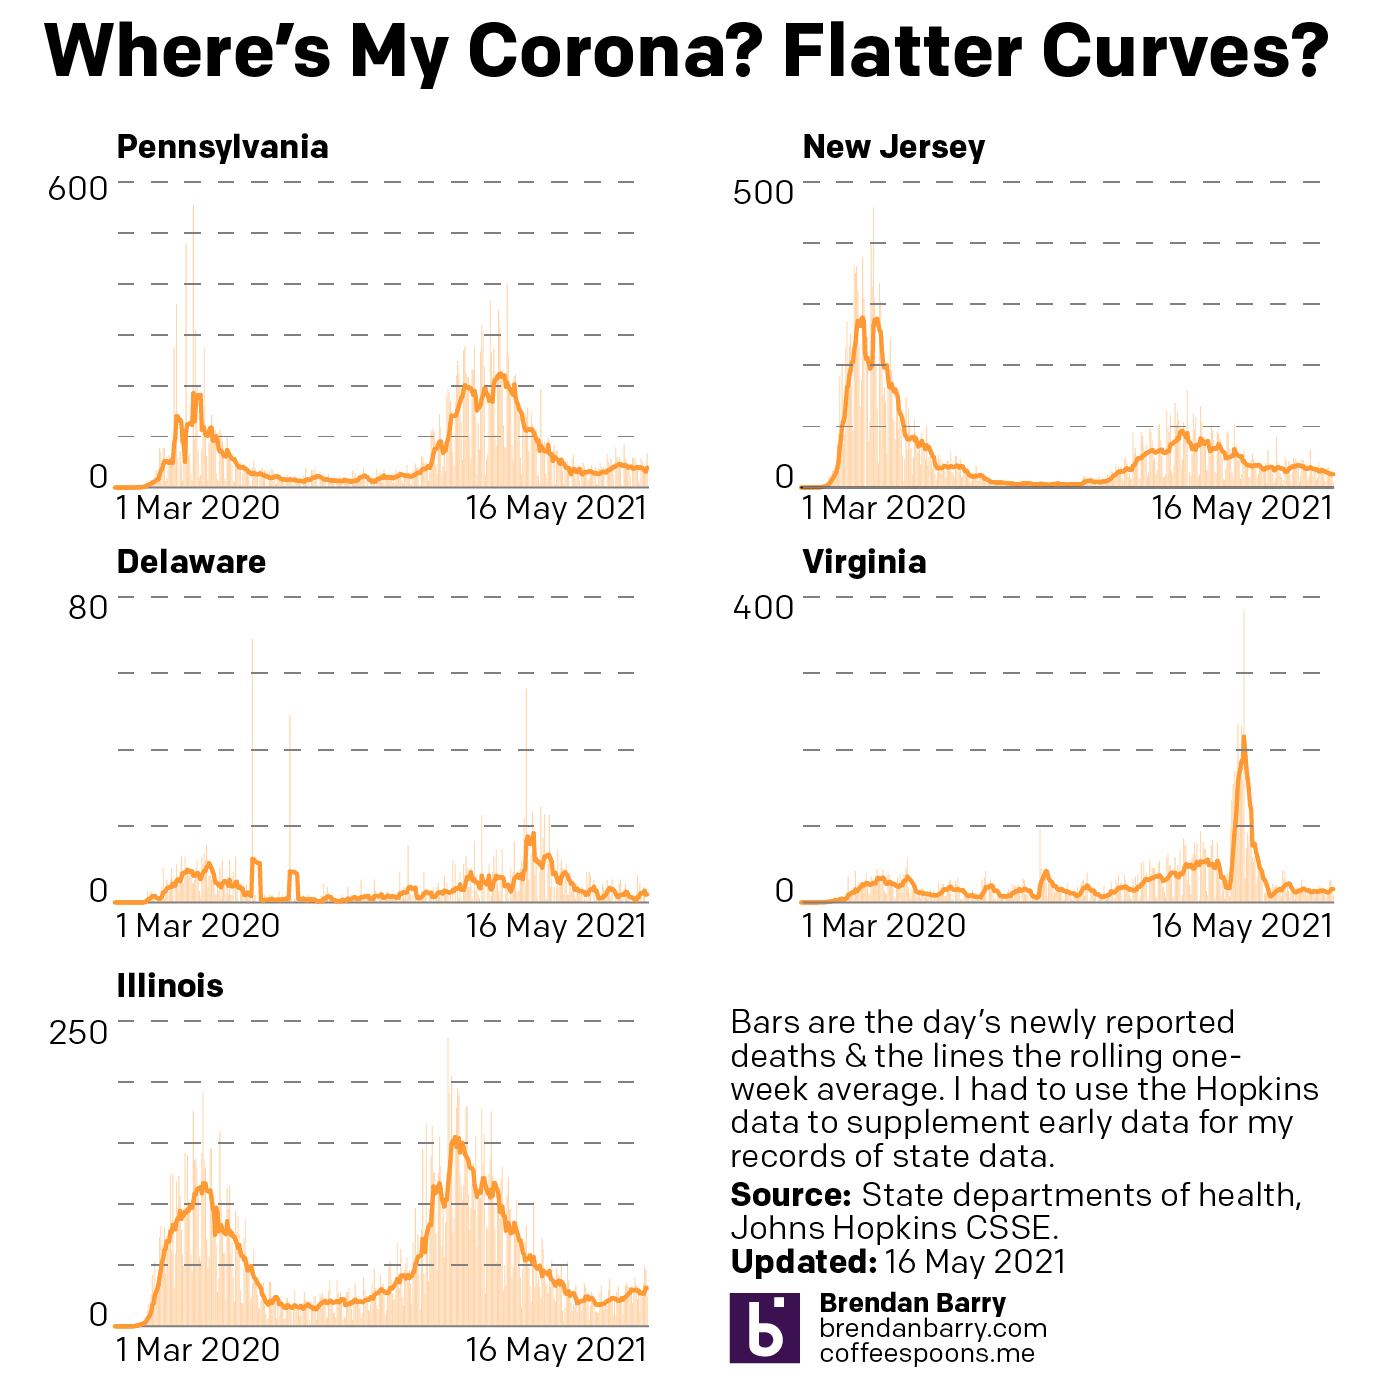
Deaths remain stubbornly resistant to falling.
Death curves for PA, NJ, DE, VA, & IL.
In fact, if we compare the Sunday-to-Sunday numbers we see that the numbers yesterday were largely the same as last Sunday, except in Pennsylvania where they were up significantly. The seven-day average?
Here’s where it gets interesting, because deaths are up slightly. Not by much, for example, Illinois was at 29.1 deaths per day last Sunday, this Sunday? 30.9. Illinois isn’t alone. Pennsylvania, Delaware, and Virginia all have reported slight upticks in their death rates.
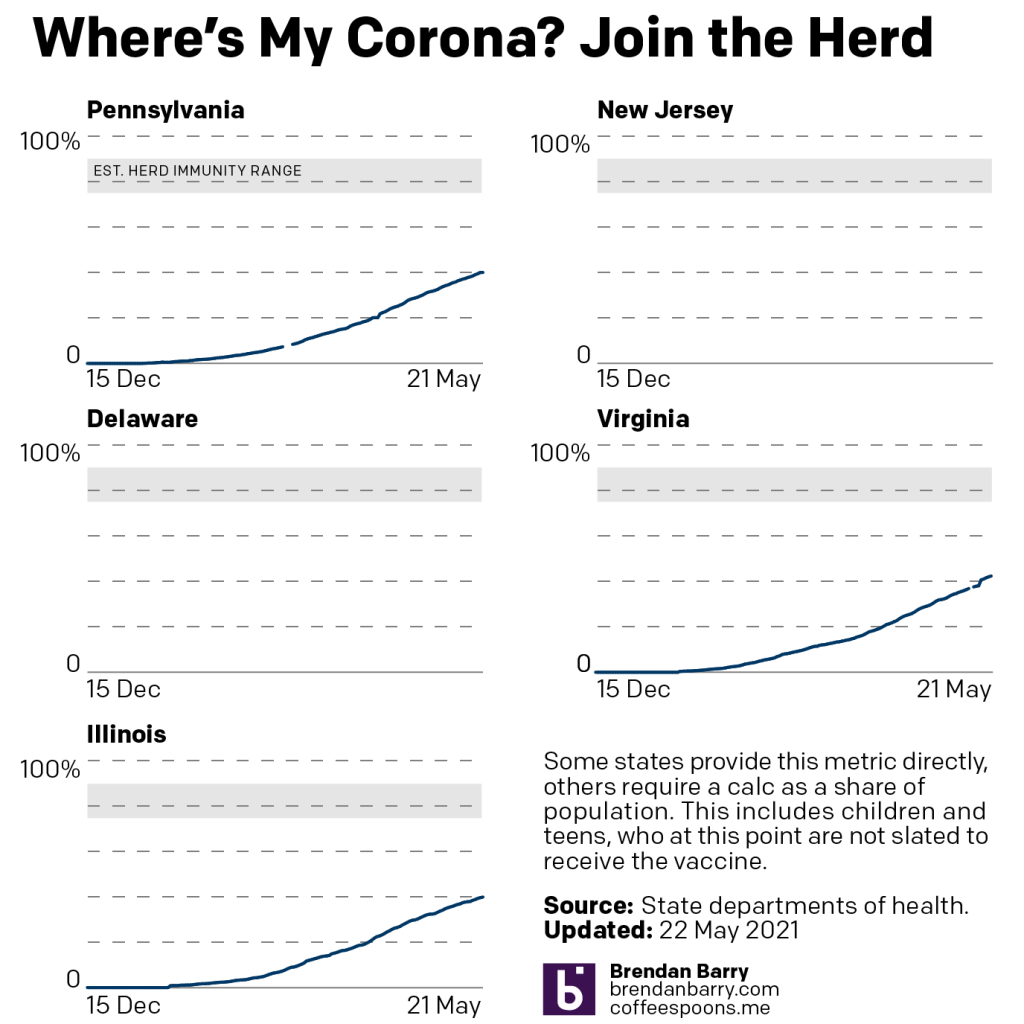
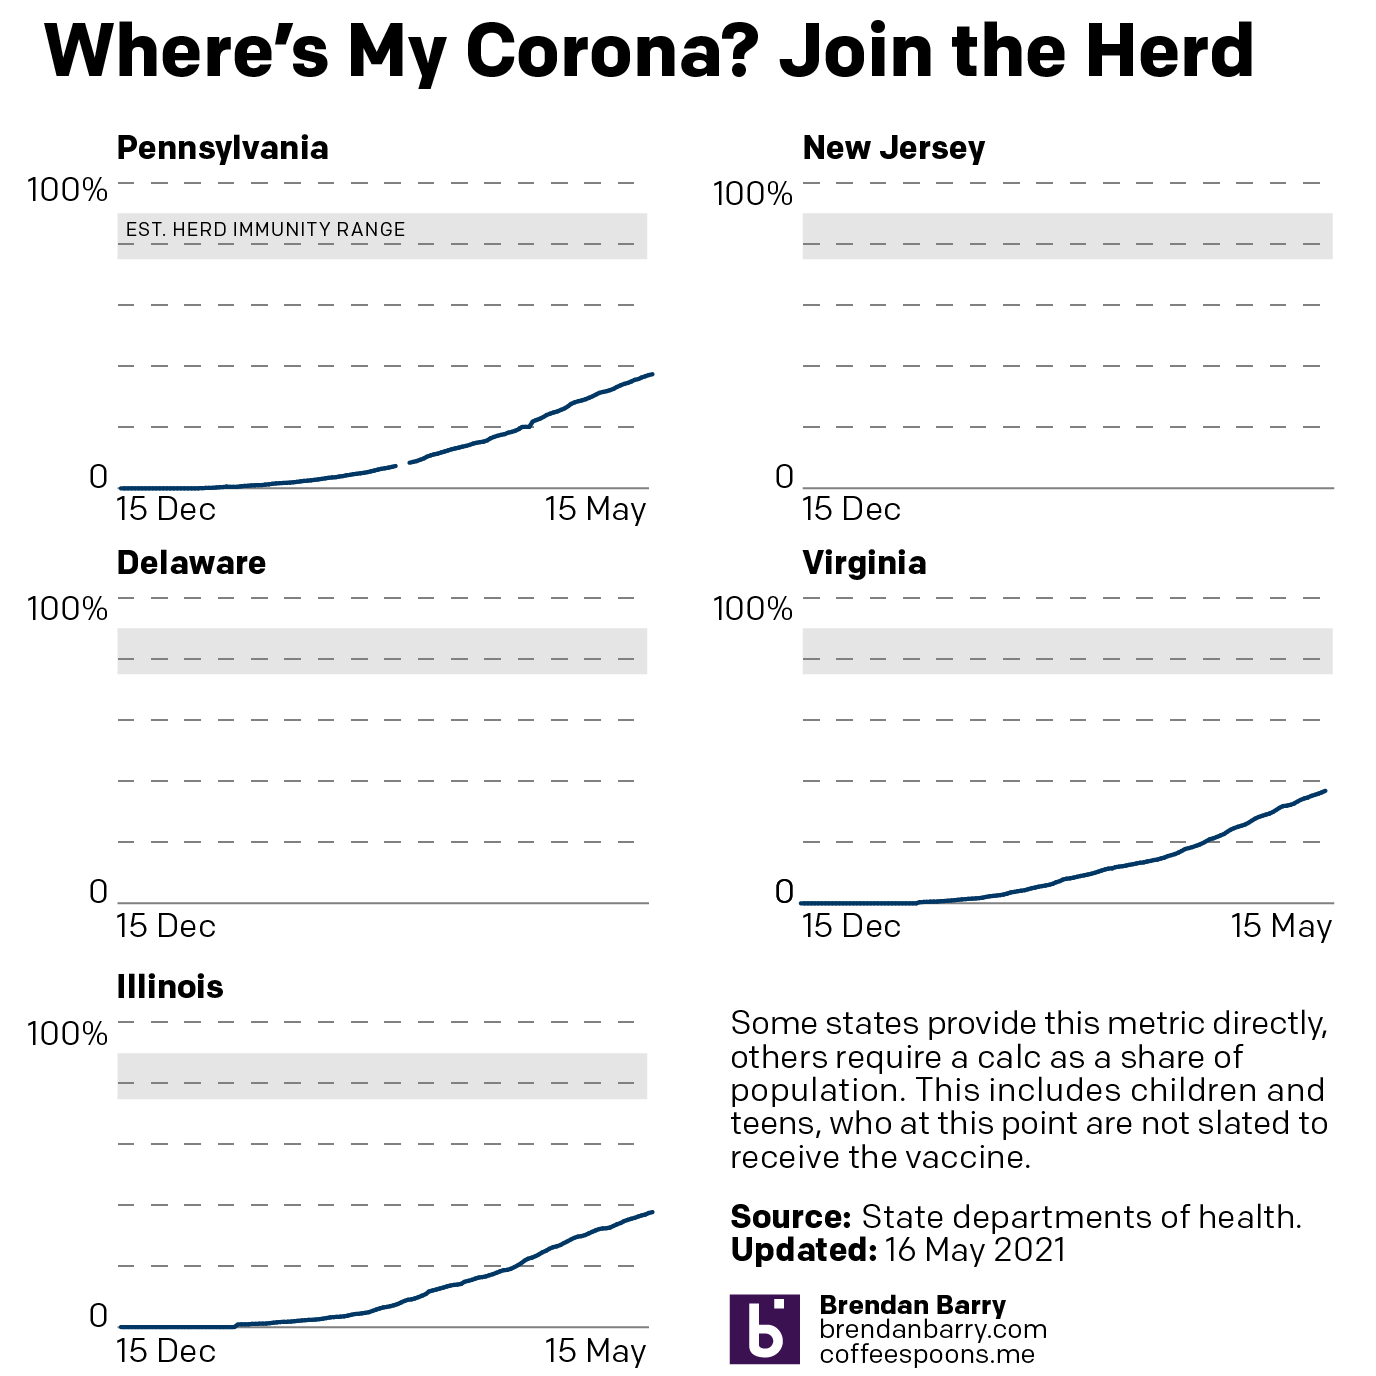
But the biggest concern is the continuing slowdown in vaccinations. We’re perhaps halfway to the point of herd immunity in the three states we track. All three are between 37% and 38%. The thing to track this coming week will be if the rate continues to slow.
One of the things in the pop culture these days is an HBO show called Mare of Easttown. For those that haven’t heard of it, probably my more international audience, it’s a crime drama set in the near suburbs of Philadelphia, a placed called Delaware County that locals simply call Delco.
Last Saturday, the show got its limelight on Saturday Night Live, which spoofed the show in a trailer for a fictional show called Murdur Durdur, from the producers of Mare of Easttown as well as those of It’s Always Sunny in Philadelphia.
The SNL skit included a crime map of which I took a screenshot.
I can see my house from here. Dur.
This caught my attention because one of the characters mentioned Downingtown, which is where your author grew up until he was 16. SNL‘s map really just served as a vehicle to showcase Googling all the town names—and the Philadelphia region has a wealth of them—because the map is all over the place, pun intended.
Conshohocken is actually a real place in neighbouring Montgomery County, on the Schuylkill River (real place). Royersford is also real and also in Montgomery County. Hockessin is also real, but is in Delaware, the state, not Delaware County, which is in Pennsylvania. (Both border the Delaware River.)
The map also makes reference to Lionville, a real place near Downingtown. Your humble author worked in a restaurant in Lionville, located in Uwchlan Township. (They don’t mention that, but I can see people enjoying that name as well.)
The keen observers will also note the placement of a label for Altor, which is only about 2.5 miles from my aforementioned childhood home. Clearly some SNL writer is from or is incredibly familiar with the western suburbs of Philadelphia.
As for the map itself? Well, it’s fictional. One, there is no Jagoff Bridge. Two, it’s actually a map of Bethlehem, to the north in the Lehigh Valley. Route 30 is a real place and does run through Downingtown and Chester County. But nowhere does it cross any town or city like the one the map depicts. Instead that road is Route 378 crossing the Lehigh River. (Fun fact, Route 30 runs west and eventually through Indiana and Illinois, south of Chicago.)
In fact the funny thing is, the map spoofing the show set in Delaware County does not contain a single place in the real Delaware County. Easttown is, for fans of the show, not actually located in Delaware County. Instead, it’s in Chester County. And your author, not surprisingly perhaps, has connections there because it’s where you can find Devon and Berwyn. (My Chicago readers may recognise those names, as several streets were named for Main Line towns.) And where I attended middle- and high-school is across the street from Easttown Township. The real one.
Now I want to actually watch the show. The real one. Not the SNL one. But first I’ll need to grab a Yuengling and a Wawa hoagie.
Credit for the piece goes to probably the writers and props department of Saturday Night Live.
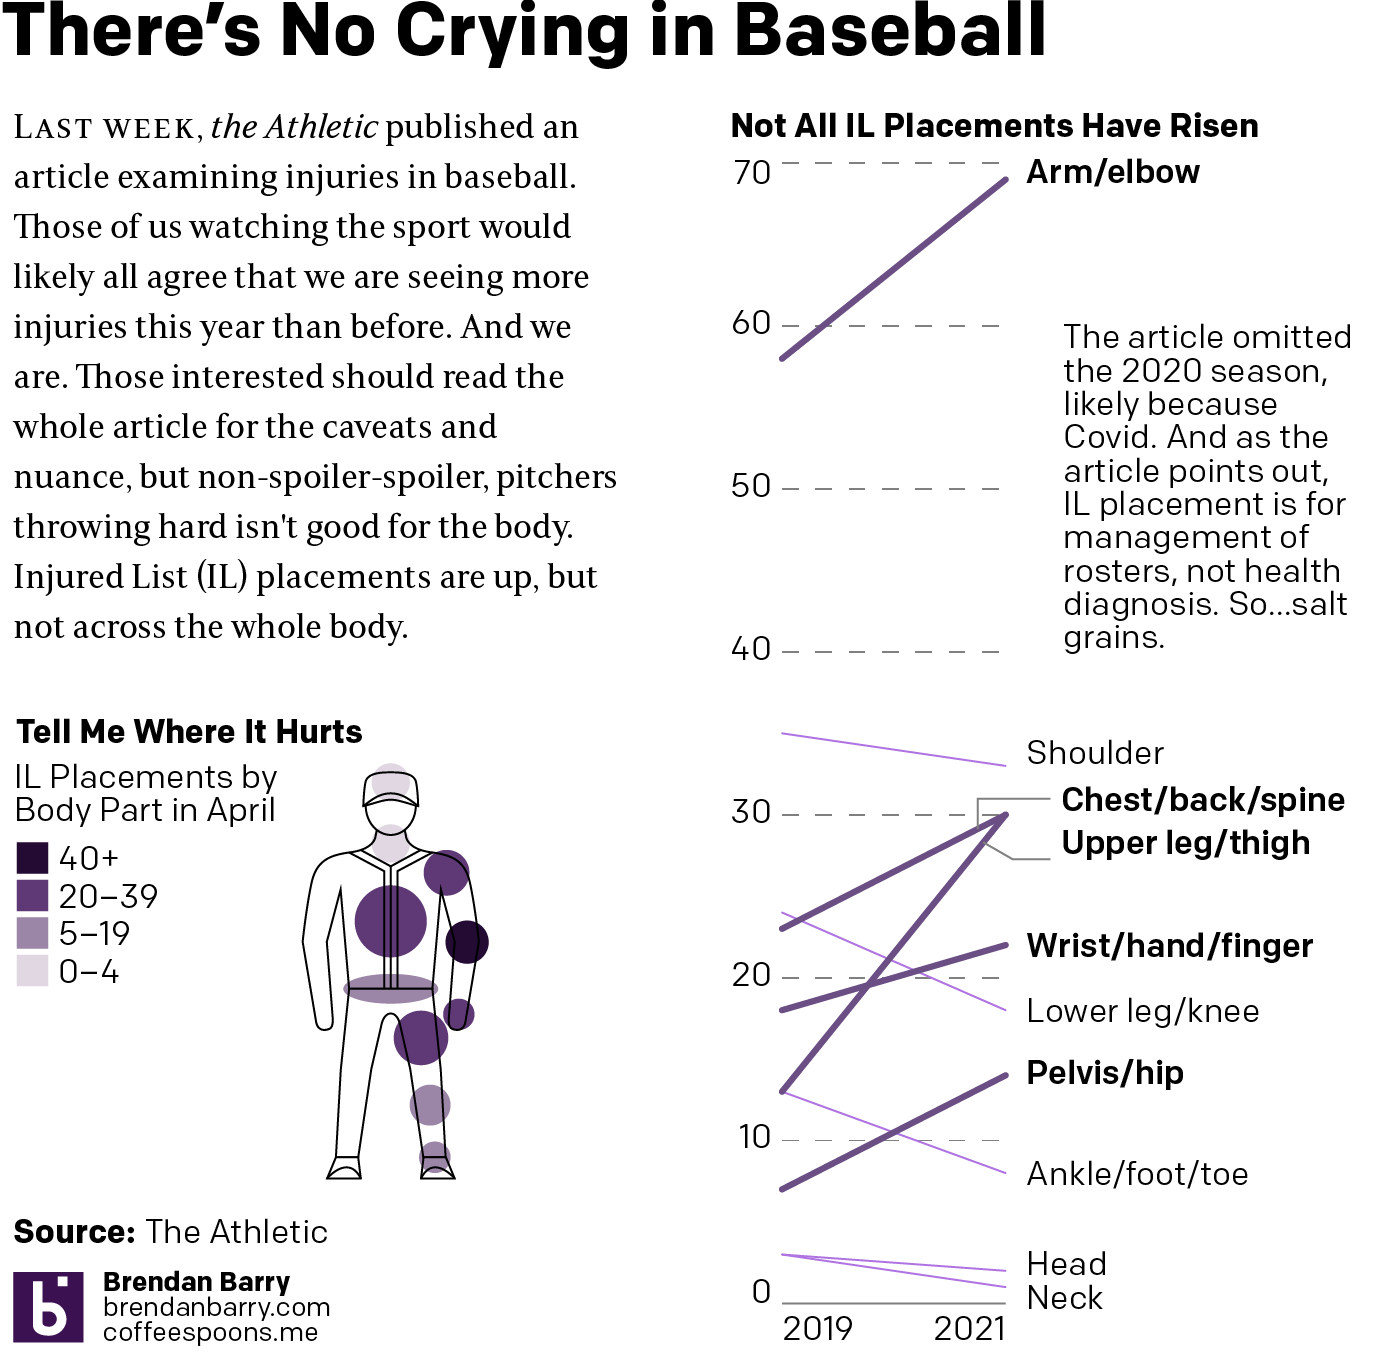
Last week, Ken Rosenthal of the Athletic wrote an article examining the recent spate of injuries in Major League Baseball. For those interested in the sport, the article is well worth the read. For the unfamiliar, baseball played only about 1/3 of the number of games as usual last year due to Covid-19. This year, pitcher after pitcher seems to be falling prey to arm troubles. Position players are straining hamstrings, quads, and other muscles I’ve never heard of let alone used over the last year. And joking aside, therein is thought to be the problem.
And the evidence, in part, shows that we are seeing an increase in the numbers of injuries. But 2020 may not be as much of a problem as youngsters throwing baseballs near 100 mph. But I digress. The article contained a table detailing the numbers of injuries for certain body parts in the first month (April) of the season in both 2021 and 2019, the last comparable season due to Covid-19.
To be fair, the table was nice, but in the exhaustion of post-second dose shot last weekend, I sketched out some things and decided to turn it into a proper post.
Every ten years the United States conducts a census of the entire population living within the United States. My genealogy self uses the federal census as the backbone of my research. But that’s not what it’s really there for. No, it exists to count the people to apportion representation at the federal level (among other reasons).
The founding fathers did not intend for the United States to be a true democracy. They feared the tyranny of mob rule as majority populations are capable of doing and so each level of the government served as a check on the other. The census-counted people elected their representatives for the House, but their senators were chosen by their respective state legislatures. But I digress, because this post is about a piece in the New York Times examining the new census apportionment results.
I received my copy of the Times two Tuesdays ago, so these are photos of the print piece instead of the digital, online editions. The paper landed at my front door with a nice cartogram above the fold.
A cartogram exploded.
Each state consists of squares, each representing one congressional district. This is the first place where I have an issue with the graphic, admittedly a minor one. First we need to look at the graphic’s header, “States That Will Gain or Los Seats in the Next Congress” and then look at the graphic. It’s unclear to me if the squares therefore represent the states today with their numbers of districts, or if we are looking at a reapportioned map. Up in Montana, I know that we are moving from one at-large seat to two seat, and so I can resolve that this is the new apportionment. But I am left wondering if a quick phrase or sentence that declares these represent the 2022 election apportionment and not those of this past decade would be clearer?
Or if you want a graphic treatment, you could have kept all the states grey, but used an unfilled square in those states, like Pennsylvania and Illinois, losing seats, and then a filled square in the states adding seats.
Inside the paper, the article continued and we had a few more graphics. The above graphic served as the foundation for a second graphic that charted the changing number of seats since 1910, when the number of seats was fixed.
Timeline of gains and losses
I really like this graphic. My issue here is more with my mobile that took the picture. Some of these states appear quite light, and they are on the printed page. However, they are not quite as light as these photos make them out to be. That said, could they be darker? Probably. Even in print, the dark grey “no change” instances jump out instead of perhaps falling to the background.
The remaining few graphics are far more straightforward, one isn’t even a graphic technically.
First we have two maps.
Good old primary colours.
Nothing particularly remarkable here. The colours make a lot of sense, with red representing Republicans and blue Democrats. Yellow represents independent commissions and grey is only one state, Pennsylvania, where the legislature is controlled by Republicans and the governorship by Democrats.
Finally we have a table with the raw numbers.
Tables are great for organising information. Do you have a state you’re most curious about, Illinois for example? If so, you can quickly scan down the state column to find the row and then over to the column of interest. What tables don’t allow you to do is quickly identify any visual patterns. Here the designers chose to shade the cells based on positive/negative changes, but that’s not highlighting a pattern.
Overall, this was a really strong piece from the Times. With just a few language tweaks on the front page, this would be superb.
Credit for the piece goes to Weyi Cai and the New York Times graphics department.
Last Friday, the government released the labour statistics from April and they showed a weaker rebound in employment than many had forecasted. When I opened the door Saturday morning, I got to see the numbers above the fold on the front page of the New York Times.
Welcome to the weekend
What I enjoyed about this layout, was that the graphic occupied half the above the fold space. But, because the designers laid the page out using a six-column grid, we can see just how they did it. Because this graphic is itself laid out in the column widths of the page itself. That allows the leftmost column of the page to run an unrelated story whilst the jobs numbers occupy 5/6 of the page’s columns.
If we look at the graphic in more detail, the designers made a few interesting decisions here.
Jobs in detail
First, last week I discussed a piece from the Times wherein they did not use axis labels to ground the dataset for the reader. Here we have axis labels back, and the reader can judge where intervening data points fall between the two. For attention to detail, note that under Retail, Education and health, and Business and professional services, the “illion” in -2 Million was removed so as not to interfere with legibility of the graphic, because of bars being otherwise in the way.
My issue with the axis labels? I have mentioned in the past that I don’t think a designer always needs to put the maximum axis line in place, especially when the data point darts just above or below the line. We see this often here, for example Construction and Manufacturing both handle it this way for their minimums. This works for me.
But for the column above Construction, i.e. State and local government and Education and health, we enter the space where I think the graphic needs those axis lines. For Education and health, it’s pretty simple, the red losses column looks much closer to a -3 million value than a -2 million value. But how close? We cannot tell with an axis line.
And then under State and local government we have the trickier issue. But I think that’s also precisely why this could use some axis lines. First, almost all the columns fall below the -1 million line. This isn’t the case of just one or two columns, it’s all but two of them. Second, these columns are all fairly well down below the -1 million axis line. These aren’t just a bit over, most are somewhere between half to two-thirds beyond. But they are also not quite nearly as far to -2 million as the ones we had in the Education and health growth were near to -3 million.
So why would I opt to have an axis line for State and local governments? The designers chose this group to add the legend “Gain in April”. That could neatly tuck into the space between the columns and the axis line.
Overall it’s a solid piece, but it needs a few tweaks to improve its legibility and take it over the line.
Credit for the piece goes to Ella Koeze and Bill Marsh.
Last week I wrote about how, for new cases, we had seen a few consecutive days of increasing cases. Were we witnessing an aberration, a one-off “well, that was weird”? Or was this the beginning of a trend towards increasing new cases?
A week later and we have our answer. Just a one-off.
New cases curves for PA, NJ, DE, VA, & IL.
If we focus on just the seven-day average, in just one week the numbers in New Jersey have fallen by half. In Pennsylvania, Virginia, it’s by one quarter. Illinois is a little less than that, as is Delaware. Across the board, numbers are falling and falling quickly.
Deaths curves for PA, NJ, DE, VA, & IL.
When we move to deaths, we’re beginning to see an improvement. As the lagging indicator, we would expect these to begin to drop a few weeks after new cases begin to drop. We have begun to see what might be the peaks of deaths in a few states.
Full vaccination curves for PA, NJ, DE, VA, & IL.
Over this coming week, I’ll be closely watching these numbers to see if we can finally begin to say authoritatively that deaths are in decline.
Vaccinations drive all of this. And we continue to see the total number of fully vaccinated people climbing in Pennsylvania, Virginia, and Illinois. But, that rate is slowing down. Most likely we are entering a phase where those eager for their shots have largely received them. Now begins the challenge of vaccinating those who might lack easy access or have reservations.
But to be clear, we need those people to become fully vaccinated before we can truly begin to return to normal. Whatever normal is. It’s hard to remember anymore.