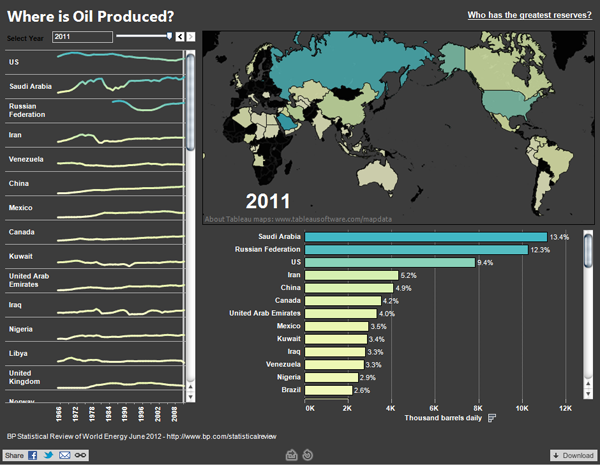
Oil, sweet oil. How we depend upon you for modern civilisation. BP published a report on world energy that Craig Bloodworth visualised using Tableau.

The piece has three tabs; one is for production, another consumption, and a third for reserves. (The screenshot above is for production.) But when I look at each view I wonder whether all the data views are truly necessary?
In production for example, is a map of a few countries truly informative? The usual problem of Russia, Canada, the US, and China dominating the map simply because they are geographically large countries reappears. Furthermore the map projection does not particularly help the issue because it expands the area of Siberia and the Canadian arctic at the expense of regions near the Equator, i.e. the Middle East. That strikes me as counter-intuitive since some of the largest oil producers are actually located within the Middle East.
A map could very well be useful if it showed more precisely where oil is produced. Where in the vastness of Russia is oil being sucked out of the ground? Where in Saudia Arabia? In the US? Leave the numbers to the charts. They are far more useful in comparing those countries like Kuwait that are major producers but tiny geographies.
Lastly about the maps (and the charts), the colour is a bit confusing because nowhere that I have found in my quick exploration of the application does the piece specify what the colours mean. That would be quite useful.
Finally, about the data, the total amount of oil produced, but more importantly consumed, is useful and valuable data. But seeing that China is the second largest consumer after the US is a bit misleading. Per capita consumption would add nuance to the consumption view, because China is over three-times as large as the US in population. Consequently, the average Chinese is not a major consumer. The problem is more that there are so many more Chinese consumers than consumers in any other nation—except India.
A bit of a hit and miss piece. I think the organisation and the idea is there: compare and contrast producers and consumers of oil (and consumers of other energy forms). Alas the execution does not quite match the idea.
Credit for the piece goes to Craig Bloodworth, via the Guardian.
